STI 2018 Conference Proceedings
Proceedings of the 23rd International Conference on Science and Technology Indicators
All papers published in this conference proceedings have been peer reviewed through a peer review process administered by the proceedings Editors. Reviews were conducted by expert referees to the professional and scientific standards expected of a conference proceedings.
Chair of the Conference
Paul Wouters
Scientific Editors
Rodrigo Costas Thomas Franssen Alfredo Yegros-Yegros
Layout
Andrea Reyes Elizondo Suze van der Luijt-Jansen
The articles of this collection can be accessed at https://hdl.handle.net/1887/64521
ISBN: 978-90-9031204-0
© of the text: the authors
© 2018 Centre for Science and Technology Studies (CWTS), Leiden University, The Netherlands
aggregators
Zohreh Zahedi* and Rodrigo Costas**
*z.zahedi.2@cwts.leidenuniv.nl;
CWTS, Leiden University, Kolffpad 1, Leiden, 2333 BN (The Netherlands)
**rcostas@@cwts.leidenuniv.nl
CWTS, Leiden University, Kolffpad 1, Leiden, 2333 BN (The Netherlands)
DST-NRF Centre of Excellence in Scientometrics and Science, Technology and Innovation Policy, Stellenbosch University (South Africa)
Introduction
Data quality issues regarding social media data have been highlighted as one of the grand challenges for the development of altmetrics (Haustein, 2016; Bar-Ilan & Halevi, 2017; Chamberlain, 2013; Peters et al., 2014; Zahedi, Fenner, & Costas, 2014, 2015). Production of transparent and reliable social media indicators is very critical for the reliability and validity of these indicators and for the future development of more advanced social media studies of science (Costas, 2017). Development and application of social media metrics is dependent on the characteristics and quality of the underlying data. Altmetric data aggregators offer access to data and metrics related with the online activity and social media interactions between social media users and scholarly objects. Methodological choices in the tracking, collecting, and reporting of altmetric data could influence the metrics provided by different altmetric data aggregators. Understanding the extent to which social media metrics from similar data sources are correlated across different altmetric data aggregators and understanding the underlying reasons of inconsistencies in their metrics is central for the proper development of social media metrics based on these data. This paper studies how consistent the different aggregators are in terms of the social media metrics provided by them and discusses the extent to which the strategies and the methodological approaches in the data aggregation and reporting metrics adapted by altmetric data aggregators introduce challenges for interpreting the provided metrics. The final aim of this paper is to create awareness of the effects of these differences in the conceptual meaning and interpretation of social media metrics.
Data and Methodology
The DOIs of PloS ONE publications (n= 31,437) published in 2014 and recorded in the Web of Science database were used to collect social media metrics data (Facebook, Twitter, Mendeley, and Wikipedia) from four major altmetric data aggregators:
- Altmetric.com REST API (http://api.altmetric.com/)
- CrossRef Event Data API (www.eventdata.crossref.org/guide/service/query-api/)
1 This paper is a short version of our paper entitled “General discussion of data quality challenges in social media
STI Conference 2018 · Leiden
- Lagotto open source application API (www.lagotto.io/docs/api/)
- Plum Analytics (https://plu.mx/plum/a/?doi=[doi])
Readerships counts were also directly extracted from the Mendeley REST API (http://dev.mendeley.com/). All data collection was performed on 11 June 2017, exactly the same date for all the data collection in order to minimize time effects in the data collection. Pearson correlation analysis is used to identify the relationship and (dis)agreements between the metrics provided by these aggregators. As the same metric instead of different metrics (e.g. tweets with Facebook counts) provided by different aggregators are analyzed, the correlation of the values (i.e. Pearson) is more adequate than the correlation of the rank orders (i.e. Spearman). It enables both to test the linearity of the relationship between the variables and to account for the potential inconsistencies between them. Finally, possible reasons for the differences in the same metrics provided by the different data aggregators are proposed and discussed.
Results
Correlation of social media metrics across altmetric data aggregators
In this section we study the differences in the relation of the social media metrics across altmetric data aggregators using Pearson correlation analyses. Publications with at least a non-zero score in any of the aggregators for each of the analyzed social media data sources (Facebook, Twitter, Mendeley, and Wikipedia) have been considered1 F
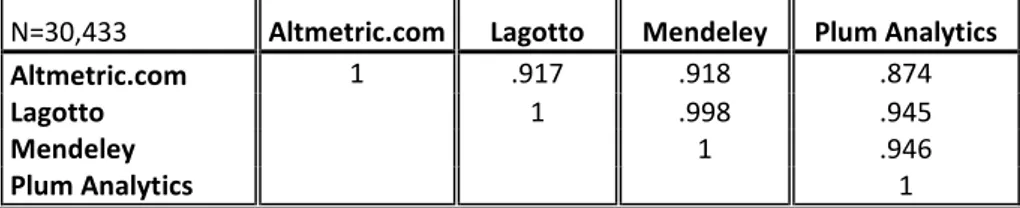
2. The results of correlation analysis (Tables1-4)
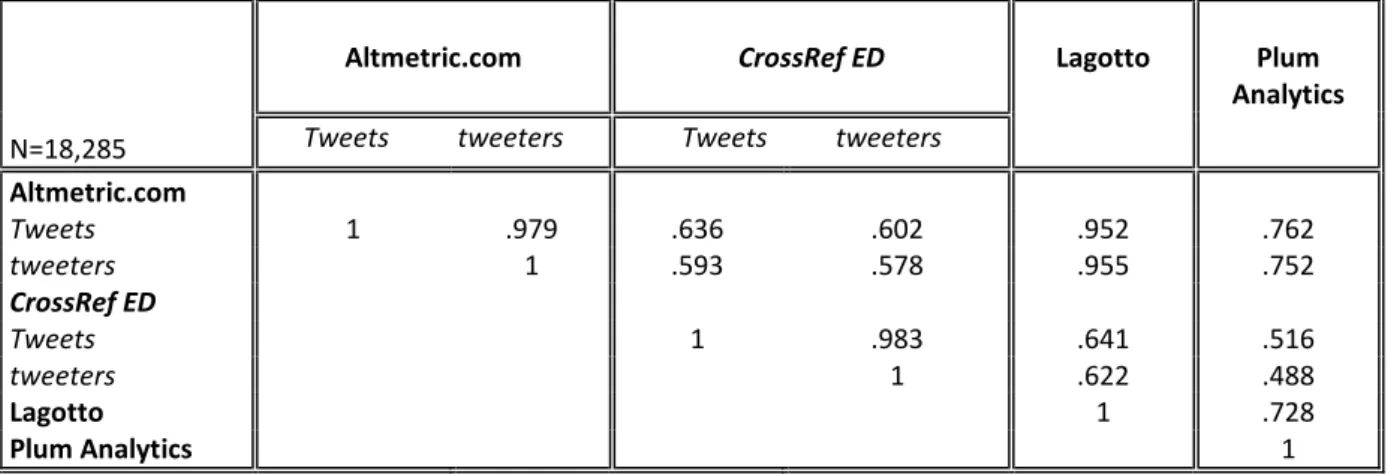
showed that these altmetric data aggregators are relatively consistent with respect to Mendeley readership counts provided by them as it correlates quite strongly (r>.8) across all aggregators (Table 1). The correlation analyses of Twitter counts (Table 2) ranges from moderate correlations between tweets provided by CrossRef ED and all other aggregators (r=.5 to r=.6) while Altmetric.com and Lagotto shows the highest correlation (r=.9) followed by Altmetric.com and Plum Analytics (r=.7). These results suggest a reasonably good agreement in the tweet counts among these data aggregators. Regarding Wikipedia counts (Table 3), Plum Analytics and Altmetric.com are strongly correlated (r=.8), which shows their strong agreement in Wikipedia counts. In contrast, the correlations for Wikipedia counts among the other combinations of aggregators are in general rather weak or just moderate, ranging between r=.2 (for Lagotto and CrossRef ED) and r=.5 (for Lagotto and Altmetric.com). Although Facebook counts from Lagotto and Plum Analytics exhibit the highest correlation compared to all other aggregators, the correlation is just of r=.3. The correlations of Facebook counts with Altmetric.com are in all cases very weak (Table 4). Therefore, Facebook counts show the lowest correlations across all aggregators and hence strong discrepancies in terms of this indicator exist.
Table 1.Pearson Correlation analysis across different aggregators and their Mendeley readership counts.
N=30,433 Altmetric.com Lagotto Mendeley Plum Analytics
Altmetric.com 1 .917 .918 .874
Lagotto 1 .998 .945
Mendeley 1 .946
Plum Analytics 1
2. Facebook and Mendeley readership counts are not provided by CrossRef ED. Tweet and tweeter user counts are
Table 2.Pearson Correlation analysis across different aggregators and their Tweets and tweeters.
N=18,285
Altmetric.com CrossRef ED Lagotto Plum
Analytics
Tweets tweeters Tweets tweeters
Altmetric.com
Tweets 1 .979 .636 .602 .952 .762
tweeters 1 .593 .578 .955 .752
CrossRef ED
Tweets 1 .983 .641 .516
tweeters 1 .622 .488
Lagotto 1 .728
Plum Analytics 1
Table 3.Pearson Correlation analysis across different aggregators and their Wikipedia counts.
N=1,727 Altmetric.com CrossRef ED Lagotto Analytics Plum
Altmetric.com 1 .380 .551 .867
CrossRef ED 1 .276 .388
Lagotto 1 .459
Plum Analytics 1
Table 4.Pearson Correlation analysis across different aggregators and their Facebook counts.
N=6,953 Altmetric.com Lagotto Plum Analytics
Altmetric.com 1 .112 .134
Lagotto 1 .397
Plum Analytics 1
Reasons for the differences in the social media metrics reported across different altmetric data aggregators
This section focuses on briefly discussing the possible differences in the social media metrics with respect to the data collection, aggregation, and reporting choices adopted by the different aggregators.
Data collection choices
The way each aggregator collects the data from the related social media sources could have an effect on the metrics. For instance, collecting data directly from the original social media platform, or indirectly through a third-party vendor, bot, or agent influence the provided metrics. In addition, the use of different APIs, the focus on different identifiers, URLs, landing pages, or scholarly objects can explain the differences in the values of metrics reported by different altmetric data aggregators.
Data aggregation and reporting choices
STI Conference 2018 · Leiden
Updating choices
The metrics provided by altmetric data aggregators could also depend on the time that each aggregator queries the original social media sources and the frequency of update (real-time or daily, weekly, or monthly updates) of their metrics. Hence, the differences in the date and time when social media events occurred and when the aggregator collected them as well as the time lags in the frequency of updates of each aggregator influence the reported metrics by each aggregator.
Others
Other technical issues include the matching rate of identifiers with journal publisher’s platforms and their policy in allowing access, API speed and rate of querying, availability of different ranges of identifiers (DOIs, PubMed, SSRN, ArXiv IDs, etc.) tracked, how shortened URLs are handled, how rate limits of data aggregator and third party provider APIs are handled, or the functioning of the rate of traffic over the API could influence the rate of querying APIs and hence could also influence the metrics provided by the aggregators.
Conclusions and outlook
The results of the correlation analysis presented in this paper highlights the fact that there are relevant differences in the consistency of the social media metrics across the analysed altmetric data aggregators. Based on the above results, Mendeley counts exhibit the highest correlations and thus the Mendeley counts provided by all data aggregators are relatively consistent. Twitter counts show moderate to high correlations across some data aggregators. The overall correlation analyses of Twitter counts suggest a reasonably good agreement among data aggregators. The lowest correlations among aggregators are found for Facebook and Wikipedia counts. For these sources it seems that the different choices adopted by each of the aggregators in collecting and processing the data have a strong influence on the final counts reported by them. The same high consistency across aggregators regarding Mendeley readership and similar levels of correlation between Mendeley readership, tweets, and Wikipedia mentions across similar altmetric data aggregators have been highlighted in some previous studies (Meschede & Siebenlist, 2018; Ortega, 2017; Bar-Ilan and Halevi, 2017).
and increasing transparency of the methodological choices for the calculation and reporting metrics are the best approach from an analytical perspective (Wouters, Zahedi, & Costas, 2018).
Understanding how methodological and technical choices can influence the analytical reliability and validity of social media metrics is a crucial element in the future development of social media studies of science. Some recommendations for altmetric data aggregators could include increasing of the transparency around the methodological choices in data collection, aggregation, and calculation of their metrics. Altmetric data users, researchers, and data aggregators should be aware of the unintended effects that these methodological choices can have in the valid use and application of social media metrics data.
References
Bar-Ilan, J., & Halevi, G. (2017). Altmetric Counts from Different Sources: A Case Study of JASIST Articles Published Between 2001 and Mid 2017. In altmetrics17. The dependencies of altmetrics. Retrieved from
http://altmetrics.org/wp-content/uploads/2017/09/altmetrics17_paper_3.pdf
Chamberlain, S. (2013). Consuming Article-Level Metrics: Observations and Lessons, 2(2). Costas, R. (2017). Towards the social media studies of science: social media metrics, present and
future. Bibliotecas. Anales de Investigación, 13(1), 1–5.
Haustein, S. (2016). Grand challenges in altmetrics: heterogeneity, data quality and dependencies. Scientometrics, 108(1), 413–423. doi:10.1007/s11192-016-1910-9 Haustein, S., Bowman, T. D., & Costas, R. (2016). Interpreting Altmetrics: Viewing Acts on
Social Media through the Lens of Citation and Social Theories. In C. R. Sugimoto (Ed.),
Theories of Informetrics and Scholarly Communication (pp. 372–406). Berlin, Boston: De Gruyter. doi:10.1515/9783110308464-022
Holmberg, K. (2015). Classifying altmetrics by level of impact. In In Salah, A.A., Tonta, Y., Salah, A.A.A., Sugimoto, C., & Al, U. Proceedings of the 15th International Society of Scientometrics and Informetrics Conference, Istanbul, Turkey.
Meschede, C., & Siebenlist, T. (2018). Cross-metric compatability and inconsistencies of altmetrics. Scientometrics. doi:10.1007/s11192-018-2674-1
Ortega, J.L. (2018). Reliability and accuracy of altmetric providers : a comparison among Altmetric , PlumX and Crossref Event Data. Scientometrics, 1-16. doi:10.1007/s11192-018-2838-z
Peters, I., Jobmann, A., Eppelin, A., Hoffmann, C. P., Künne, S., & Wollnik-korn, G. (2014). Altmetrics for large, multidisciplinary research groups: A case study of the Leibniz Association. Libraries in the Digital Age (LIDA) Proceedings, 13.
Wouters, P., Zahedi, Z., & Costas, R. (2018). Metrics for alternative scientific evaluation. In
Handbook of Quantitative Science and Technology Research. Sage Publishing. https://arxiv.org/abs/1806.10541
Zahedi, Z., Fenner, M., & Costas, R. (2014). How consistent are altmetrics providers ? Study of 1000 PLOS ONE publications using the PLOS ALM , Mendeley and Altmetric.com APIs. In altmetrics14: expanding impacts and metrics An ACM Web Science Conference 2014 Altmetrics Workshop, 23-26 June, Indiana University, Indiana, USA. (pp. 5–6). Indiana: Figshare. Retrieved from http://dx.doi.org/10.6084/m9.figshare.1041821
Zahedi, Z., Fenner, M., & Costas, R. (2015). Consistency among altmetrics data
provider/aggregators: what are the challenges? In altmetrics15: 5 years in, what do we know? The 2015 Altmetrics Workshop, Amsterdam Science Park, 9 October 2015 (pp. 5–7). Zahedi, Z. & Costas, R. (2018). General discussion of data quality challenges in social media