Research Article
Maternal factors influencing low birth weight babies
Srinivas Prudhivi*, Revanasiddappa Bhosgi
INTRODUCTION
Low birth weight (LBW) is defined by WHO as the weight of live born infants less than 2,500 g irrespective of their gestation. LBW is closely associated with fetal and perinatal mortality and morbidity. At the population level, the proportion of babies with a LBW is an indicator of a multifaceted public-health problem that includes long-term maternal malnutrition, ill health, hard work and poor health care in pregnancy. At an individual level, LBW is an important predictor of newborn health and survival and is associated with higher risk of infant and childhood mortality.1
Many socio-biological factors have been postulated to determine the birth weight of the newborn. The principal among these are maternal age, weight, height, education, parity, antenatal care, maternal smoking, and sex of the baby.2
In addition, LBW has a higher association with the incidence of infection, malnutrition and handicapping conditions during childhood.3,4
In developing countries, many women are short and underweight and the number of low birth weight (LBW) babies is particularly high (more than 30% in South Asia, 10-20% in other regions.5 LBW infants have less chance
ABSTRACT
Background: This study was conducted to know the maternal and biosocial factors that influence low birth weight babies. Maternal education, occupation, Parity, Malnutrition and anaemia did have a significant impact on birth weight.
Methods: This was a prospective study involving babies born at Dr.PSIMS & RF, Chinaoutapalli conducted over a period of 2.5 years from June 2009 to October 2011. There were a total of 450 babies in this study, of which 150 were low birth weight babies and the rest 300 babies were weighing 2.5 kg or more. To ascertain the maternal factors responsible for low birth weight babies, study of which will enable us to understand the measures involved in reducing the neonatal mortality and morbidity.
Results: In this study, an analysis 150 mothers of LBW babies was done and compared with 300 normal weight babies. The variables were subjected to computer analysis using focus format. The data was analysed using a Chi-Square for quantitative data. Chi square test was used to calculate p value. P value was considered significant if <0.05. SPSS version 16 software is used to do the necessary statistical calculations.
Conclusions: In mothers who had no education & Mothers belonging to lower socioeconomic class had higher chance of delivering low birth weight babies. Parity has a significant relationship with birth weight. There is significant association of PIH and oligohydramnious with birth weight. Maternal malnutrition and anaemia have a significant association with LBW.
Keywords: Low birth weight, Maternal height, weight, Occupation, Malnutrition anaemia Department of Pediatrics, Dr.PSIMS & RF, Chinaoutapalli, Lrishna district Andhra Pradesh
Received: 26 June 2015
Accepted: 21 July 2015
*Correspondence:
Dr. Srinivas Prudhivi,
E-mail: Srinivasprudhivi1981@yahoo.com
Copyright: © the author(s), publisher and licensee Medip Academy. This is an open-access article distributed under the terms of the Creative Commons Attribution Non-Commercial License, which permits unrestricted non-commercial use, distribution, and reproduction in any medium, provided the original work is properly cited.
of survival; when they do survive, they are more prone to disease, growth retardation and impaired mental development. A good start in life is important and maternal nutritional status during pregnancy has repeatedly been demonstrated to be associated with pregnancy outcomes for the infant.6 Keeping all these in views, an attempt has been made to carry out a study on LBW babies at our institution.
METHODS
This was a prospective study involving babies born at Dr.PSIMS & RF, Chinaoutapalli conducted over a period of 2.5 years from June 2009 to October 2011. There were a total of 450 babies in this study, of which 150 were low birth weight babies and the rest 300 babies were weighing 2.5 kg or more.
Inclusion criteria
1. Live birth babies 2. Singleton babies
Exclusion criteria
1. Still births
2. Twin gestation
3. Babies with major congenital anomalies
Method of study
In this study, an analysis 150 mothers of LBW babies was done and compared with 300 normal weight babies. The variables were subjected to computer analysis using focus format. The data was analysed using a Chi-Square for quantitative data. Chi square test was used to calculate p value. P value was considered significant if <0.05. SPSS version 16 software is used to do the necessary statistical calculations.
The first weight of the new born was obtained after birth. The weight was measured preferably within the first hour of life before significant postnatal loss of weight has occurred.
Birth weight measurements were compared to
measurements within 24 hours of birth. Heavy objects like metal forceps, for occluding umbilical cord were omitted. Weight scales were checked at intervals for accuracy.
The details of mothers who had delivered infants within the last 24 hours below 2500 grams were taken from the labour room and postnatal ward. The neonates were weighed naked within 24 hours after birth in a spring-dial baby weighing machine with sensitivity of 20 gms and graded up to 4 1/2 kgs in 20 gram units. Sex of the baby was noted. Any congenital malformation was ruled out.
Sampling mothers
The same procedure used above for locating the infants was also used to trace the mother
1. Age of the mother was taken as recorded in the case sheet and also by questioning the mothers when data entered in the case sheet was not available.
2. Parity of the mother was noted down after
questioning the mother as also the time interval between the previous delivery and birth of the child under study.
3. Weight of the mother was assessed within 24 hours after delivery. A spring balance which has a sensitivity of 50 gms was used for the purpose, after standardization and after allowing an inter and intrapersonal error of 50 gms. The mothers were weighed barefoot after checking the weighing scale for accuracy. If the mothers had any difficulty in walking, the weighing machine was taken next to their beds. The advantage of spring balance was its easy transportability.
4. The height of the mother was usually measured within 24 hours after delivery along with other measurements where this was feasible. It was deferred till the mothers were able to stand erect. 5. Her standard of literacy was grouped into five
categories: Illiterate, primary school, middle school, high school, college education.
6. The total family income and per capita income was assessed by questioning her in detail about the nature of the employment of the earning member in her family, number of earning members, family size and style of living.
7. Religion of the mother was determined by
questioning her, whether she was born into that religion [or got subsequently converted was also enquired into]
8. Maternal diseases during antenatal period were enquired into.
The patients were clinically examined and the basic laboratory investigations were done to determine the following diseases:
1. Tuberculosis
a) Pulmonary
b) Extra pulmonary
2. Heart diseases
a) Hypertension
Blood pressure of 140/90 mm of hg or more on three consequent days (excluding PIH)
b) Chronic rheumatic valvular disease c) Congenital heart disease
3. Anaemia
All the mothers who were anaemic on clinical
examination were evaluated for their
haemoglobin status. A haemoglobin percentage of less than 9gms was considered significant.
4. Toxaemias
Pre-eclampsia manifesting with at 2 of the following:
A. blood pressure of more than 140/90 mm of Hg
B. albuminuria
C. oedema
Eclampsia
Convulsions or coma associated with signs of preeclampsia.
5. Antepartum hemorrhage
Bleeding from the placental site after the 28th week of pregnancy or during the first and second stage of labour.
Accidental hemorrhage
Bleeding due to premature separation of a normally situated placenta.
Inevitable hemorrhage
Due to separation of the placenta, wholly or partially situated in the lower uterine segment (placenta previa).
6. Diabetes mellitus
A. Evidence of glycosuria
B. Fasting blood sugar of more than 140 mg% in cases of glycosuria
7. Renal diseases
Nephritis and nephrosis urinary tract infections.
9. Irrespective whether the cases are booked or unbooked, the following factors are taken into consideration:
A. Maternal age
B. Parity
C. Weight of the mother
The pre-pregnancy weight was not available in all mothers; hence mother weight was recorded immediately after delivery on a weighing machine measured nearest to 100 gms.
Height of the mother
Height was measured on stadiometer nearest to 1 cm
Literacy of the mother and Total family income per month Socio-economic class was categorized from I to V according to the updated Kuppu Swamy’s Socio Economic Scale.
Religion
Maternal diseases during antenatal period like Anaemia, Renal diseases etc.
RESULTS
Maternal age is divided into 3 groups: <20 years, 20-29 years and >30 years. Maternal age does not have any statistical significance in our study as p = 0.11.
Table 1: Incidence of low birth weight babies among mothers of different age groups.
Group Total
Cases Controls
Mother age < 20
4 2.7%
13 4.3%
17 3.8%
20-29 130
86.7%
270 90.00%
400 89.9%
> 30 16
10.7%
17 5.7%
33 7.3%
Total 150
100.0%
300 100.0%
450 100.0%
Figure 1: Incidence of low birth weight babies among mothers of different age groups.
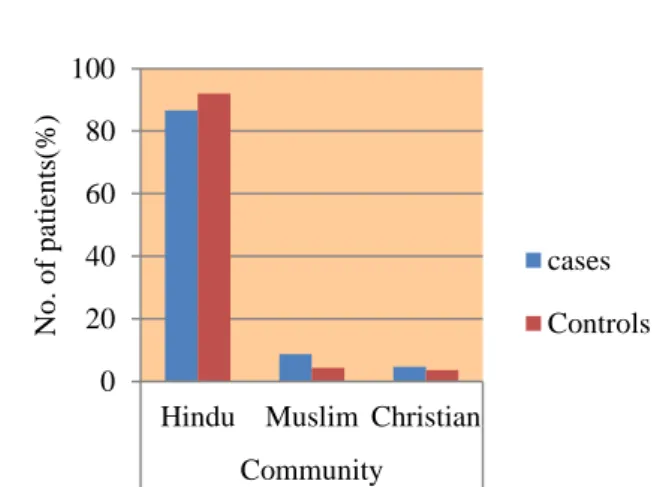
Community is divided into 3 groups: Hindus, Muslims and Christians. In our study, community does not have a significant association in our study as p = 0.148.
0 10 20 30 40 50 60 70 80 90 100
<20 20-29 >30
Mother age
No
.
o
f
pa
tient
s(
%)
cases
Table 2: Incidence of low birth weight babies among mothers of different communities.
Group Total
Cases Controls
Community Hindu
130 86.7%
276 92.0%
406 90.2%
Muslim 13
8.7%
13 4.3%
26 5.8%
Christian 7
4.7%
11 3.7%
18 4.0%
Total 150
100.0%
300 100.0%
450 100.0%
Figure 2: Incidence of low birth weight babies among mothers of different communities.
Table 3: Incidence of low birth weight babies among mothers of different communities.
Group
Total
Cases Controls
Mother Edu. Illeterate
76 50.7%
73 24.3%
149 33.1%
Primary Education 12
8.0%
35 11.7%
47 10.4%
Secondary Education 62
41.3
192 64.0%
254 56.4%
Total 150
100.0% 300 100.0%
450 100.0%
Maternal education ranged from to graduation and was divided into 3 groups- illiteracy, primary education and secondary education. Association of maternal education and birth weight is statistically significant. Among the mothers who were having low birth weight babies, 50.7 % had no education; when compared to mothers who gave birth to normal babies (only 24.3% had no education in control group). Thus, p value is highly significant.
Maternaloccupation is divided into 3 groups: housewife, labour and others. About 12.7% of mothers who had LBW babies were labourers when compared to the
mothers of babies with normal birth weight (control group) where it is 0.7%. Thus, there is association of occupation and birth weight with p value highly significant in the labour group.
Figure 3: Incidence of low birth weight babies among mothers of different communities.
Table 4: Incidence of low birth weight babies among mothers of varried occupations.
Group
Total
Cases Controls
Occupation House wife
127 84.7%
270 90.0%
397 88.2%
Labor 19
12.7% 2 7%
21 4.7%
Others 4
2.7%
28 9.3%
32 7.1%
Total 150
100.0%
300 100.0%
450 100.0%
Figure 4: Incidence of low birth weight babies among mothers of varried occupations.
0 20 40 60 80 100
Hindu Muslim Christian
Community
No
.
o
f
p
atien
ts
(%)
cases
Controls
0 10 20 30 40 50 60 70
illiterate secondary
education
Mother Edu
No
.
o
f
p
atien
ts
(%)
cases
Controls
0 10 20 30 40 50 60 70 80 90 100
house wife
labour others.
Occupation (mother/father)
No
.
o
f
p
atien
ts
(%)
Table 5: Incidence of low birth weight babies among mothers of varried socio-economic classes.
Group
Total
Cases Controls
Socioeconomic I
2 1.3%
13 4.3%
15 3.3%
II 13
8.7%
104 34.7%
117 26.0%
III 82
54.7%
169 56.3%
251 55.8%
IV 41
27.3% 13 4.3%
51 12.0%
V 12
8.0% 1 3%
13 2.9%
Total 150
100.0% 300 100.0%
450 100.0%
Figure 5: Incidence of low birth weight babies among mothers of varried socio-economic classes.
Socioeconomic class is divided into 5 classes according to Kuppuswamy classification: I,II,III,IV,V. 54.7% of mothers who had LBW baby belonged to class III. There is a higher statistical significance between birth weight and socioeconomic class.
Table 6: Incidence of low birth weight babies among mothers undergoing normal vaginal delivery vs C
section.
Group
Total
Cases Controls
Delivery Mode normal vaginal
delivery
89 59.3%
226 75.3%
315 70.0%
Cesearean section 61
4.07% 74 24.7%
135 30.0%
Total 150
100.0% 300 100.0%
450 100.0%
Deliveries were divided into 2 groups: esarean section
(elective and emergency)and normal vaginal
delivery(episiotomy and forceps delivery). Among the
mothers who delivered LBW baby, 59.3 % were delivered by normal vaginal delivery. p value is found to be significant.
Figure 6: Incidence of low birth weight babies among mothers undergoing normal vaginal delivery vs C
section.
Table 7: Incidence of low birth weight babies among mothers with different weights.
Group
Total
Cases Controls
Mother Wt <50kg
89 59.3%
40 13.3%
129 28.7%
51-60 kg 56
37.3%
241 80.3%
297 66.0%
>60 Kg 5
3.3%
19 6.3%
24 5.3%
Total 150
100.0% 300 100.0%
450 100.0%
There is a higher statistical signifance when the maternal weight is compared to birth weight ( p<0.001). In the mothers having weight < 50 kg, low birth weight incidence is 59.3%, while the incidence in those weighing > 50 kg is 40.6%.
Maternal height is divided into 3 groups: <145 cm, 145-154 cm and 155-164cm. Among the mothers who delivered low birth weight babies, 91.4 % had short stature (height < 145cm). p value <0.001, thus the association of maternal height and birth weight is of statistical significance.
Parity ranged from 1 to 5 and is divided into 3 groups: Primi, Multi and Grand multi (G4 or more). In our study, parity has statistically significant association with regards to birth weight of baby. In our study, 42% of the mothers who delivered babies with birth weight < 2500 gms are multiparous when compared with control group. P value<0.010 and thus of statistical significance.
0 10 20 30 40 50 60
I II III IV V
Socioeconomic class
No
.
o
f
p
atien
ts
(%)
cases
Controls
0% 10% 20% 30% 40% 50% 60% 70% 80%
nvd lscs
mode of delivery
No
.
o
f
pa
tient
s(
%)
Figure 7: Incidence of low birth weight babies among mothers with different weights.
Table 8: Incidence of low birth weight babies among mothers with different heights.
Group
Total
Cases Controls
Mother Ht <145 cm 67 44.7 18 6.0% 85 18.9%
145-154 cm 70
46.7% 121 40.3%
191 42.4%
155-164 cm 13
8.7%
161 53.7%
174 38.7%
Total 150
100.0% 300 100.0%
450 100.0%
Figure 8: Incidence of low birth weight babies among mothers with different heights.
Table 9: Incidence of low birth weight babies among mothers primi vs multi & grand multi.
Group
Total
Cases Controls
Parity Primi 76 50.7% 163 54.3% 239 53.1%
Multi 63
42.0% 91 30.3%
154 34.2%
Grand multi 11
7.3% 46 15.3%
57 12.7%
Total 150
100.0% 300 100.0%
450 100.0%
Figure 9: Incidence of low birth weight babies among mothers primi vs multi & grand multi.
Table 10: Incidence of low birth weight babies among mothers with varied maternal risk factors.
Group
Total
Cases Controls
Maternalriskfactors None 54 36.0% 243 81.0% 297 66.0%
PIH 21
14.0% 10 3.3%
31 6.9%
Oligohydramniou 38
25.3% 7 2.3%
45 10.0%
APH 9
6.0% 19 6.3%
28 6.2%
PROM 1
7%
16 5.3%
17 3.8%
GDM 11
7.3% 5 1.7%
16 3.6%
UTI 13
8.7% 0 0%
13 2.9%
Heart disease 3
2.0% 0 .0%
. .7%
Total 150
100.0% 300 100.0% 450 100.0% 0 10 20 30 40 50 60 70 80 90
<50 kg 51-60 kg > 60 kg
Mother Wt No . o f pa tient s( %) cases Controls 0 10 20 30 40 50 60
<145 cm 145-154 cm 155-164 cm
Mother Ht No . o f pa tient s( %) cases Controls 0 10 20 30 40 50 60
Primi Multi Grand
There is a significant association between maternal risk factors like Oligohydramnious, PIH (pregnancy induced hypertension), and birth weight. Among the mothers who
have delivered LBW babies, about 25% had
oligohydramnious, 14% had PIH (Pregnancy induced hypertension). p value is significant especially with the group having oligohydramnious. The incidence of GDM (Gestational Diabetes Mellitus) and UTI (Urinary tract infections) are comparatively on the higher side in the study group.
Figure 10: Incidence of low birth weight babies among mothers with varied maternal risk factors.
Table 11: Incidence of low birth weight babies in relation to sex of baby.
Group
Total
Cases Controls
Baby Sex Male 75 50.0% 172 57.3% 247 54.9%
Female 75
50.0% 128 42.7%
203 45.1%
Total 150
100.0% 300 100.0%
450 100.0%
Figure 11: Incidence of low birth weight babies in relation to sex of baby.
About 50% of the low birth weight babies born were male. p = 0.141, thus there is no significant association between sex of baby and birth weight.
Table 12: Incidence of low birth weight babies in relation to maternal nutritional status.
Group
Total
Cases Controls
Maternal Nutrition adequate 42 28.0% 233 77.7% 275 61.1%
Inadequate 108
72.0% 67 22.3%
175 38.9%
Total 150
100.0% 300 100.0% 450 100.0%
Figure 12: Incidence of low birth weight babies in relation to maternal nutritional status.
In our study, mothers who had inadequate diet had higher incidence of LBW babies (72%) when compared with to controls. Thus there is a strong statistical significance in the association of maternal malnutrition with low birth weight.
Table 13: Incidence of low birth weight babies in relation to maternal haemoglobin levels.
Group
Total
Cases Controls
Mat Hb <10 gm% 49 32.7% 57 19.0% 106 23.6%
10-11 gm% 50
33.3% 190 63.3%
240 53.3%
>11 gm % 51
34.0% 53 17.7%
104 23.1%
Total 150
100.0% 300 100.0%
450 100.0%
Maternal Hb% ranged from 6.5% to 13.5% and is classified into 3 groups: 10gm%, 10-11gm%, >11gm%. In our study, 32.7% of the mothers who delivered babies with birth weight < 2500 gms had Hb% < 10 gm% when compared to control group (19%), thus p value is significant in the group having Hb% < 10gm%.
Figure 13: Incidence of low birth weight babies in relation to maternal haemoglobin levels.
DISCUSSION
This study was undertaken to study the influence of maternal factors in low birth weight babies.
Maternal age
Mothers are divided into 3 groups: <20 years, 20-29 years and >30 years. Maternal age does not have any statistical significance in our study as p = 0.118. This is similar to the study done by K.S. Negi, but contrary to the earlier studies done by Parlington and Tabcharoen, where maternal age <20 years has higher incidence of low birth weight.7-9 Among the mothers who delivered babies with birth weight > 2500 gms, majority (90%) belonged to the age group of 20-29 years, which is similar to the findings observed by N.S. Nair et al.10
Community
Community is divided into 3 groups: Hindus, Muslims and Christians. In our study, community does not have a significant association in our study as p = 0.148. This is similar to the study done by N.S. Nair et al.10
Maternal education:
Maternal education ranged from illiteracy to graduation and was divided into 3 groups- illiteracy, primary education and secondary education. Association of maternal education and birth weight is statistically significant. Among the mothers who were having low birth weight babies, 50.7% had no education. p value is highly significant. This is similar to the study done by Selina Khatun11 and SarojParchiary.12
Maternal occupation
Maternal occupation is divided into 3 groups: housewife, labour and others. About 12.7% of mothers who had LBW babies were labourers when compared to the mothers of babies with normal birth weight (control group) where it is 0.7%.Thus, there is association of
occupation and birth weight with p value highly significant in the labour group.
This is similar to the results of Selina Khatun and Saroj Parchiary.11,12
Socioeconomic class
Socioeconomic class is divided into 5 classes according to Kuppuswamy classification: I (upper), II (upper middle), III (lower middle), IV (lower middle), V (lower). 54.7% of mothers who had LBW baby belonged to class III. There is a higher statistical significance between birth weight and socioeconomic class. This is similar to the studies done by N.S Nair, James Donnelly, Saroj Parchiary and Shanti Ghosh.4,12-14
Mode of delivery
Deliveries were divided into 2 groups: cesarean section (elective and emergency)and normal vaginal delivery (episiotomy and forceps delivery). Among the mothers who delivered LBW baby, 59.3 % were delivered by normal vaginal delivery. p value is found to be significant.
Maternal weight
There is a higher statistical signifance when the maternal weight is compared to birth weight (p<0.001). In the mothers having weight < 50 kg, low birth weight incidence is 59.3%, while the incidence in those weighing > 50 kg is 40.6%. This is similar to the studies done by E J Love, James Donnelly, Niyogi and Shanti Ghosh.13-16
Maternal height
Maternal height is divided into 3 groups: <145 cm, 145-154 cm and 155-164 cms. Among the mothers who delivered low birth weight babies, 91.4 % had short stature (height < 145cm). p value <0.001, thus the association of maternal height and birth weight is of higher statistical significance. This is similar to the studies done by S. Ganesh kumar.17
Parity
Parity ranged from 1 to 5 and is divided into 3 groups: Primi, Multi and Grand multi (G4 or more). In our study, parity has statistically significant association with regards to birth weight of baby. In our study, parity has statistically significant association with regards to birth weight of baby. In our study, 42% of the mothers who delivered babies with birth weight < 2500 gms are multiparous when compared with control group. P value<0.010 and thus of statistical significance. This is similar to the studies done by S. Mukherji, Mohsin, Datta Banikand Khin Nyuntaccording to whom birth weight increases with parity.18-21 Studies done by Khetua and Bachani23 also showed similar results.22
0 10 20 30 40 50 60 70
<10 gm% 10- 11 gm%
3 - >11 gm%
Mat Hb
No
.
o
f
p
atien
ts
(%)
cases
Maternal risk factors
There is a significant association between maternal risk factors like Oligohydramnious, PIH (pregnancy induced hypertension), and birth weight. Among the mothers who
have delivered LBW babies, about 25% had
oligohydramnious, 14% had PIH. p value is significant especially with the group having oligohydramnious. The incidence of APH (antepartum hemorrhage) and PROM (premature rupture of membranes) is comparatively on the higher side among the controls. Studies done by AMMark Anez Conteras and LR Rahman also showed that PIH is a risk factor for LBW.24,25
Sex of the baby
About 50% of the low birth weight babies born were male. p = 0.141, thus there is no significant association between sex of baby and birth weight. Similar results were obtained from the studies done by B Mondal.26
Maternal Nutrition
In our study, mothers who had inadequate diet had higher incidence of LBW babies (72%) when compared with to controls. Thus there is a strong statistical significance in the association of maternal malnutrition with low birth
weight. Similar results were obtained by A
Dharmalingam.27
Maternal hemoglobin
Maternal Hb% ranged from 6.5% to 13.5% and is classified into 3 groups: 10gm%, 10-11gm%, >11gm%. In our study, 32.7% of the mothers who delivered babies with birth weight < 2500 gms had Hb% < 10 gm%, thus p value is significant in the group having Hb% < 10 gm%. S Pachauri, SM Marevah, Khetua and Shanti Ghosh also mentioned that anaemia is a risk factor for LBW.14,22,28
CONCLUSION
This study was conducted to know the maternal and bio-social factors that influence low birth weight babies. There was no significant association with maternal age and religion (community) with birth weight in our study. There was higher incidence of low birth weight babies among illiterate mothers. Mothers belonging to lower socioeconomic status had higher chance of delivering low birth weight babies. Parity has a significant relationship with birth weight with higher birth weight among women with higher parity. There is significant association of PIH and oligohydramnious with birth weight. There is no significant association of LBW with sex of the baby. Maternal malnutrition and anaemia have a significant association with LBW with higher incidence of Low birth weight among malnourished and anaemic mothers.
Funding: No funding sources Conflict of interest: None declared
Ethical approval: The study was approved by the Institutional Ethics Committee
REFERENCES
1. Stevens-Simon C, Orleans M. Low-birthweight
prevention programs: The enigma of failure. Birth. 1999;26(3):184-91.
2. Makhija K, et al. Sociobiological determinants of birth weights- Indian Journal of Pediatrics 1989;56:639-43.
3. Berkowitz GS, Papiermik E. Epidemiology of
premature birth. Epidemiology reviews. 1993;15:414-43.
4. Dunin – Waswicz D, Rowecka-Trazebickak. Risk
factors for cerebral palsy in very-low birth weight infants. J child neurol. 2000;15:417-20.
5. Dharmalingam A. Nutritional status of mothers and
low birth weight in India. Maternal and child health Journal. 2010;14(2):290-8.
6. Kramer MS. Determinants of Low Birth Weight
Methodological Assessment and Meta-Analysis. Bulletin of the World Health Organization. 1987;65(5):663-737.
7. Negi KS, Kandapal SD, Kukreti M.
Epidemiological factors affecting low birth weight. 2006;8(1).
8. Parlington SN. Second births to teenage mothers: risk factors for low birth weight and preterm birth. Perspect Sex Reprod Health. 2009;41(2):101-9.
9. C Tabcharoen Pregnancy outcome after age 40 and risk of low birth weight. Journal of Obstetrics and Gynaecology - 01-JUL-2009; 29(5): 378-83
10. N S Nair; V Nair; M Thankam - A study of birth weights of term infants at Calicut. Journal of Obstetrics and Gynaecology of India 1963, 13:488
11. Selina Khatun and Mahmudur Rahman,
socio-economic determinants of low birth weight in Bangladesh, Bangladesh Med Res Counc Bull 2008;34:81-86
12. Pachauri S; Marwah SM. A multifactorial approach
to the study of the factors influencing the birth weight in urban community of Delhi. Indian Journal of Medical Research. 1971;59:1318
13. Donelly J. Maternal,Fetal and Enviromental factors in prematurity- American Journal of Pediatrics and Gynaecology. 1964;88:918
14. Ghosh S, Attooja V, Mittal SK, Verma RK.
Biosocial determinate of birth weight. Indian Pediatrics. 1977;14:107
15. Love EJ, Kinch H. Factors influencing the birth weight in normal pregnancy. American Journal of Obstetrics and Gynaecology. 1965;91:342-9.
16. Niyogi AK, Gajwani BW. The influence of maternal
17. Ganesh Kumar S, Harsha Kumar HN, Jayaram S, Kotian MS. Determinants of low birth weight : A case control study in a district hospital in
Karnataka. Indian Journal of Pediatrics.
2010;77(1);87-9.
18. Mukherjee S, Biswas S. Birth Weight and its relationship to gestation period, sex, Maternal age, Parity and Socio economic status. Indian Journal of Pediatrics. 1970;37:460
19. Mohsin M. Maternal and neonatal factors
influencing premature birth and low birth weight in Australia. J Biosoc Sci - 01-APR-2003; 35(2) 161-7428.
20. Dattabanik ND. A study of different birth weight babies and related factors. Indian Pediatrics 1978;16:327
21. Khin Nyunth, Mary Karen. Assessment of fetal growth from Birth weight. Data at Central Women’s Hospital, Burma Medical Journal. 1981, 27 (4) 36.
22. Khetua SP, Manarha BK, Chatterjee S, Roy PK. Polodhi. Indian Pediatrics 1970;7:65
23. Bachani D, Agarwal DK, Sharma S, Mathew HN. Obstet Gynaec. Ind. 1985,35:52
24. MartÃnez AM. Contreras Preeclampsia: Main
maternal risk factor for low weight in preterm newborn. Ginecol Obstet Mex. 2008;76(7):398-403.
25. Rahman LA. Association between pregnancy
induced hypertension and low birthweight; a population based case-control study. Asia Pacific Journal of Public Health. 2008;20(2):152-8. 26. Mondal B. Risk factor for low birth weight in
Nepali infants. Indian Journal of Pediatrics. 2000;67(7).
27. Dharmalingam A. Nutritional status of mothers and low birth weight in India. - Maternal and child health Journal. 2010;14(2):290-8.
28. Pachauri S, Marwah SM. A multifactorial approach
to the study of the factors influencing the birth weight in urban community of Delhi-Indian Journal of Medical Research 1971;59:1318.