doi: 10.11648/j.ajche.20140206.11
ISSN: 2330-8605 (Print); ISSN: 2330-8613 (Online)
Predicting reactants’ hydrodynamic behavior inside
non-porous catalytic reactors
Ihab Shigidi
1, 21
Department of Chemical Engineering, King Khalid University, P. O. Box 9036, Abha 61413, Saudi Arabia
2
Department of Chemical Engineering, Al-Neelain University, P. O. Box 10179, Khartoum, Sudan
Email address:
[email protected]To cite this article:
Ihab Shigidi. Predicting Reactants’ Hydrodynamic Behavior Inside Non-Porous Catalytic Reactors. American Journal of Chemical
Engineering. Vol. 2, No. 6, 2014, pp. 71-75. doi: 10.11648/j.ajche.20140206.11
Abstract:
Gaseous reactants usually have complex behaviors ranging from unsteady flow patterns to oscillations due to the differences in various physical and chemical properties. Such behaviors hinder the complete understanding coupled between transport processes and chemical kinetics. Systems within which chemical reactions are coupled with diffusion and convective transport have chemical engineering applications. The aim of the present work is to simulate the steady state behavior of a reaction-diffusion-convection system using the finite element method for ammonia decomposition. The overall model used consists of the flow and mass transport modules which are described by the continuity, Stokes equations and the convective dispersion equation respectively. Concentration profile, velocity and pressure fields presented are for a first order reaction for ammonia decomposition inside tubular non-porous catalytic reactors. Two different types of reactors are considered, the first one represents a fuel cell and the second is for a catalytic wall reactor.Keywords:
Ammonia Decomposition, Catalytic Reactor, Finite Element Modelling, Convection Transport, Penalty Scheme, Diffusion1. Introduction
Ammonia decomposition is an important reaction in Biomass gasification [1], which is a very attractive source of power generation that reduces reliance on fossil fuel. Ammonia is also known as one of the main contaminants in this process because it forms fuel-nitrogen bonds that can be converted to different forms of nitrogen oxides (NOx) during combustion resulting in an environmental pollution. Ammonia decomposition was also investigated as a method for producing hydrogen for fuel cell applications [2] because the conventional processes such as steam reforming, auto-thermal reforming and partial oxidation yield large amounts of undesirable COx as by products.
Different types of catalysts are employed to support the high activation energy required for thermal decomposition. [3] stated the first order reaction as follows:
) ( 2 ) ( 2 ) (
3 3
2NHg →Ng+ Hg (1)
The scope of the present work is to simulate the ammonia decomposition process inside a catalytic reactor under
isothermal steady state conditions. Accurate simulation of this process in a catalytic tubular reactor will allow industrial chemical engineers to optimise plant operation, while ensuring a safe working environment.
Two types of reactors were employed in this work presenting various scenarios for catalytic ammonia decomposition; Fuel Cell reactor with centrally located non porous catalysis and a wall reactor with catalytically active walls.
The finite element method was chosen because of its ability to cope with complex geometrical domains and boundary conditions. Two different generated domains representing two different types of catalytic reactors; a wall reactor and a fuel cell are used in the analysis.
2. Mathematical Modeling
2.1. Conservation of Momentum
72 Ihab Shigidi: Predicting Reactants’ Hydrodynamic Behavior Inside Non-Porous Catalytic Reactors ∂ ∂ + ∂ ∂ ∂ ∂ + ∂ ∂ ∂ ∂ + ∂ ∂ − = ∂ ∂ y v x v y x v x x p t
vx η x η y x
ρ 2 (2)
∂ ∂ + ∂ ∂ ∂ ∂ + ∂ ∂ ∂ ∂ + ∂ ∂ − = ∂ ∂ y v x v x y v y y p t
vy
η
yη
y xρ
2 (3)where ρ is the density and due to the complexity of predicting density changes in response to pressure difference, incompressibility is assumed in this model, vx, vy are the
velocity components in the x and y directions respectively and
η is the viscosity, p is the pressure.
2.2. Conservation of Mass
Conservation of mass for the flow of ammonia in the reactor can be given by the continuity equation.
0 = ∂ ∂ + ∂ ∂ y v x
vx y (4)
where vx, vy are the velocity components in the x and y
directions respectively.
2.3. Mass Transport Equation
Mass transport in the presented case can be expressed by the Convective Diffusion Equation in the formula:
kc y c D y x c D x y c v x c v t c y x y x + ∂ ∂ ∂ ∂ + ∂ ∂ ∂ ∂ = ∂ ∂ + ∂ ∂ + ∂
∂ (5)
where C is the concentration of ammonia and Dx and Dy are
the dispersion coefficients in the x and y directions respectively and the last term kC represent the decomposition of ammonia in a first order reaction term. The values of the dispersion coefficients are assumed to be constant because the process is occurring under constant temperature.
The convective dispersion equation falls into the class of hyperbolic partial differential equations. It is primarily dominated by the convection terms which result in a high Peclet number [4,5,6] and to obtain a stable and accurate results; upwinding techniques have to be employed [7,8].
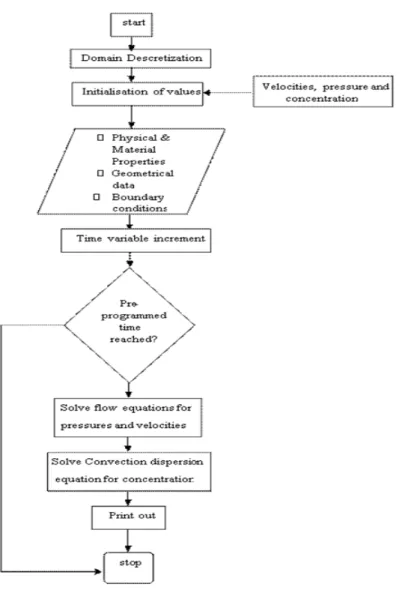
3. Program Algorithm
4. Results and Discussions
4.1. Fuel Cell Reactor
The first domain that represents the fuel cell consists of a rectangular reactor with a spherical catalytic surface located at the centre of the domain where the reaction takes place on the nodes forming the surface of the catalyst.
The boundary conditions for this domain
Fig. (4). No slip wall conditions were employed on the side wall, whilst a gas flow rate of 0.01 m/s is assumed at the inlet. The concentration of ammonia in the feed stream is 0.05 kg/m3.
The properties of the reactants used in this study are presented in Table (1):
Table (1). Properties of the reactants used in the study
Inlet velocity 1 cm/sec
Viscosity 55.12×10
Diffusion coefficient 0.5168 cm2/s
Turnover Frequency 0.89 molecule/site sec
Number of nodes per element 9
Fig 2. Boundary conditions for fuel cell
Fig 3. Velocity profile inside the fuel cell reactor
Fig 4. Pressure drop inside the fuel cell reactor
The velocity profile achieved for the ammonia demonstrated in Fig. (3), form the vectors it appears that the plug flow introduced at the reactor’s inlet develops into a parabolic profile due to the laminar flow condition imposed on the system. Because of the presence of the catalytic surface located at the centre of the domain, maximum velocity develops around the catalyst since that is the only region for The first domain that represents the fuel cell consists of a rectangular reactor with a spherical catalytic surface located at the centre of the domain where the reaction takes place on the
for this domain are presented in employed on the side assumed at the inlet. The concentration of ammonia in the feed stream is 0.05
The properties of the reactants used in this study are
Properties of the reactants used in the study
1 cm/sec
10-6 Ns/m2 0.5168 cm2/s
molecule/site sec
ell reactor
Velocity profile inside the fuel cell reactor
inside the fuel cell reactor.
The velocity profile achieved for the ammonia is ), form the vectors it appears that the plug flow introduced at the reactor’s inlet develops into a parabolic profile due to the laminar flow condition imposed on the system. Because of the presence of the catalytic surface d at the centre of the domain, maximum velocity develops around the catalyst since that is the only region for
the fluid to pass through. Material balance was calculated at both the inlet and the outlet of the reactor to ensure that continuity is maintained throughout the reactor.
The pressure drop inside the reactor is presented in Fig. ( From the plots is was found that the materials are behaving as expected and that the decrease of the pressure along the reactor is in agreement with the flow profile of ammonia presented in Fig. (3).
The next approach was to examine the concentration profi for ammonia inside the reactor under the same conditions.
Fig. (5) shows that the concentration of ammonia is constant at the entrance of the reactor. The reaction occurs only on the nodes forming the active surface inside the reactor. Maximum conversion was found to occur on the front nodes to the flow and the conical shape formed after the catalyst was justified by the presence of a vortex of eddies afterwards which is in agreement with the velocity profile obtained [8,9].
Fig 5. Concentration profile
4.2. Catalytic Wall Reactor
The second domain represents the
where a specific location of the wall is coated with catalyst This is where the reaction occurs is presented in
Fig 6. Boundary conditions for
Fig 7. Velocity profile inside
the fluid to pass through. Material balance was calculated at both the inlet and the outlet of the reactor to ensure that
d throughout the reactor.
The pressure drop inside the reactor is presented in Fig. (4). From the plots is was found that the materials are behaving as expected and that the decrease of the pressure along the reactor is in agreement with the flow profile of ammonia
The next approach was to examine the concentration profile for ammonia inside the reactor under the same conditions.
Fig. (5) shows that the concentration of ammonia is constant at the entrance of the reactor. The reaction occurs only on the nodes forming the active surface inside the reactor. n was found to occur on the front nodes to the flow and the conical shape formed after the catalyst was justified by the presence of a vortex of eddies afterwards which is in agreement with the velocity profile obtained [8,9].
e inside the fuel cell reactor
The second domain represents the catalytic wall reactor where a specific location of the wall is coated with catalyst.
where the reaction occurs is presented in Fig. (6).
Boundary conditions for catalytic wall reactor
74 Ihab Shigidi: Predicting Reactants’ Hydrodynamic Behavior Inside Non-Porous Catalytic Reactors
Fig. (7) presents the velocity profile for ammonia flow inside the catalytic wall reactor. It is clear that the materials develop a parabolic profile for the plug flow introduced at the domains’ inlet due to the low Reynolds number of the reactants.
The pressure profile inside the wall reactor is presented in Fig.(8) and it also agrees with the velocity profile. The gradual decrease in the pressure can clearly be demonstrated as follows.
The maximum conversion occurs on the nodes of the active surface and the increase of concentration afterwards was justified by the back diffusion of the reactants. The minimum conversion occurs at the centre of the domain. The effect of the parabolic velocity profile can also be noticed at the centre of the reactor.
Fig 8. Pressure drop inside catalytic wall reactor
The concentration profile for the case on hand is presented in Fig.(9).
Fig 9. Concentration Profile inside catalytic wall reactor
5. Conclusions
The hydrodynamic behavior of ammonia inside two different catalytic reactors was simulated. Firstly, the flow inside each reactor was modelled and was found to develop a parabolic profile due to the laminar flow of the reactants which is presented by the low value of Reynolds number in addition to the imposition of a non-slip boundary conditions.
As for the pressure, a drop was observed along the tested domains indicating that the ammonia is flowing in the expected direction as supported by the velocity vector plots.
The concentration profile was considered as well by adding a first order reaction rate to the convective dispersion working equations. It was found that the conversion of ammonia occurs around the active surface of each domain.
The concentration profile for the catalytic wall reactor was then plotted. It was found that the concentration remains constant at the inlet of the reactor and that the minimum conversion was achieved on the nodes forming the active surface and due to the back diffusion of the un-reacted materials the concentration increases at the outlet of the reactor.
Acknowledgements
The author wishes to acknowledge Prof.V. Nassehi and Dr. K. Hellgardt for their guidance on this work.
References
[1] WANG, W., PADBAN, N., YE, Z., ANDERSSON, A. & BJERLE, I. 1999. Kinetics of ammonia decomposition in hot gas cleaning. Industrial & engineering chemistry research, 38, 4175-4182.
[2] CHELLAPPA, A., FISCHER, C. & THOMSON, W. 2002. Ammonia decomposition kinetics over Ni-Pt/Al for PEM fuel cell applications. Applied Catalysis A: General, 227, 231-240.
[3] T.V. CHOUDHARY, SIVADINARAYANA, C. & GOODMAN, A. D. W. 2001. Catalytic ammonia decomposition: COx-free hydrogen production for fuel cell applications. Catalysis
Letters, 72, 197-201.
[4] NASSEHI, V. 2002. Practical aspects of finite element modelling of polymer processing, Wiley Chichester.
[5] REDDY, J. N. & GARTLING, D. K. 2010. The finite element method in heat transfer and fluid dynamics, CRC press.
[6] ZIENKIEWICZ, O. C. & TAYLOR, R. L. 2000. The finite
element method: Solid mechanics, Butterworth-heinemann.
[7] KOU, J. & SUN, S. 2014. Upwind discontinuous Galerkin methods with mass conservation of both phases for incompressible two‐phase flow in porous media. Numerical
Methods for Partial Differential Equations.
[8] WAGHODE, A., HANSPAL, N., SHIGIDI, I., NASSEHI, V. & HELLGARDT, K. 2005. Computer modelling and numerical analysis of hydrodynamics and heat transfer in non-porous catalytic reactor for the decomposition of ammonia. Chemical