1Postdoctoral Research Fellow at International Islamic University Malaysia. Email: [email protected]
56
VOLUME 18 ISSUE 1
(2020), Page 56
–
65
PERSONALITY AND LIFESTYLE INTERPRETS EXTERNAL
CONDITION TO ENVIRONMENTAL BEHAVIOURS
Aisyah Abu Bakar
1, Mariana Mohamed Osman
2& Mizan Hitam
31,2
Kulliyyah of Architecture and Environmental Design
INTERNATIONAL ISLAMIC UNIVERSITY MALAYSIA
3
Faculty of Architecture, Panning and Surveying
UNIVERSITI TEKNOLOGI MARA
Abstract
Personality and lifestyles frame individuals’ interpretation of situational
information; as such, the encouragement, convenience and reinforcement to
behave more environmentally. Issue: Existing research lack empirical evidence
on the influence of personality and lifestyle (PL) on external condition (EC) to
environmental behaviours. Purpose: This paper aims to verify the statistical
predictability of EC based on PL. Approach: Multiple Correlation and Multiple
Linear Regression were carried out to assess linear associations and parameters
of linear equations to predict EC components based on PL items. Findings: EC
componen
ts were predictable by some of the PL items. In particular, ‘urging
media to raise environmental awareness’ was the strongest predictor of EC.
Journal of the Malaysia Institute of Planners (2020)
57
© 2020 by MIP
INTRODUCTION
Human interdependence with the environment (HIE) entails (i) the ability to
contribute, and (ii) the willingness to be responsive, and (iii) the enthusiasm to
be more engaged with one’s context for meaningful and sustainable well
-being.
Personality and lifestyle (PL) and external condition (EC) are two interrelated
HIE dimensions that significantly contribute to subjective sustainable well-being
(SSWB) (Abu Bakar et al., 2017a, 2017b, 2017c, 2018). Personal environmental
values stem from collectivist beliefs and biospheric ideals that forms PL serve as
guidelines in individuals
’ life and
influence the way individuals evaluate the EC
of environmental behaviours. Few studies to date have empirically examined how
personal values relate to situation perception. This paper assesses the statistical
predictability of EC based on PL.
LITERATURE REVIEW
Case studies based on articles from selected Asian Journals from the year 2011
onwards highlight conditional factors and potential determinants of Interaction
with Nature (EC). Table 1 summarizes these findings.
Table 1
Conditional Factors and Potential Determinants for External Condition
Conditional Factors Potential Determinants References Sense of urgency pressure, concern, awareness and
behavioural change on solid waste management.
Regulation enforcement, and
limited resources (Lim, 2011)
Environmental, ethical commitment (dedication to
moral principles in relation to the environment). Regulation aspects, financial aspects, Zaman, 2012) (Delima &
Re-arrangements of furniture, environmental
appreciation, adjustment to living conditions.
Favourable living area and stress-free environment
(Sahari et al., 2012)
Hazardous exposure from construction and
development (fumes and dust as well unregulated building materials such as asbestos, lead and solvents)
proper construction regulation process and procedures, and legal enforcement
(Isnin et al., 2012)
Increase of income per capita and increase of
population density (population per unit area). Pollution, conducive outdoors, health and quality of life (Borhan et al., 2013) Adaptation and adjustment of the citizens to the local
tropical weather.
Outdoor condition (climate, temperature and humidity)
(Nasir et al., 2013) Safety, public services, safe surroundings, greenery
and quietness, social interaction and proximity.
Access, proximity and
neighbourhood quality
(Lamit et al., 2013)
Influences by environmental concern and
environmental campaign programmes. Support neighbours, and colleague from family, (Rezai et al., 2015)
Public satisfaction and improvements of the public transportation, network and facilities.
facilities, services, comfort and vehicle design
(Hafezi et al., 2013) Location of living spaces and monthly income or
allowance influenced energy-conservative attitudes.
Convenience to facilities and products
(Singhirunnusorn et al., 2011) Prompts, commitment, normative influence, goal
setting, barriers, rewards, and feedback Situational factor (perception of difficulty to performance) (Latif et al., 2013)
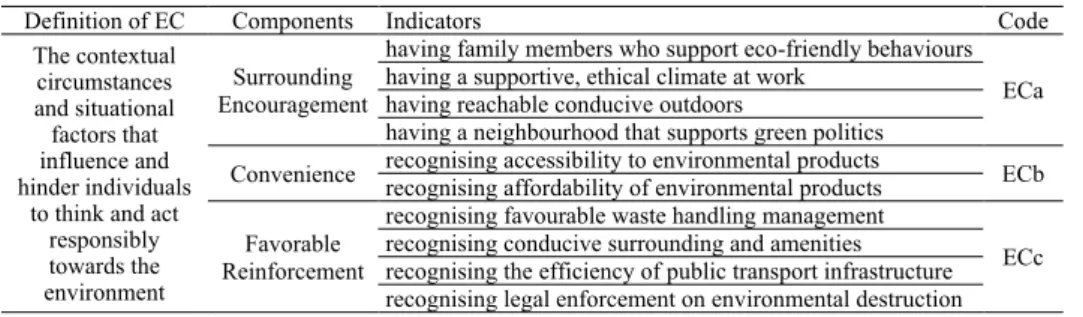
The findings from the case studies generate three significant
components of EC: (i) Surrounding Encouragement (ECa), (ii) Convenience
(ECb) and (iii) Favourable Enforcement (ECc).
© 2020 by MIP
58
Definition of EC Components Indicators Code
The contextual circumstances and situational factors that influence and hinder individuals
to think and act responsibly towards the environment
Surrounding Encouragement
having family members who support eco-friendly behaviours ECa having a supportive, ethical climate at work
having reachable conducive outdoors
having a neighbourhood that supports green politics
Convenience recognising accessibility to environmental products recognising affordability of environmental products ECb
Favorable Reinforcement
recognising favourable waste handling management
ECc recognising conducive surrounding and amenities
recognising the efficiency of public transport infrastructure recognising legal enforcement on environmental destruction
Personal Lifestyle (PL) manifests in the personal outlook and approach
to life in relation to environmental consciousness (Abu Bakar et al., 2017a,
2017b, 2017c, 2018). Qualities adhere to PL include (i) moral stance in
collectivistic values (Clark et al., 2014; Caesar, 2016), (ii) commitment to modest
and environmental choices (Horayangkura, 2012; Khare, 2015; Ming et al.,
2015), and (iii) environmental concerns through knowledge and awareness
(Horayangkura, 2012; Masud et al., 2013; Ming et al., 2015).
Table 3
Determinants of Personal Lifestyle
Definition of PL Indicators Code
The personal orientation that portrays collectivistic worldviews,
modesty and humility towards others as well as consciousness of
environmental issues
favouring relationships with others over personal success PL1
choosing to disappointing self over disappointing family PL2
taking account others' opinions in making life decisions PL3
taking the pleasure of working with others PL4
practising moderation in purchasing and using resources PL5
feeling unconcerned if not being able to afford things PL6
believing that having many assets does not lead to happiness PL7
being mindful about environmental destruction PL8
feeling affected by the environmental loss of other countries PL9
urging media to raise environmental awareness PL10
Based on theoretical underpinnings, the research hypothesize that EC
components are predictable by PL. The following sections provide empirical
evidence on the predictability of ECa, ECb and ECc based on PL items.
METHOD
Journal of the Malaysia Institute of Planners (2020)
59
© 2020 by MIP
RESULTS AND DISCUSSION
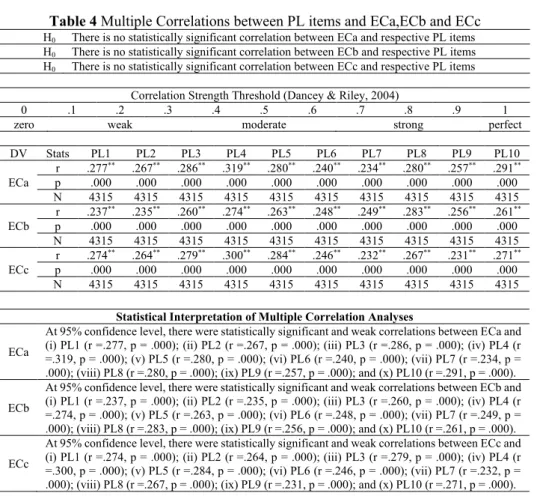
Table 4
Multiple Correlations between PL items and ECa,ECb and ECc
H0 There is no statistically significant correlation between ECa and respective PL items
H0 There is no statistically significant correlation between ECb and respective PL items
H0 There is no statistically significant correlation between ECc and respective PL items
Correlation Strength Threshold (Dancey & Riley, 2004)
0 .1 .2 .3 .4 .5 .6 .7 .8 .9 1
zero weak moderate strong perfect
DV Stats PL1 PL2 PL3 PL4 PL5 PL6 PL7 PL8 PL9 PL10
ECa
r .277** .267** .286** .319** .280** .240** .234** .280** .257** .291**
p .000 .000 .000 .000 .000 .000 .000 .000 .000 .000
N 4315 4315 4315 4315 4315 4315 4315 4315 4315 4315
ECb
r .237** .235** .260** .274** .263** .248** .249** .283** .256** .261**
p .000 .000 .000 .000 .000 .000 .000 .000 .000 .000
N 4315 4315 4315 4315 4315 4315 4315 4315 4315 4315
ECc
r .274** .264** .279** .300** .284** .246** .232** .267** .231** .271**
p .000 .000 .000 .000 .000 .000 .000 .000 .000 .000
N 4315 4315 4315 4315 4315 4315 4315 4315 4315 4315
Statistical Interpretation of Multiple Correlation Analyses
ECa
At 95% confidence level, there were statistically significant and weak correlations between ECa and (i) PL1 (r =.277, p = .000); (ii) PL2 (r =.267, p = .000); (iii) PL3 (r =.286, p = .000); (iv) PL4 (r =.319, p = .000); (v) PL5 (r =.280, p = .000); (vi) PL6 (r =.240, p = .000); (vii) PL7 (r =.234, p = .000); (viii) PL8 (r =.280, p = .000); (ix) PL9 (r =.257, p = .000); and (x) PL10 (r =.291, p = .000).
ECb
At 95% confidence level, there were statistically significant and weak correlations between ECb and (i) PL1 (r =.237, p = .000); (ii) PL2 (r =.235, p = .000); (iii) PL3 (r =.260, p = .000); (iv) PL4 (r =.274, p = .000); (v) PL5 (r =.263, p = .000); (vi) PL6 (r =.248, p = .000); (vii) PL7 (r =.249, p = .000); (viii) PL8 (r =.283, p = .000); (ix) PL9 (r =.256, p = .000); and (x) PL10 (r =.261, p = .000).
ECc
At 95% confidence level, there were statistically significant and weak correlations between ECc and (i) PL1 (r =.274, p = .000); (ii) PL2 (r =.264, p = .000); (iii) PL3 (r =.279, p = .000); (iv) PL4 (r =.300, p = .000); (v) PL5 (r =.284, p = .000); (vi) PL6 (r =.246, p = .000); (vii) PL7 (r =.232, p = .000); (viii) PL8 (r =.267, p = .000); (ix) PL9 (r =.231, p = .000); and (x) PL10 (r =.271, p = .000).
At 95% confidence level, there were statistically significant positive
correlations between (i) ECa and each of PL items, (ii) ECb and each of PL items,
and (iii) ECc and each of PL items. The null hypotheses claiming there are no
statistically significant correlations between (i) ECa and respective PL items, (ii)
ECb and respective PL items, and (iii) ECc and respective PL items were all
rejected.
© 2020 by MIP
60
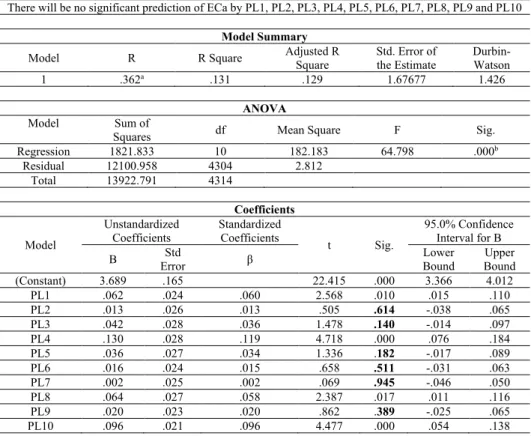
Table 5
Multiple Linear Regression
–
PL predicting
ECa
H0
There will be no significant prediction of ECa by PL1, PL2, PL3, PL4, PL5, PL6, PL7, PL8, PL9 and PL10
Model Summary
Model R R Square Adjusted R Square Std. Error of the Estimate Durbin-Watson
1 .362a .131 .129 1.67677 1.426
ANOVA
Model Sum of
Squares df Mean Square F Sig.
Regression 1821.833 10 182.183 64.798 .000b
Residual 12100.958 4304 2.812
Total 13922.791 4314
Coefficients
Model
Unstandardized Coefficients
Standardized
Coefficients t Sig.
95.0% Confidence Interval for B
B Error Std β Lower Bound Bound Upper
(Constant) 3.689 .165 22.415 .000 3.366 4.012
PL1 .062 .024 .060 2.568 .010 .015 .110
PL2 .013 .026 .013 .505 .614 -.038 .065
PL3 .042 .028 .036 1.478 .140 -.014 .097
PL4 .130 .028 .119 4.718 .000 .076 .184
PL5 .036 .027 .034 1.336 .182 -.017 .089
PL6 .016 .024 .015 .658 .511 -.031 .063
PL7 .002 .025 .002 .069 .945 -.046 .050
PL8 .064 .027 .058 2.387 .017 .011 .116
PL9 .020 .023 .020 .862 .389 -.025 .065
PL10 .096 .021 .096 4.477 .000 .054 .138
A multiple regression was generated to predict ECa based on PL items.
R value of .362 indicated slightly a weak level of prediction (R < 0.4). The
Durbin-Watson statistic was 1.426 which is greater than 1.0 and therefore the data
was not autocorrelated. A significant regression equation was found, F (10, 4304)
= 64.798, p = .000, with an R
2of .131; indicating that the proportion of variance
in ECa that can be explained by PL items was 13.1%.
At 95% confidence level, PL1 (B = .062, t = 2.568, p = .010); PL4 (B
= .130, t = 4.718, p = .000); PL8 (B = .064, t = 2.387, p = .017) and PL10 (B =
.096, t = 4.477, p = .000) were significant predictors of ECa. On the contrary, it
was found that PL2 (B = .013, t = .505, p = .614); PL3 (B = .042, t = 1.478, p =
.140); PL5 (B = .036, t = 1.336, p = .182); PL6 (B = .016, t = .658, p = .511); PL7
(B = .002, t = .069, p = .945) and PL9 (B = .020, t = .862, p = .389) were not
significant predictors of ECa.
Journal of the Malaysia Institute of Planners (2020)
61
© 2020 by MIP
Table 6
Multiple Linear Regression
–
PL predicting
ECb
H0There will be no significant prediction of ECb by PL1, PL2, PL3, PL4, PL5, PL6, PL7, PL8, PL9 and PL10
Model Summary
Model R R Square Adjusted R Square Std. Error of the Estimate Durbin-Watson
1 .335a .112 .110 1.73798 1.549
ANOVA
Model Sum of
Squares df Mean Square F Sig.
Regression 1647.291 10 164.729 54.536 .000b
Residual 13000.532 4304 3.021
Total 14647.824 4314
Coefficients
Model
Unstandardized Coefficients
Standardized Coefficients
t Sig.
95.0% Confidence Interval for B
B Std Error β Bound Lower Bound Upper
(Constant) 3.561 .171 20.877 .000 3.227 3.896
PL1 .028 .025 .026 1.101 .271 -.022 .077
PL2 .004 .027 .004 .157 .875 -.049 .058
PL3 .067 .029 .058 2.310 .021 .010 .125
PL4 .063 .029 .056 2.215 .027 .007 .119
PL5 .021 .028 .019 .757 .449 -.034 .076
PL6 .053 .025 .050 2.139 .032 .004 .101
PL7 .040 .025 .035 1.569 .117 -.010 .090
PL8 .100 .028 .087 3.590 .000 .045 .154
PL9 .039 .024 .038 1.646 .100 -.007 .086
PL10 .056 .022 .055 2.522 .012 .012 .100
A multiple regression was generated to predict ECb based on PL items.
R value of .335 indicated slightly a weak level of prediction (R < 0.4). The
Durbin-Watson statistic was 1.549 which is greater than 1.0 and therefore the data
was not autocorrelated. A significant regression equation was found, F (10, 4304)
= 54.536, p = .000, with an R
2of .112; indicating that the proportion of variance
in ECb that can be explained by PL items was 11.2%.
At 95% confidence level, PL3 (B = .067, t = 2.31, p = .021); PL4 (B =
.063, t = 2.215, p = .027); PL6 (B = .053, t = 2.139, p = .032); PL8 (B = .100, t =
3.59, p = .000) and PL10 (B = .056, t = 2.522, p = .012) were significant predictors
of ECb. On the contrary, it was found that PL1 (B = .028, t = 1.101, p = .271);
PL2 (B = .004, t = .157, p = .875); PL5 (B = .021, t = .757, p = .449); PL7 (B =
.040, t = 1.569, p = .117) and PL9 (B = .039, t = 1.646, p = .100) were not
significant predictors of ECb.
© 2020 by MIP
62
Table 7
Multiple Linear Regression
–
PL predicting
ECc
H0
There will be no significant prediction of ECc by PL1, PL2, PL3, PL4, PL5, PL6, PL7, PL8, PL9 and PL10
Model Summary
Model R R Square Adjusted R Square Std. Error of the Estimate Durbin-Watson
1 .349a .121 .119 1.65688 1.448
ANOVA
Model Sum of
Squares df Mean Square F Sig.
Regression 1633.719 10 163.372 59.511 .000b
Residual 11815.579 4304 2.745
Total 13449.298 4314
Coefficients
Model
Unstandardized Coefficients
Standardized
Coefficients t Sig.
95.0% Confidence Interval for B
B Std Error β Bound Lower Bound Upper
(Constant) 3.833 .163 23.569 .000 3.514 4.152
PL1 .072 .024 .071 3.003 .003 .025 .119
PL2 .019 .026 .018 .730 .465 -.032 .070
PL3 .049 .028 .044 1.763 .078 -.005 .104
PL4 .076 .027 .070 2.779 .005 .022 .129
PL5 .070 .027 .066 2.602 .009 .017 .122
PL6 .033 .024 .032 1.384 .166 -.014 .079
PL7 -.003 .024 -.003 -.120 .904 -.050 .045
PL8 .075 .026 .069 2.845 .004 .023 .127
PL9 -.016 .023 -.017 -.714 .475 -.061 .028
PL10 .085 .021 .087 4.013 .000 .044 .127
A multiple regression was generated to predict ECa based on PL items.
R value of .349 indicated slightly a weak level of prediction (R < 0.4). The
Durbin-Watson statistic was 1.448 which is greater than 1.0 and therefore the data
was not autocorrelated. A significant regression equation was found, F (10, 4304)
= 59.511, p = .000, with an R
2of .121; indicating that the proportion of variance
in ECc that can be explained by PL items was 12.1%.
At 95% confidence level, PL1 (B = .072, t = 3.003, p = .003); PL4 (B
= .076, t = 2.779, p = .005); PL5 (B = .070, t = 2.602, p = .009); PL8 (B = .075, t
= 2.845, p = .004) and PL10 (B = .085, t = 4.013, p = .000) were significant
predictors of ECc. On the contrary, it was found that PL2 (B = .019, t = .730, p =
.465); PL3 (B = .049, t = 1.763, p = .078); PL6 (B = .033, t = 1.384, p = .166);
PL7 (B = -.003, t = -.120, p = .904) and PL9 (B = -.016, t = -.714, p = .475) were
not significant predictors of ECc.
Journal of the Malaysia Institute of Planners (2020)
63
© 2020 by MIP
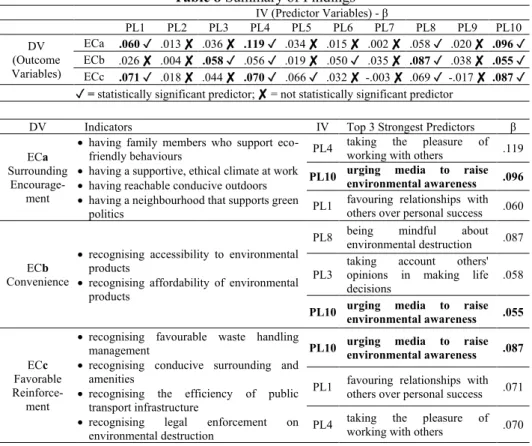
Table 8
Summary of Findings
IV (Predictor Variables) - β
PL1 PL2 PL3 PL4 PL5 PL6 PL7 PL8 PL9 PL10
DV (Outcome Variables)
ECa .060 ✓ .013 ✘ .036 ✘ .119 ✓ .034 ✘ .015 ✘ .002 ✘ .058 ✓ .020 ✘ .096 ✓
ECb .026 ✘ .004 ✘ .058 ✓ .056 ✓ .019 ✘ .050 ✓ .035 ✘ .087 ✓ .038 ✘ .055 ✓
ECc .071 ✓ .018 ✘ .044 ✘ .070 ✓ .066 ✓ .032 ✘-.003 ✘ .069 ✓ -.017 ✘ .087 ✓ ✓ = statistically significant predictor; ✘ = not statistically significant predictor
DV Indicators IV Top 3 Strongest Predictors β
ECa Surrounding
Encourage-ment
•having family members who support
eco-friendly behaviours
•having a supportive, ethical climate at work
•having reachable conducive outdoors
•having a neighbourhood that supports green
politics
PL4 taking the pleasure of working with others .119
PL10 urging media to raise environmental awareness .096
PL1 favouring relationships with others over personal success .060
ECb Convenience
•recognising accessibility to environmental
products
•recognising affordability of environmental
products
PL8 being environmental destruction mindful about .087
PL3
taking account others'
opinions in making life decisions
.058
PL10 urging media to raise environmental awareness .055
ECc Favorable Reinforce-ment
•recognising favourable waste handling
management
•recognising conducive surrounding and
amenities
•recognising the efficiency of public
transport infrastructure
•recognising legal enforcement on
environmental destruction
PL10 urging media to raise environmental awareness .087
PL1 favouring relationships with others over personal success .071
PL4 taking the pleasure of working with others .070
Findings show that some of PL items significantly account for ECa,
ECb and ECc, particularly PL4, PL8 and PL10. PL10, denoting
‘urging media to
raise environmental awareness’ was in the top three strongest predictors across
EC components. Urging greater media awareness implies the confidence in
environmental education as the driver to better EC of environmental behaviours.
Environmental concerns through knowledge and awareness positively impact the
way individuals perceive their contextual factors such as physical infrastructure,
technical facilities, products availability as well as social encouragement.
CONCLUSION
© 2020 by MIP
64
control, moderation and mediation effects of other socio-demography and
socio-psychology variables.
ACKNOWLEDGEMENT
This research was supported by Post-Doctoral Fellow under Research Initatives
Grant Scheme (RIGS-PDF), International Islamic University Malaysia (project
title: RPDF19-005-0015).
REFERENCES
Abu Bakar, A., Mohamed Osman, M., Bachok, M., Hitam, M., and Abdullah, A. (2018).
Human Interdependency for Sustainable Well-Being: Structural Invariance across
Settlement Areas. Planning Malaysia
: Journal of the Malaysian Institute of
Planners
. 16(1) pp. 281-293.
Abu Bakar, A., Mohamed Osman, M., Bachok, S., Ibrahim, M., Abdullah, A., and
Abdullah, F. (2017a). A Review on Sustainable Wellbeing Indicators for Human
Interrelationships with the Environment. Planning Malaysia:
Journal of the
Malaysian Institute of Planners
, 15 (1). pp. 357-368. ISSN 1675-6215.
Abu Bakar, A., Mohamed Osman, M., Bachok, S., Ibrahim, M., Abdullah, A., and
Abdullah, F. (2017b). A theoretical assessment on sustainable wellbeing
indicators for people interrelationships. Planning Malaysia:
Journal of the
Malaysian Institute of Planners
, pp. 21-30. ISSN 1675-6215.
Abu Bakar, A., Mohamed Osman, M., Bachok, S., Ibrahim, M., and Abdullah, A.
(2017c). Sustainable Well-Being: An Empirical Exploration on Human
Interdependence with the Environment.
Advanced Science Letters
. American
Scientific Publishers. 23(7) pp. 6352-6356.
Borhan, H., Ahmed, E., & Hitam, M. (2013). CO2, Quality of Life and Economic Growth
in East Asian 8.
Journal of Asian Behavioural Studies
, Volume 3, Number 8,
January/February 2013, 3(February 2013), 13
–
24.
Caesar, L. A. Y. (2016). Performance Excellence by Transformational Leadership in
Developing Collectivistic Culture for Indonesian Companies.
Pertanika Journal
of Social Sciences and Humanities
, 24(May), 19
–
32.
Clark, M., Amar-Singh, H. S., & Hashim, L. (2014). The Subjective Well-Being of
Malaysian School Children: Grade Level, Gender and Ethnicity.
Psychology
, 5(5),
1453
–
1462.
Dancey, C. and Reidy, J. (2004) Statistics without Maths for Psychology: using SPSS for
Windows. Prentice Hall, London.
Delima, M., & Zaman, K. (2012). Environmental Ethical Commitment (EEC): Factors
that Affect Malaysian Business Corporations.
Journal of Asian Behavioral
Studies
, 2(October 2012), 11
–
22.
Hafezi, M. H., Nor, R. M., & Ismail, R. (2013). Passengers Preference and Satisfaction
of Public Transport in Malaysia.
Journal of Applied Sciences, Engineering and
Technology
, 6(8), 1450
–
1456.
Journal of the Malaysia Institute of Planners (2020)