An Evaluation Engine for Dynamic Ranking of Cloud Providers
Pawel Czarnul
Narutowicza 11/12, 80-233 Gdansk, Poland
E-mail:[email protected]://pczarnul.eti.pg.gda.pl
Keywords:cloud computing, ranking cloud providers
Received:December 13, 2012
The paper focuses on creation of an effective dynamic ranking service for IaaS, PaaS and SaaS cloud providers. It considers building a quality model for this purpose along with definition of quality measure-ment procedures. The paper discusses several techniques known from already existing price comparison engines that could be modified and adopted for comparison of cloud providers. A technique for filtering measured data is proposed, in particular to avoid vendor lock-in issues. The paper presents a design and results from an engine for simulation of various ranking algorithms in response to streams of prices from various providers. Examples with various streams of provider prices and resulting rankings are presented that cope with the vendor lock-in issue as well as consider the impact of long or short-term price changes on the ranking.
Povzetek: ˇClanek se osredotoˇca na izdelavo uˇcinkovite storitve za dinamiˇcno rangiranje ponudnikov storitev tipa IaaS, PaaS in SaaS v oblaku.
1
Introduction
Cloud computing has become more and more widespread and popular in today’s world with many offerings regard-ing infrastructure, ready-to-use platforms and services [1]. These can be categorized as follows:
– IaaS – Infrastructure as a Service - making an in-frastructure (computing, storage, operating system) with a given configuration available to a client, ex-amples: Google Compute Engine1, Amazon Elastic
Compute Cloud (EC22)2, RackSpace Cloud Servers3,
Rack Space Cloud Files4,
– PaaS – Platform as a Service - offering a complete platform with particular software required by users; examples include: Aneka [10], Google AppEngine5,
Windows Azure6, RedHat Openshift7, RackSpace
Cloud Sites8,
– SaaS – Software as a Service - particular software that is managed by its provider and accessed by users from any location. Examples include Google Apps9 and
Salesforce10.
1http://cloud.google.com/products/compute-engine.html 2http://aws.amazon.com/ec2/
3http://www.rackspace.com/cloud/cloud_hosting_products/servers/ 4http://www.rackspace.com/cloud/cloud_hosting_products/files/ 5https://developers.google.com/appengine/
6http://www.windowsazure.com 7https://openshift.redhat.com/app/
8http://www.rackspace.com/cloud/cloud_hosting_products/sites/ 9http://www.google.com/Apps
10http://www.salesforce.com/eu/
Following search engines and price comparison tools and engines for the traditional marketplaces, there have emerged tools for comparison of cloud offers as well. For instance, as of this writing a web search on “IaaS ranking” returns several surveys on IaaS: either static analyses11 12 13 or rankings that depend on actual parameters of the
of-fers (such as prices) that can change in time14 15. Platforms such as Cloudorado16allow to preselect user requirements such as required processor computing capabilities or stor-age and return a ranking based on that. FindTheBest allows to select a cloud provider based on its type (IaaS, PaaS) but also the control interface, software license or subscription type.
It seems, however, that many of these rankings use un-structured quality comparison models, do not consider how qualities have been changing over time for providers and do not address issues such as vendor lock-in. It is a known fact that some Internet providers or shops used to offer very cheap prices to gain a market share (by being on top places in comparison rankings) only to deceive some customers later. The paper discusses a quality model for a dynamic ranking of cloud providers that addresses these issues. This work extends the concepts presented in [5] by proposing a design and implementation of a simulation engine for run-ning various provider ranking algorithms and presentation of its results for various streams of input price offers from
11http://my-inner-voice.blogspot.com/2011/02/here-are-results.html 12 http://insidehpc.com/2011/02/10/survey-results-on-cloud-iaas-providers/
13http://www.opsource.net/Info-Tech-Cloud-IaaS-Vendor-Landscape 14http://www.cloudreviews.com/top-ten/cloud-hosting-services.html 15http://cloud-computing.findthebest.com/
various providers.
The structure of the paper is as follows. Section 2 dis-cusses the problem of quality assessment of services of-fered on the cloud. Next, Section 3 details the design and implementation of a simulator for ranking input streams of price offers from various providers. Experiments for vari-ous input streams are presented in Section 4 which is fol-lowed by a summary in Section 5.
2
Quality evaluation of cloud offers
Before educated selection of services can be performed, it is necessary to incorporate measurable quality assessment of the given service. This comprises several aspects that need to be addressed:
1. a quality model/ontology that defines metrics to be measured,
2. quality measurement procedures – e.g. how fre-quently the metrics should be measured – this may be different for various metrics; for instance availability may require more frequent monitoring than the price,
3. filters applied on top of the measured values – such may be used to address several issues such as:
– preventing from short-term peaks in measured values to affect output; possibly only longer last-ing changes should do that,
– preventing from one or few providers to occupy top places all the time by offering too good to be true conditions,
– considering or not sudden changes in the history of the provider which may affect user decisions who might be afraid of similar changes in the future – it may depend on the user whether he or she wants to consider this aspect.
For metrics, it is recommended to adopt and extend the already used techniques for marketplaces in the Internet. Namely, evaluation of the providers using a numerical scale such as [0,10] which is offered for almost any price com-parison engine today along with physical location of a par-ticular provider. In this case, a quality ontology is proposed for quality service evaluation of particular IaaS, PaaS, SaaS that will incorporate the following:
accessibility[11] – characterizes the network be-tween the client in location and the service, several entries of this type could be inserted,
availability[12, 13, 11, 2] – characterizes the avail-ability of the service itself. It can be measured by e.g. checking its availability vs availability of other ser-vices/servers in a similar geographical/provider loca-tion,
reputation[12] – reputation of the provider,
security[11] – offered by the provider,
fidelity[3] orconformance[11] – with standards,
cost-effectiveness– evaluated by clients,
reconfiguration ability – applicable to IaaS
and PaaS,
interface– how easy it is to access the infrastructure and upload/download/execute applications.
As suggested in Section 3, various filters can be applied on top of measured values. For instance, a one time peak in measurements of a certain value might not change the over-all score of the given metric. Only a longer lasting change would initiate this. A simple average would work as a low-pass filter. The regular average suffers from the historical effect i.e. results from the past affect the final average in the same way as the last input. It may depend on the client whether to rely more just on recent measurements. This could be further extended to a running score e.g. a running average of 10 or 100 values. Alternatively, the history of the provider might be important for the given client.
In order to avoid a situation when one provider wants to dominate the given segment of the market by e.g. using too good to be true prices it is possible to consider a cer-tain number of best offers and rotation on the first ranking places, provided that results returned for the services are closer to each other than a predefined threshold. Even one company could then try to use different providers for parts of their businesses to avoid the lock-in problem.
3
Proposal of an evaluation engine
and visualization for ranking
algorithms
In a way, the proposed approach can be seen as a solution aiding sky computing [8] as the proposed engine tries to sort out available cloud options and offer best options at a higher level of cloud integration.
As mentioned above, the goal of the engine is to be able to:
1. monitor Quality of Service (QoS) dynamically which refers to periodic measurements of quality metrics ap-plicable to cloud services,
2. avoid potential vendor lock-in problem.
3.1
Proposed simulation engine
offers over time and simulate execution of a ranking algo-rithm that would output certain scores for particular offers at particular moments in time. From the cloud client’s point of view that gives the preference in choosing “the best” offer by selecting the top offer. If some particular needs of the client are not considered in the ranking scheme, the next best offer can be selected as well. However, from the global point of view i.e. the population of clients, the rank-ing algorithm is supposed to provide a solution that copes well with the vendor lock-in issue. Namely, it does not to allow selection of just one best provider at all times even if its offer seems to be the best from the QoS perspective. This is to prevent from dumping practices or similar over a certain period of time just to gain market share.
Let us focus first on one quality metric such as price. The following notation will be used:
– pi(t)– the price offered by provideriat timet,
– dpi(t) = |pi(t)−pi(t−1)| – the price difference between successive discrete points in time,
– dapai(t) = Pt
x=adpi(x)– the accumulated sum of
price differences offered by the particular provider; the goal of this metric is to assess an accumulated rate of price changes over period fromauntilt. The larger t−ais the larger history has an impact on the current value ofdapa
i(t).
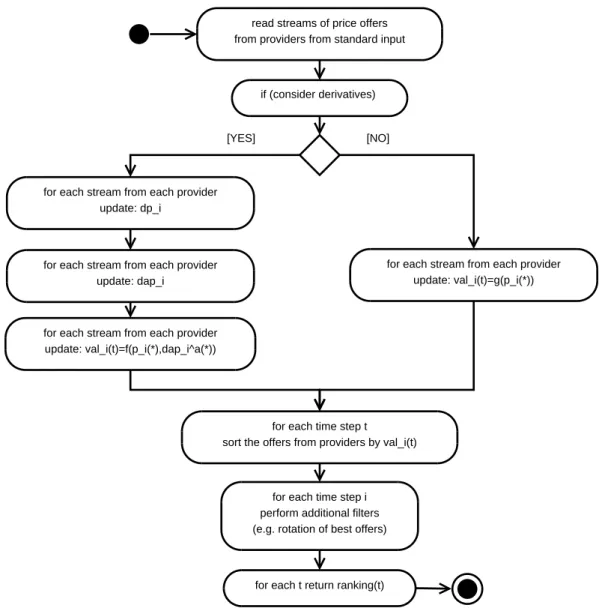
The flow of the data through the simulation engine is shown in Figure 1. Several steps are performed includ-ing: computing the above values, then computing values vali(t) = f(pi(t), dpi(t), dapa
i(t))against which sorting
will be performed such that the lower the value ofvali(t)
the better place in the ranking provideriwill be assigned. Furthermore, this scheme is extensible i.e. it allows modeling of several behaviors of cloud providers as well as easily extend the ranking algorithm with:
new metrics. This can be done by extending the struc-ture that currently containspi(t), dpi(t), dapi(t). For
instance, the metrics can include: reputation of the provider ri(t), availability ai(t) etc. This leads to
consideration ofdri(r), dari(t), dai(t), daai(t). The
final value ofvali(t)would be a function of all these metrics.
application of other digital filters in addition todpanddap to process the data of a particular cloud provider over successive time steps and works for particular metrics. For instance, depending on the needs and particular metrics, either high or low pass filters can be used.
The whole system consists of the following programs that pass data using standard inputs and outputs as well as additional files:
1. datagenerator – generates input streams of data e.g. price offers,
2. simulator – implementing the aforementioned evalua-tion algorithm,
3. visualization tool – implemented using custom input scripts and the GNU Plot tool.
3.2
A wider perspective on QoS evaluation
From the client point of view, it would be desirable to have access to a comparison engine like Cloudorado with the aforementioned features. First of all, the engine can con-sider three categories of: IaaS, PaaS and SaaS. It can first match available offers in terms of functions and then evalu-ate based on the ranking discussed earlier. In order to make search better, two solutions are feasible:
1. categorization of features such as hardware and soft-ware parameters desired by the client:
– memory size,
– processor/core/GPU capabilities,
– storage,
– operating system,
– particular software, – access interface.
This is especially suitable for IaaS and PaaS offerings.
2. full text search as in [6]. This allows formulation of desired functions in the form of human readable text. Useful mainly for SaaS as it would allow searching and presentation of SaaS offers for a particular appli-cation.
The full text search mechanism could also be applied to any type of service when looking for comments of already existing clients.
This would also naturally lead to creation of runtime reg-istries of particular IaaS, PaaS and SaaS offers [9]. SaaS options could then be categorized into various categories. One possibility is to adopt the well know technique from photo sharing sites i.e. augmenting descriptions with tags. Then selection of particular tags would narrow search re-sults.
4
Experiments
In this section a series of experiments is provided along with graphs presenting:
1. input data from cloud providers i.e. prices offered over time,
read streams of price offers from providers from standard input
for each stream from each provider update: val_i(t)=f(p_i(*),dap_i^a(*))
for each time step t sort the offers from providers by val_i(t)
for each t return ranking(t) for each stream from each provider
update: dp_i
for each time step i perform additional filters (e.g. rotation of best offers)
[YES] [NO]
if (consider derivatives)
for each stream from each provider update: dap_i
for each stream from each provider update: val_i(t)=g(p_i(*))
Figure 1: Steps for filtering input providers’ offers
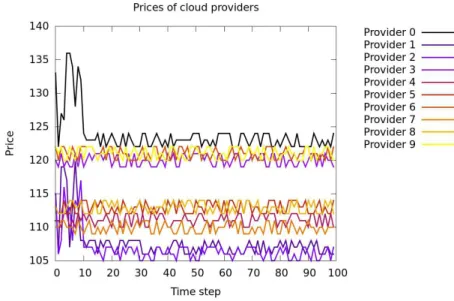
The basic assumptions for the following tests are as fol-lows. There are 10 cloud providers that offer a service of a particular type (PaaS, IaaS or SaaS) and adjust their prices in successive time steps by introducing small variations to their base prices as shown in the following figures. For each of the input data streams outputs that denote ranking of particular providers are shown. For the end client, the provider that occupies the top spot at the particular moment should be selected. For each test case, several figures are shown: input streams of unmodified cloud offers, ranking by values that result from functions of the observed orig-inal prices and the latter modified by rotation of the best offers in the ranking.
4.1
Stable prices with reasonably small
variations over time and elimination of
vendor lock-in
For the input shown in Figure 2, the prices from various providers are close to each other which results in slight changes of the ranking by sorting just byvali(t) =pi(t).
Figure 2: Offers from cloud providers in successive time steps
Figure 3: Ranking of cloud providers byvali(t) =pi(t)
Figure 5: Offers from cloud providers in successive time steps
Figure 6: Ranking of cloud providers byvali(t) =pi(t) +dap0
i(t)
Figure 8: Offers from cloud providers in successive time steps
Figure 9: Ranking of cloud providers byvali(t) =pi(t) +dapti−4(t)
4.2
Considering derivatives in ranking
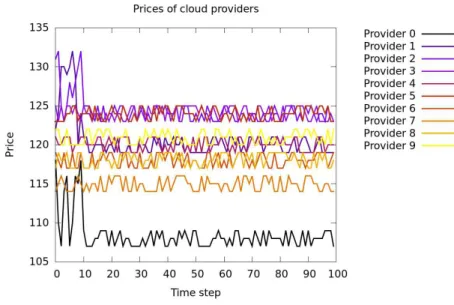
In the following tests, considerable changes of prices of selected cloud providers were simulated in the first 10 time steps of the simulation. This is shown in both considered inputs in Figures 5 and 8.
Two different solutions were proposed here:
1. dpi(t)s are computed for each time step i.e.
abso-lute values of differences in prices between succes-sive time steps. Then the accumulated sum ofdap0
i(t)
is computed. As shown in Figure 6, ranking by vali(t) = pi(t) +dap0
i(t)considers the whole past
history of price changes of a particular provider. The larger the derivatives, the smaller chance the provider will occupy top spots of the ranking. It can be clearly seen that even though two providers offer the best cur-rent prices in later time steps as shown in Figure 5, the history of larger changes has put them back into fur-ther places in the ranking. Figure 7 shows additional mixing of the top three spots.
2. As shown in Figure 9, ranking by vali(t) = pi(t) +
dapti−4(t)considers only the recent history of price changes of a particular provider. It can be seen very clearly that the provider offering the best current prices in the initial time steps falls down in the rank-ing but then recovers to the top spot. Figure 10 shows additional mixing of the top three spots.
Obviously, additional filters and combination of various QoS metrics can be obtained and programmed analogously just by adding additional processing functions to the flow proposed in Section 3. Depending on the client needs, a ranking is then created that allows to select the best offer at any time. For instance, it can also consider the providers that the client has already been using.
5
Summary and future work
The paper presented an idea, design and implementation of a simulator for ranking incoming streams of provider offers that may be applicable for real world cloud offers. The simulator allows to test various algorithms for ranking providers with easy changing to other algorithms or even filters within the algorithms. Practical applications include incorporation of the idea into Internet price comparison en-gines, cloud service search engines as well as integrated systems for workflow management where services need to be found for workflow subtasks.
Further work will focus on extension of the simulator with new filters and development of an integrated evalua-tion method for various QoS metrics. Addievalua-tionally the en-gine will be deployed in the BeesyCluster middleware for assessment of its services and then used in discovering and incorporation of such services into workflow applications on grids [4]. Such workflows can also be run on clouds [7].
References
[1] Rajkumar Buyya, Chee Shin Yeo, Srikumar Venugopal, James Broberg, and Ivona Brandic. Cloud computing and emerging it platforms: Vision, hype, and reality for deliv-ering computing as the 5th utility. Future Gener. Comput. Syst., 25(6):599–616, June 2009.
[2] G. Canfora, M. Di Penta, R. Esposito, and M.L. Villani. A Lightweight Approach for QoS-Aware Service Compo-sition, 2004. ICSOC forum paper, IBM Technical Report Draft.
[3] Jorge Cardoso, Amit Sheth, and John Miller. Workflow quality of service. Technical report, LSDIS Lab, Depart-ment of Computer Science, University of Georgia, Athens, GA 30602, USA, March 2002.
[4] Pawel Czarnul. Modeling, run-time optimization and ex-ecution of distributed workflow applications in the jee-based beesycluster environment. The Journal of Super-computing, pages 1–26, 2010. 10.1007/s11227-010-0499-7, http://dx.doi.org/10.1007/s11227-010-0499-7.
[5] Pawel Czarnul. Dynamic ranking of cloud providers. In Proceedings of the 4th International Workshop on Software Services – WoSS 2012, pages 6–8. Univerza v Ljubljani, 2012. ISBN 978-961-6884-06-8, Eds.: Vlado Stankovski and Dana Petcu.
[6] Pawel Czarnul and Jakub Kurylowicz. Automatic conver-sion of legacy applications into services in beesycluster. In Proceedings of 2nd International IEEE Conference on Information Technology ICIT’2010, pages 21–24, Gdansk, Poland.
[7] G. Juve and E. Deelman. Grids, Clouds and Virtualization, chapter Scientific Workflows in the Cloud, pages 71–91. Springer, 2010.
[8] Katarzyna Keahey, Mauricio Tsugawa, Andrea Matsunaga, and Jose Fortes. Sky computing.IEEE Internet Computing, 13:43–51, 2009.
[9] S. Pandey, D. Karunamoorthy, and R. Buyya. Cloud Com-puting: Principles and Paradigms, chapter Workflow En-gine for Clouds. Wiley Press, New York, USA, 2011. ISBN-13: 978-0470887998.
[10] Suraj Pandey, Dileban Karunamoorthy, and Rajkumar Buyya.Cloud Computing: Principles and Paradigms, chap-ter Workflow Engine for Clouds, pages 321–344. Wiley Press, New York, USA, February 2011. ISBN-13: 978-0470887998.
[11] Chintan Patel, Kaustubh Supekar, and Yugyung Lee. A QoS Oriented Framework for Adaptive Management of Web Ser-vice based Workflows. InProceedings of the 14th Interna-tional Database and Expert Systems Applications Confer-ence (DEXA 2003), LNCS, pages 826–835, Prague, Czech Republic, September 2003.
[12] L. Zeng, B. Benatallah, M. Dumas, J. Kalagnanam, and Q. Sheng. Quality driven web services composition. In Pro-ceedings of WWW 2003, Budapest, Hungary, May 2003.