How to cite:
Suryanto T, Tjahjono HA, Widjajanto E (2017) Levels of 25(OH)D3, IL-2, and C-peptide in Children with Type 1 Diabe-tes Mellitus (T1DM) Receiving Vitamin D3 Supplementation. J. *Corresponding author:
Tjahyo Suryanto
Faculty of Medicine, Brawijaya University Jalan Veteran, Malang, Indonesia 65145
VOL. 8, NO. 1, pp. 28 – 36, January 2018 Submitted May 2017; Revised June 2017; Accepted November 2017
Levels of 25(OH)D
3, IL-2, and C-peptide in Children with Type 1 Diabetes Mellitus (T1DM)
Receiving Vitamin D
3Supplementation
Tjahyo Suryanto *, Harjoedi Adji Tjahjono, Edi Widjajanto
Faculty of Medicine, Brawijaya University, Malang, Indonesia
ABSTRACT
Type 1 Diabetes Mellitus (T1DM) has become a health problem in many countries. T1DM is the consequence of autoimmune destruction process of β cells. There was relationship between vitamin D deficiency with T1DM. The
destruction process was caused by an imbalance of pro-inflammatory and anti-inflammatory cytokines. One of the pro-inflammatory cytokines is IL-2. C-peptide examination to see the function of beta cells due to destruction of pancreatic beta cell. Administration of vitamin D3 supplementation still cause controversy and give varying results.
This randomized clinical trial was conducted to determine the levels of 25(OH)D3, IL-2, and C-peptide in people
with T1DM who received vitamin D3 supplementation. The subjects were 26 children with T1DM, divided into K1
group (received vitamin D3 supplementation) and K2 group (received placebo). The results showed higher levels of
25(OH)D3 in the K1 group and statistically found a significant difference (p = 0.00). Higher levels of IL-2 and lower
C-peptide were obtained in the K1 group and no statistically significant differences were found (p = 0.76 and p= 0.26). The insignificant relationship and the negative correlation were found between 25(OH)D3 and IL-2 (p = 0.71;
r = - 0.12), 25(OH)D3 and C-peptide (p = 0.59; r = -0.16), also levels of IL-2 and C-peptide (p = 0.13; r = -0.44) in
children with type 1 diabetes who received vitamin D3 supplementation. From this study can be concluded that administration vitamin D3 supplementation in patients with T1DM can increase levels 25(OH)D3 significantly. This
increase has not significantly lowered levels of IL-2 and increased levels of C-peptide. However, there was an absolute decrease in the rate of slower C-peptide in the supplemented group than in the placebo group.
Keywords: Type 1 DM, 25(OH)D3, C-peptide, IL-2
INTRODUCTION
Type 1 Diabetes Mellitus (T1DM) has become a health problem in many countries, with an overall in-crease estimation is 3% per year. In 2010, children who suffer from T1DM has reach 480,000 patients worldwide and the number of new cases which diagnosed each year reach 75,800 children [1]. The prevalence of T1DM in Indonesia was 3.1 per 100,000 population in 2011 [2]. While the number of children with T1DM at Saiful Anwar Hospital (RSSA) Malang between the years 2005 to 2012 was 1.8 per 100,000 population [3].
Type 1 Diabetes Mellitus is the consequence of au-toimmune destruction process of β cells, which produce
insulin hormone, and the result of interactions between multiple genes and environmental exposures [4, 5]. Re-
cently, researcher has discovered relationship between vitamin D deficiency with the risk of chronic diseases, including autoimmune diseases such as T1DM. Vitamin D3 turns out to has immunosuppressive effect, thus it can prevent insulitis and further destruction of pancre-atic cells [6, 7]. The process of autoimmune destruction of β cells occurs due to an imbalance of
inflamma-tory and anti-inflammainflamma-tory cytokines. One of the pro-inflammatory cytokines that play a role in T1DM is in-terleukin-2 (IL-2). IL-2 and IFN-γ will activate cytotoxic
T cells to destroy target cells presented by the Major Histocompatibility Complex (MHC). In addition, this cytokine combination will activate the natural killer (NK) cell [8]. Autoimmune destruction of pancreatic beta cell in T1DM causes the need for an examination
that is sensitive to see the function of β cells.
Examina-tion of C-peptide can be used to assess secreExamina-tion of en-dogenous insulin released by theβcells of the pancreas
[9, 10].
Research in various countries, such as in the United States, Switzerland, Australia, and Indonesia mentioned that people with T1DM suffered from vitamin D defi-ciency and insuffidefi-ciency [11, 12, 13, 14]. Administration vitamin D3 supplementation can prevent or reduce au-toimmune damage and destruction of pancreatic β cells
[7]. Many studies were conducted in various countries to determine the effect of vitamin D3 supplementation
on levels of 25(OH)D3, IL-2, and C-peptide in children
with T1DM. The results obtained are still varied and still cause controversy [15, 16]. Current research on the ef-fect of vitamin D3 supplementation on levels of 25(OH)D3, IL-2, and C-peptide in children with T1DM
is not present in Indonesia. Therefore, the purpose of this study was to determine the effect of vitamin D3
sup-plementation on levels of 25(OH)D3, IL-2, and
C-pep-tide in children with T1DM.
MATERIALS AND METHODS Study design
This experimental study was designed as random-ized clinical trial (RCT) double blind, pre- and post-test control group. Vitamin D3 supplementation was
admin-istered for 6 months. Before treatment, subjects with T1DM was measured for 25(OH)D3, IL-2, and
C-pep-tide level. Then, all subjects were randomly divided into 2 groups (K1 and K2) as follow: K1: subjects were treated with insulin 0.5-2 IU/day + vitamin D3 2000
IU/day (D-Vit, PT. Gracia Pharmindo) for 6 months, K2: subjects were treated with insulin 0.5-2 IU/day + placebo (flour containing capsules,D3 Farmasi. Ltd) for
6 months. All procedures in this study had been ap-proved by Ethical Committee of Research, RSSA, Ma-lang, Indonesia.
Subjects
As many as 26 subjects were included in this study (13 subjects K1 and 13 subjects K2). Subjects were taken from Pediatric Endocrinology Outpatient Care, Saiful Anwar General Hospital, Malang, Indonesia during April-October 2016. Inclusion criteria for subjects are as follows: diagnosed as T1DM, age 1-18 years old, not on vitamin D3 supplementation, and allowed by his/her
parents (informed consent). Exclusion criteria for sub-jects is T1DM patients with other autoimmune disease, severe infection, hepatic dysfunction, renal dysfunction,
anemia and on vitamin D3 supplementation.
Measurement of 25(OH)D3 level
Based on the manufacturer's instruction (Orgentec, Alegria, Germany), this research used Enzyme Linked Immunosorbent Assay to assess the level of Vitamin D (25(OH)D3). The samples used were plasma stored at
-20°C. The method of inspection is to prepare a
polypro-pylene tube, one for calibrator, control and sample. Con-jugate enzymes, substrate enzymes, sample buffers and specific test controls was included in the kit with 8-well-microstrips. One patient sample used each strip for a single determination. We pipetted sample into well No 1 and mixed with tracer reagent and the 25-OH vitamin D3/D2 obtained from vitamin D binding protein. 25-OH vitamin D and tracer reagent was coated with buffer suspension at well 2. A well-reacted reaction in which 25-OH vitamin D3/D2 and 25-OH vitamin D tracer re-agents compete to bind 25-OH vitamin D3/D2 antibod-ies to form complex 25-OH vitamin D3/D2 and anti-bodies or 25 -OH vitamin D reagent tracer and antibody happened when samples and controls was transferred to wells No. 3 and No. 4. Covered the plate with plastic and incubated at 18 – 25°C for 2 hours. Washed the plate to remove unbound and unspecifically bound mol-ecules. Subsequently enzyme conjugate binds to the im-mobilized tracer-antibody complexes was added. Plate is closed and wrapped with plastic, incubated at 18 – 25°C for 30 minutes. We washed the plate to remove unbound enzyme conjugate. Added TMB substrate enzymes to well than closed and wrapped the plate in a plastic bag. The plate was incubated 18 – 25°C for 30 minutes in order to get hydrolyzation and color development dur-ing incubation. We added Stop Solution to the well to stop the reaction. Read at 650 nm using the ELISA reader for the intensity of the blue color. Vitamin D level > 30 ng/mL was defined as a normal level [17].
Measurement of C-peptide level
Based on the manufacturer's instruction (Roche, Cobas e, USA), this research used Enzyme Linked Im-munosorbent Assay to assess the level of C-peptide. This assay based on the the quantitative sandwich enzyme principle. The examination time is 18 minutes at 37°C.
C-peptide-specific antibody labeled with a ruthenium com-pound. The 100 µL conjugate is mixed in each well for 5 minutes. Incubation for 30 minutes at room tempera-ture. In the second stage incubation, streptavidin-coated microparticles is added and the complex becomes at-tached to a solid phase through the interaction of biotin and streptavidin. The incubated mixture was removed and well washed 3 times using a buffer solution. TMB solution is mixed into each well including the empty one. Incubation for 15 minutes at room temperature. We added 50 µL of the Stop Solution at each well to stop the reaction and read at 450 nm using the ELISA reader for the absorbance.
Measurement of IL-2 level
Based on the manufacturer's instruction (Biolegend, Legend Max, USA), this research used Enzyme Linked Immunosorbent Assay to assess the level of IL-2. All re-agents are prepared at room temperature. Prepare 500
µL standard solution of 1,000 pg/mL by diluting 25 µL standard stock solution in 475 µL Assay Buffer B. Dilute 6 times from standard solution 1,000 pg/mL in separate tube using Assay Buffer B as diluent. We could see the Human IL-2 standard concentrations in the tubes from 1,000 pg/mL to 15.6 pg/mL, respectively, and Assay Buffer B was functioning as a standard zero (0 pg/mL). Plate is washed 4 times using 1X Wash Buffer solution at least 300 µL at each well and remove remaining 1X Wash Buffer solution with filter paper every time wash. Assay Buffer B solution was added as much as 50 µL in each well which will each contain 50 µL the standard solution and samples in the appropriate well. Closed the plate and incubated for 2 hours while vibrating. Washed the plate with 1× Wash Buffer solution 4 times as above. The second incubation phase is carried out after being added Human IL-2 antibody solution in each well. This process is done at room temperature for 1 hour while vibrating. The plate was washed with 1× Wash Buffer solution 4 times as above. The third incubation phase is carried out after being added Avidin-HRP solution to each well. This process is done at room temperature for 30 minutes while vibrating. The plate was washed with 1× Wash Buffer solution 5 times as above, for 30 seconds to 1 minute for each wash in order to minimize the back-ground. The next incubation phase is carried out after being added Substrate Solution F to each well, incubated for 20 min in dark condition and the plate need not be closed. The wells should turn into a blue color with in-tensity that is proportional to its concentration. Stopped the process by adding a Stop Solution at each well. We
could see that the color of the solution changed from blue to yellow. We read at 450 nm using the ELISA reader for the absorbance.
Statistical analysis
Statistical test was based on data distribution and homogeneity by using Shapiro-Wilk test. Statistical dif-ferences of 25(OH)D3 level after treatment between
group was analyzed by independent t-test. For differ-ences of IL-2 and C-peptide level after treatment be-tween group were analyzed by Mann-Whitney test. Cor-relation of 25(OH)D3, IL-2, and C-peptide level were
analyzed by Spearman correlation test. Data was ana-lyzed at 95% confidence interval (α= 0.05) using SPSS
for Windows version 17.0.
RESULTS AND DISCUSSION Subject characteristics
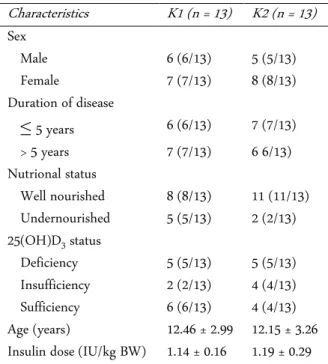
Subject characteristics such as sex, age, duration of disease (T1DM), insulin dose, and nutritional status was shown in Table 1. Data obtained from Table 1 shows the most distribution of sex in the two research groups are female. For the duration of illness, both groups were found to be approximately equal. Nutritional status in both groups found more children with well-nourished status. Vitamin D status in both groups found more dren with abnormal vitamin D status (16/26) than chil-dren with normal vitamin D status (10/26). Age and
in-sulin dose was listed as mean ± standard deviation dan
between two groups showed no statistically significant difference, which obtained p > 0.05, that is 0.80 and 0.57, respectively.
As many as 26 children with T1DM were subjected to study and divided into 2 groups, group 1 consisting of T1DM patients receiving vitamin D supplementation and group 2 consisting of T1DM patients receiving pla-cebo. The most distribution of sex in the two research groups are female. This is in accordance with previous research in which the incidence of T1DM in Indonesia with male sex ratio compared to female 45 : 55, besides that female has proportion 3 times more than male [18]. But contrary to data from the IDF in 2011 that says that male more than female as much as 1.5 times. However, based on ISPAD data in the same year mentioned that gender differences to the incidence of T1DM did not occur as a whole worldwide [1]. These differences are due to differences in population, race, and number of research subjects [19].
Table 1. Subject Characteristics
Characteristics K1 (n = 13) K2 (n = 13)
Sex
Male 6 (6/13) 5 (5/13) Female 7 (7/13) 8 (8/13) Duration of disease
≤ 5 years 6 (6/13) 7 (7/13) > 5 years 7 (7/13) 6 6/13) Nutrional status
Well nourished 8 (8/13) 11 (11/13) Undernourished 5 (5/13) 2 (2/13) 25(OH)D3 status
Deficiency 5 (5/13) 5 (5/13) Insufficiency 2 (2/13) 4 (4/13) Sufficiency 6 (6/13) 4 (4/13) Age (years) 12.46 ± 2.99 12.15 ± 3.26 Insulin dose (IU/kg BW) 1.14 ± 0.16 1.19 ± 0.29
Table 2. Results of comparison of levels of 25(OH)D3. IL-2, and C-peptide in the group receiving vitamin D supple-mentation compared with the placebo group
Variable K1 K2 p-value
25(OH)D3 104.75 ± 39.51 18.56 ± 23.31 0.00 C-peptide -0.08 ± 0.08 -0.04 ± 0.03 0.26 IL-2 110.12 ± 378.96 31.58 ± 316.46 0.76
search in Brazil where 59% of T1DM people with well nourished, 1% with malnutrition, and 40% with obesity [20]. In theory, nutritional status has no direct effect on T1DM because decreased insulin secretion that occurs due to autoimmune process is not due to decreased in-sulin sensitivity as occurs in other types of DM [21].
Puberty is a transitional period between childhood and adulthood that is influenced by complex factors. At this time there are physical and psychological changes that arise due to changes in endocrine activity sequen-tially and regularly. In the United States most girls will experience puberty at the age of 8 – 13 years, while boys are aged 9 – 14 years [22]. Onset, peak work, and dura-tion of insulin work are the decisive factors in the man-agement of DM patients. Insulin dose adjustment aims to achieve optimal metabolic control, without increasing the risk of hypoglycemia and without neglecting the quality of life of patients both short and long term.
Dur-ing the ‘honeymoon’ period the total daily dose of insu- lin is < 0.5 IU/kgBW/day, the child before puberty
(out-side the ‘honeymoon’ period) in the dose range of 0.7
-1.0 IU/kgBW/day, while during puberty the need in-creases above 1 IU to 2 IU/kgBW/day [23, 24]. This may
be the case in this study, with mean age of 12.46 ± 2.99 years for the K1 group and 12.15 ± 3.26 years for the K2
group which is the age of puberty, so that an average
insulin dose of 11.14 ± 0.16 and 1.19 ± 0.29 IU/kgBW/ day for each group in order.
Level of 25(OH)D3. IL-2, dan C-peptide in the group re-ceiving vitamin D supplementation compared with the placebo group
Based on data normality test, it was found that levels of 25(OH)D3 in both groups were normally distributed
(p > 0,05) while the levels of IL-2 and C-peptide were not normally distributed (p < 0.05). From different test, there was a significant difference in the levels of 25(OH)D3 among the group receiving vitamin D
sup-plementation and the group receiving placebo (p = 0.00). But non-significant differences were found in the levels of IL-2 (p = 0.76) and C-peptide (p = 0.26) between two groups (Table 2).
Vitamin D status in the study sample was domi-nated by abnormal levels of 25(OH)D3, either deficiency
or insufficiency, with a total of 16 people. This indicates that 61.5% of patients with T1DM who are the subjects of our study have low levels of 25(OH)D3. Similarly,
when the subjects were divided into two groups: those receiving vitamin D supplementation and placebo, both were dominated by low levels of 25(OH)D3, i.e. 7 people
(54%) and 9 people (69%), respectively. Our research is in line with previous research conducted in RSSA Ma-lang, 90% of children with T1DM had low levels of 25(OH)D3 [14]. The same result also obtained in various
countries, such as in the United States, Switzerland, and Australia, where in patients with T1DM suffered from vitamin D deficiency and insufficiency [11, 12, 13].
In this study, higher levels of 25(OH)D3 were
ob-tained in the group with vitamin D supplementation. Statistically between the groups receiving vitamin D supplementation and the placebo group there was a sig- nificant difference (p = 0.00). These results were con-sistent with a randomized study in which 15 patients with T1DM got 1 year of daily oral vitamin D therapy (2000 IU), DHA (38 mg/kg) and intensive diabetes management found vitamin D levels remained stable in patients receiving supplementation but decreased in the control group [25]. Another study, 8 patients with 25(OH)D3 deficiency of 15 patients with T1DM
consec-utively received vitamin D3 supplementation for up to
achieved and persist after one year of treatment [26]. Study of T1DM patients in Boston was randomized and divided into 4 groups with each group given placebo, vitamin D3 1,000, 2,000, or 4,000 IU for 3 months.
Higher levels of vitamin D increased after 3 months with the highest levels in the group receiving vitamin D3 4000
IU [27]. A cross-sectional study of 141 T1DM patients and given 1000 IU/day cholecalciferol as supplementa-tion. There was a significant difference in levels of 25(OH)D3 between subjects with control and found to
be a significant increase in levels of 25(OH)D3 [28].
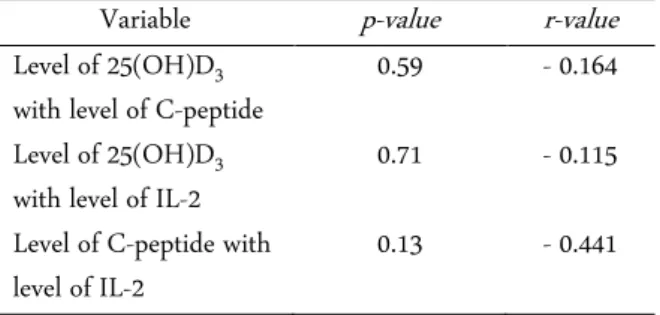
Correlations among levels of 25(OH)D3. IL-2, and
C-peptide in the group receiving vitamin D supplementa-tion
Based on Spearman correlation test, it was found that levels of 25(OH)D3 with C-peptide levels,
25(OH)D3 levels with IL-2 levels, and C-peptide levels
with IL-2 levels were all not significantly correlated (p = 0.59; p = 0.71; p = 0.13). It can be concluded that there is no significant relationship between these three varia-bles (Table 3).
In this study we found lower levels of C-peptide in the group with vitamin D supplementation, although the absolute level of decreased C-peptide was slower in the group receiving supplementation than those receiv-ing placebo. Cumulative incidence of progression to un-detectable levels of C-peptide reached 38.5% in the gro-up receiving vitamin D sgro-upplementation and 69.2% in the placebo group. Statistically no significant differences in C-peptide levels were obtained between groups ceiving vitamin D supplementation with the group re-ceiving placebo (p = 0.26). This is consistent with studies conducting a case-control intervention study in 30 chil-dren with T1DM. After administering oral doses of cho-lecalciferol 2000 IU/day for 6 months, the decreased ten-dency was lower than the β-cell function seen. The
per-centage reduction of C-peptide was also lower in the in-tervention group compared with the control group. Three (20%) patients in the control group progressed to an undetectable C-peptide during the study period com-pared to 1 (6%) in the intervention group [29]. In an-other study 38 patients with T1DM were randomly as-signed either daily oral therapy of cholecalciferol 2000 IU, or placebo. The cumulative incidence of progression to undetectable fasting C-peptide level reached 18.7% in the cholecalciferol group and 62.5% in the placebo group. Therefore, cholecalciferol is safely used as an ad-junctive therapy with insulin and is associated with pro-tective immunological effects and a slow decline in the
function of residual β -cells in patients with T1DM [30].
A study of patients aged 18 – 39 years in Germany who
was newly diagnosed with T1DM who received 0.25 µg
1.25(OH)2D3 or placebo daily for 9 months and followed
for a total of 18 months. The results obtained no differ-ences in the area under curve (AUC) peptide, peak C-peptide, and fast C-peptide between the treated group and placebo [31]. In another study, 34 patients were newly diagnosed with T1DM in a double-blind trial with
calcitriol 0.25 µg/day or placebo and followed for 2 years. The levels of C-peptide fell significantly, but in both groups had similar levels, with no significant dif-ference [32].
Different results were obtained in studies in China, where plasma C-peptide, fasting C-peptide (FCP) and postprandial C-peptide (PCP) levels, remained stable in the insulin-assisted group plus 1-alpha(OH)D3, while
FCP levels decreased in the insulin-only group during the 12-month intervention. Seventy percent of patients treated with 1-alpha(OH)D3 of their FCP
concentra-tions persisted or increased after 1 year of treatment, while only 22% of the patients treated with insulin alone had stable FCP levels. Further analysis with different time periods of diabetes showed that better beta-cell beta functions were maintained (reflected significantly higher FCP and PCP levels) in the group receiving 1-al-pha(OH)D3 therapy plus Insulin [33]. Research in Iran,
where the intervention group received alfacalcidol 0.25
µg twice daily, while the control group received placebo. There was a higher FCP result and lower daily insulin dosage per body weight (DID) in the intervention group, with males having a stronger response to alfacal-cidol. No side effects were observed [34]. Another study, 8 patients with 25(OH)D3 deficiency, of 15 patients with
T1DM consecutively received vitamin D3
supplementa-tion for up to one year. Target levels of 25(OH)D3 in
blood were achieved and persisted after one year of treat-
Table 3. Results of correlation between levels of 25(OH)D3. IL-2, and C-peptide in the group receiving vitamin D sup-plementation
Variable p-value r-value
Level of 25(OH)D3 with level of C-peptide
0.59 - 0.164
Level of 25(OH)D3 with level of IL-2
0.71 - 0.115
Level of C-peptide with level of IL-2
ment and the C-peptide value remained stable after one year of treatment [26].
In this study, higher levels of IL-2 were found in the group receiving vitamin D supplementation. Statistically between the groups receiving vitamin D supplementa-tion and the placebo group did not differ significantly (p= 0.76). Some studies reported direct modulation of CD4 + T cells with active vitamin D, and Treg cell in-duction expressed IL-17, IL-21, IFN-γ CTLA-4 and
FoxP3 inhibition. If T cells grow in an environment rich in IL-2 and vitamin D, they express the highest levels of CTLA-4 and FoxP3, and are capable of suppressing CD4 + T cell proliferation [35,36]. But in his latest study, 1.25(OH)2D3 did not significantly affect the overall
ex-pression of FoxP3 or IL-2 but that changed the magni-tude of the cytokine effect. Nevertheless, the presence or absence of 1.25(OH)2D3 inflammatory cytokines
re-duced the effects of TGFβ on the increase of FoxP3 and
IL-2 [37].
There was no significant association between levels of 25(OH)D3 and C-peptide levels in children with
T1DM who received vitamin D supplementation, with very weak association and negative correlation (p = 0.59; r = -0.16). Research in Germany and Italy also obtained similar results [31, 32]. This is due to the duration of disease in this study subjects averaged still a decade so obtained low levels of C-peptide despite the increase of 25(OH)D3 and this indicates that the progressive
de-struction of pancreatic β cells occur mainly in the first
years of the emergence T1DM disease [38]. In addition, the onset that occurs at a young age also affects the levels of C-peptide [39]. This result is different from the stud-ies conducted in China where there was a significant positive correlation between vitamin D levels and C-peptide levels [33]. Similarly, the results of a study con-ducted in Boston showed a significant positive correla-tion between vitamin D and C-peptide levels [27].
There was no significant association between levels of 25(OH)D3 and IL-2 levels in children with T1DM
who received vitamin D supplementation, with very weak association and negative correlation (p = 0.71; r= - 0.12). Overbergh et al, showed that in NOD rats the shift between Th1 / Th2 cells also occurs in the periph-ery and is not limited to the pancreas. Furthermore, this change only occurs in immune responses with specific autoantigen (GAD65 exposure, B-chain insulin, heat shock protein 65), and not observed in the immune re-sponse associated with other antigens (ovalbumin, teta-nus toxin, and others). Vitamin 1.25(OH)2D3 clearly
causes a decrease in IL-12 and 2 tested Th1 cytokines
(IFN-γ and IL-2) after administration of GAD65.
De-creased expression of IL-12 is not surprising since 1.25(OH)2D3 can directly inhibit IL-12 transcription.
Because of the central role of IL-12 as the main stimu-lant for Th1 cytokine, decreased expression of IL-12, as expected, is accompanied by similar reductions in IFN- and IL-2 [40]. In another study of IL-2 effect mecha-nisms showed that in the absence of these cytokines, Treg cells could not survive or expand their numbers in the thymus and peripheral parts [41] and were unable to suppress T cell [42]. From these data, it can be con-cluded that IL-2 has an important and not excessive function in development, homeostasis, and Treg cell function [43]. This is not in line with studies reporting direct modulation of CD4+ T cells with active vitamin D, and Treg cell induction expressed IL-17, IL-21,
IFN-γCTLA-4 and FoxP3 inhibition. If T cells grow in an
environment rich in IL-2 and vitamin D, they express the highest levels of CTLA-4 and FoxP3, and are able to suppress CD4+ T cell proliferation [35,36].
There was no significant association between IL-2 and C-peptide levels in children with T1DM who re-ceived vitamin D supplementation, with moderate cor-relation and negative corcor-relation (p = 0.13; r = -0.44). From the research conducted by Dragovic et al., ob-tained a negative correlation after vitamin D supplemen-tation between IL-2 and C-peptide. This is indicated by a decrease in the incidence of chronic complications of T1DM and an improvement in the complications result-ing from increased C-peptide and IL-2 reduction [44]. The same thing is also shown by research in California, which is obtained a negative correlation between C-pep-tide and IL-2 [45].
Limitations in our study are limited samples just in Malang, so it is less able to describe the status of vitamin D in patients with T1DM in Indonesia. Difficult factors that may arise in this study also cannot be controlled as ideal as possible, such as low vitamin D dietary factors, sun exposure, ethnicity/race, body surface area, and drugs that may affect vitamin D status research subjects who may be contributing to the occurrence of vitamin D deficiency are not examined in this study. Other fac-tors that can affect the levels of C-peptide and IL-2. In addition, there are other factors that may affect the re-sults of research but have not been studied, among oth-ers, IL-17, IL-10, IL-12, TGF-β, IFN-γ, and VDR. It is
desirable to do further research with more homogeneous sampling by further tightening the inclusion criteria in order to obtain better and meaningful results.
CONCLUSION
From this study can be concluded that administra-tion vitamin D3 supplementation in patients with T1DM
can increase levels 25(OH)D3 significantly. This increase
has not significantly lowered levels of IL-2 and increased levels of C-peptide. However, there was an absolute de-crease in the rate of slower C-peptide in the supple-mented group than in the placebo group.
ACKNOWLEDGMENT
We are grateful to the nurses, resident doctors, all of the bio-medic and clinical pathology laboratory staff in the Department of Pediatrics, Faculty of Medicine, University of Brawijaya - RSSA Malang, who partici-pated in the management of these children and data col-lection. We also thank to Satuman, M.Si, from Faal La-boratory of Medical Faculty, Brawijaya University for good assistance in this research.
REFERENCES
1. Craig ME, Jefferies C, Dabelea D et al. (2014) Definition, epidemiology, and classification of diabetes in children and adolescents. Pediatric Diabetes 15 (20): 4 – 17. doi: 10.1111/pedi.12186.
2. Himawan IW, Pulungan AB, Tridjaja B, Batubara JRL, (2012) Gambaran diabetes melitus tipe 1 di Indonesia. Sari Pediatri 15 (6): 57 – 62. doi: 10.14238/sp13.5.2012.367-72. 3. Cahyono HA (2013) Gambaran klinis dan laboratoris
diabe-tes melitus tipe-1 pada anak. Jurnal Kedokteran Brawijaya. 26 (4): 195 – 198. doi: 10.21776/ub.jkb.2011.026.04.2. 4. Rajashree R, Ravishankar MV, Kholkute SD, Goudar SS
(2012) Type 1 diabetes mellitus: An update. International Journal of Diabetes and Metabolism 20 (3): 37 – 42. 5. Jeker LT, Bour-Jourdan H, Bluestone JA (2012) Breakdown
in peripheral tolerance in type 1 diabetes in mice and hu-mans. Cold Spring Harbor Perspectives in Medicine 12 (2): 78 – 93. doi: 10.1101/cshperspect.a007807.
6. Mathieu C, Badenhoop K (2005) Vitamin D and type 1 dia-betes mellitus: State of the art. Trends in Endocrinology and Metabolism 16 (6): 261 – 266. doi: 10.1016/j.tem.2005.06.004.
7. Craig ME, Hattersley A, Donaghue KC (2009) Definition, epidemiology and classification of diabetes in children and adolescents. Pediatric Diabetes 10 (12): 3 – 12. doi: 10.1111/j.1399-5448.2009.00568.x.
8. Hulme MA, Wasserfall CH, Atkinson MA, Brusko TM (2012) Central Role for Interleukin-2 in Type 1 Diabetes. Diabetes 61 (14): 14 – 22. doi: 10.2337/db11-1213. 9. Palmer JP, Fleming GA, Greenbaum CJ et al. (2004)
C-pep-tide is the appropriate outcome measure for type 1 diabetes
clinical trials to preserve beta-cell function: Report of an ADA workshop. Diabetes 53 (1): 250 – 264. doi: 10.2337/di-abetes.53.1.250.
10. Jones AG, Hattersley AT (2013) The Clinical Utility of C-peptide Measurement in the Care of Patients with Diabetes. Diabetic Medicine 30 (7): 803 – 817. doi: 10.1111/dme.12159.
11. Svoren BM, Volkening LK, Wood JR, Laffel LMB (2009) Significant vitamin D deficiency in youth with type 1 diabe-tes mellitus. The Journal of Pediatrics 154 (1): 132 – 134. doi: 10.1016/j.jpeds.2008.07.015.
12. Janner M, Ballinari P, Mullis PE, Fluck CE (2010) High prevalence of vitamin D deficiency in children and adoles-cent with type 1 diabetes. Swiss Medical Weekly 140 (7): 1 – 6. doi: 10.4414/smw.2010.13091.
13. Greer RM, Portelli L, Hung BS et al. (2013) Serum vitamin D levels are lower in Australian children and adolescents with type 1 diabetes than in children without diabetes. Pedi-atric Diabetes 14 (1): 31 – 41. doi: 10.1111/j.1399-5448.2012.00890.x.
14. Wulandari D, Cahyono HA, Widjajanto E, Puryatni A (2014) Low levels of vitamin D correlate with hemoglobin a1c and interleukin-10 levels in pediatric type 1 diabetes mellitus patients. Journal of Tropical Life Science 4 (3): 182 – 186. doi: 10.11594/jtls.04.03.04.
15. Chakhtoura M, Azar ST (2013) The role of vitamin D defi-ciency in the incidence, progression, and complications of type 1 diabetes mellitus. International Journal of Endocrinol-ogy 2013 (2013): 1 – 10. doi: 10.1155/2013/148673. 16. Harinarayan CV (2014) Vitamin D and diabetes mellitus.
Hormones 13 (2): 163 – 181.
17. Prietl B, Pilz S, Wolf M, Tomaschitz A et al. (2010) Vitamin D supplementation and regulatory t cells in apparently healthy subjects: Vitamin D treatment for autoimmune dis-eases?. Israel Medical Association Journal 12 (3): 136 – 139. 18. Pulungan AB, Mansyoer R, Batubara JRL, Tridjaja B (2002) Gambaran klinis dan laboratoris diabetes mellitus tipe-1 pada anak saat pertama kali datang ke bagian IKA-RSCM Jakarta. Sari Pediatri 4 (1): 26 – 30. doi: 10.14238/sp4.1.2002.26-30.
19. Endyarni B, Batubara JRL, Boediman I (2006) Effects of a structured educational intervention on metabolic control of type-1 diabetes mellitus patients. Paediatrica Indonesia 46 (11 – 12): 260 – 265. doi: 10.14238/pi46.6.2006.260-5. 20. da Costa VM, de Carvalho Padilha P, de Lima GCF et al.
21. Hassanein MA, Sultan I (2014) Evaluation of nutrition and health status among children with diabetes. Life Science Journal 11 (2): 327 – 334.
22. Pulungan AB (2010) Pubertas dan gangguannya. In: Batu-bara JRL, Tridjaja B, Pulungan AB, eds. Buku ajar en-dokrinologi anak. Jakarta, Sagung Seto. pp 85 – 120. 23. Tfayli H, Arslanian S (2007) The challenge of adolescence:
hormonal changes and sensitivity to insulin. Diabetes Voice 52 (Special Issue): 28 – 30.
24. Himawan IW, Pulungan AB, Tridjaja B, Batubara JRL (2009) Komplikasi jangka panjang dan jangka pendek dia-betes melitus tipe 1. Sari Pediatri 10 (6): 367 – 372. doi: 10.14238/sp10.6.2009.367-72.
25. Haller MJ, Wasserfall CH, Hulme MA et al. (2013) Autolo-gous umbilical cord blood infusion followed by oral do-cosahexaenoic acid and vitamin d supplementation for C-peptide preservation in children with type 1 diabetes. Biol-ogy of Blood and Marrow Transplantation 19 (7): 1124 – 1135. doi: 10.1016/j.bbmt.2013.04.011.
26. Federico G, Focosi D, Marchi B et al. (2014) Administering 25-hydroxyvitamin D3 in vitamin D-deficient young type 1A diabetic patients reduces reactivity against islet autoantigens. Clinical Nutrition 33 (6): 1153 – 1156. doi: 10.1016/j.clnu.2014.01.001.
27. Chandler PD, Giovannucci EL, Scott JB et al. (2014) Effects of vitamin D supplementation on C-peptide and 25-hy-droxyvitamin D concentrations at 3 and 6 months. Scientific Reports 5 (10411): 1 – 10. doi: 10.1038/srep10411. 28. Savastio S, Cadario F, Genoni G et al. (2016) Vitamin D
deficiency and glycemic status in children and adolescents with type 1 diabetes mellitus. PLoS ONE 11 (9): e0162554. 10.1371/journal.pone.0162554.
29. Dayal D, Sachdeva N (2015) Preservation of residual beta cell function with vitamin D supplementation in type 1 dia-betes. Immunoendocrinology 2 (2015): e1093. doi: 10.14800/ie.1093
30. Gabbay MAL, Sato MN, Finazzo C et al. (2012) Effect of cholecalciferol as adjunctive therapy with insulin on protec-tive immunologic profile and decline of residual β-cell func-tion in new-onset type 1 diabetes mellitus. Archives of Pedi-atrics and Adolescent Medicine 166 (7): 601 – 607. doi:10.1001/archpediatrics.2012.164.
31. Walter M, Kaupper T, Adler K et al. (2010) No effect of the 1 alpha, 25-dihydroxyvitamin d3 on beta cell residual func-tion and insulin requirement in adults with new onset type 1 diabetes. Diabetes Care 33 (7): 1443 – 1448. doi: 10.2337/dc09-2297.
32. Bizzarri C, Pitocco D, Napoli N et al. (2010) No protective effect of calcitriol on β-cell function in recent-onset type 1
diabetes. Diabetes Care 33 (9): 1962 – 1963. doi: 10.2337/dc10-0814.
33. Li X, Liao L, Yan X et al. (2009) Protective effects of 1-alpha-hydroxyvitamin d3 on residual beta-cell function in patients with Adult-onset Latent Autoimmune Diabetes (LADA). Di-abetes/Metabolism Research and Reviews 25 (5): 411 – 416. doi: 10.1002/dmrr.977.
34. Ataie-Jafari A, Loke SC, Rahmat AB et al. (2013) A random-ized placebo-controlled trial of alphacalcidol on the preser-vation of beta cell function in children with recent onset type 1 diabetes. Clinical Nutrition 32 (6): 911 – 917. doi: 10.1016/j.clnu.2013.01.012.
35. Chen S, Sims GP, Chen XX et al. (2007) Modulatory effects of 1,25-dihydroxyvitamin D3 on human D cell differentia-tion. The Journal of Immunology 179 (7): 1634 – 1647. doi: 10.4049/jimmunol.179.3.1634.
36. Jeffery LE, Burke F, Mura M et al. (2009) 1,25-dihydroxyvit-amin D3 and interleukin-2 combine to inhibit t cell produc-tion of inflammatory cytokines and promote development of regulatory T cells expressing CTLA-4 and FoxP3. The Jour-nal of Immunology 183 (9): 5458 – 5467. doi: 10.4049/jim-munol.0803217.
37. Jeffery LE, Qureshi OS, Gardner D et al. (2015) Vitamin D antagonises the suppressive effect of inflammatory cytokines on CTLA-4 expression and regulatory function. PLoS ONE 10 (7): 1 – 18. doi: 10.1371/journal.pone.0131539. 38. Almeida MH, Dantas JR, Barone B et al. (2013) Residual
C-peptide in patients with type 1 diabetes and multiethnic backgrounds. Clinics 68 (1): 123 – 126. doi: 10.6061/clin-ics/2013(01)RC02.
39. Wang L, Lovejoy NF, Faustman DL (2012) Persistence of prolonged C-peptide production in type 1 diabetes as meas-ured with an ultrasensitive C-peptide assay. Diabetes Care 35 (3): 465 – 470. doi: 10.2337/dc11-1236.
40. Overbergh L, Decallonne B, Waer M et al. (2000) 1alpha,25- dihydroxyvitamin D3 induces an autoantigenspecific T-helper 1/T-T-helper 2 immune shift in NOD mice immunized with GAD65. Diabetes 49 (24): 1301 – 1307. doi: 10.2337/di-abetes.49.8.1301.
41. Setoguchi R, Hori S, Takahashi T, Sakaguchi S (2005) Ho-meostatic maintenance of natural Foxp3+ CD25+ CD4+ reg-ulatory T cells by interleukin (IL)-2 and induction of auto-immune disease by IL-2 neutralization. The Journal of Ex-perimental Medicine 201 (5): 723 – 735. doi: 10.1084/jem.20041982.
43. Malek TR, Bayer AL (2004) Tolerance, not immunity, cru-cially depends on IL-2. Nature Reviews Immunology 4: 665 – 674. doi:10.1038/nri1435.
44. Dragović T, Raden S, Djurović B, Rabrenović V (2016) Ex-traskeletal activity of vitamin D and a potential association
with diabetes mellitus. Vojnosanitetski Pregled 74 (5): 476 – 482. doi: 10.2298/VSP151011114D.