Volume III (2014), Page 111- 126
EVALUATING THE EFFECTS OF ROAD GEOMETRICAL DESIGN TOWARDS SPOT SPEED DISTRIBUTION ON ARTERIAL ROAD
Noor Hafiza Mohd Maksid1 and Abdul Azeez Kadar Hamsa2 1&2
Kulliyyah of Architecture and Environmental Design
INTERNATIONAL ISLAMIC UNIVERSITY MALAYSIA
Abstract
Drivers travel at speeds they judge to be comfortably achievable in relation to the prevailing conditions and road geometrical design. The relationship between road geometrical design and speed of vehicles traveling in is very prominent. Speeds vary according to the perception of constraint imparted to the drivers by the road geometrical design. In a broader sense, these two factors are often interrelated with speed limits and road safety. The purpose of this study is to investigate how road geometrical design could influence the speed of vehicles on arterial road. Two roads with different geometric design were compared: arterial road with straight stretch and arterial road with curved stretch. The study was carried out by analyzing the speed characteristics between these two road stretches and it was discovered that vehicles traveling on straight road stretch tend to travel at higher speed than curved road stretch. The difference in the mean speed of the straight road and the curved road was tested for statistical significance by using t-test. The results show that there exists difference in the mean speed of the vehicles traveling at straight and curved road stretches. It was also found that the existing speed limit of the selected road stretches is lower than the 85th percentile speed. The 85th percentile speed is a commonly used measure to decide speed limit on a road. The vehicles were traveling at higher speed along straight stretch of road than curved road stretch. Few recommendations on strengthening the enforcement and improving speed reduction measures are drawn to discourage drivers driving at high speed to make roads free from accidents.
1
Undergraduate Student at Department of Urban and Regional Planning, KAED, IIUM, Malaysia. Email: [email protected]
2
Associate Professor at Department of Urban and Regional Planning, KAED, IIUM, Malaysia. Email: [email protected]
INTRODUCTION
Speed is an important measure to evaluate safety of the road network. Speed is also an important transportation parameter because other than safety, it relates to time, comfort, convenience, and economics. According to Currin (2001), high speed carries high risk, whereas low speed is relatively safe. Traveling at a speed more than the speed limit is not recommended, as it could cause the drivers to lose control of their vehicles and cause fatalities, especially at winding roads. In Malaysia, accidents on roads are linked with the problem of inconsistencies in the operating speed. Driving at above the speed limit, uncertain weather conditions and drowsiness of the drivers are the three main causes of fatal accidents during the festive seasons (The Sun, 2009). A number of issues may be relevant with respect to the road safety aspect of a development proposal and in particular speed of vehicles. A study by Moore et.al., 1995 has documented an extraordinary strong association between speed and road traffic crash risk, the odds ratio for speed in excess of 84 km/hour is being almost 40 times higher than that for speeds below 60 km/hour (Petridou and Moustaki, 2000). A number of research has shown that the safest groups are the vehicles travelling at or below the 85th to 90th percentile speeds. A research by Elvik, et.al., 2004, has found that there is a very strong statistical relationship between speed and road safety and it is difficult to think of any other risk factor that has a more powerful impact on accidents or injuries than speed. The statistical relationship between speed and road safety is very consistent as when speed goes down, the number of accidents or injured road users also goes down in 95% of the cases. When speed goes up, the number of accidents or injured road users goes up in 71% of the cases (Elvik, et.al., 2004).
26,292 road accidents were occurred on curved roads accounting for about 10% of the total accidents in 2008. Additionally, 9,070 people were died and 36,112 people were severely injured in these accidents. The main cause of these accidents, again, is due to excessive vehicle speed (Chen et.al.). In a simple sense, these kinds of accidents were happened at road curves because of inappropriate speed of vehicles, traveling at a speed higher than the speed limit along that particular road. However, the inappropriate-speed theory can be applied to straight road as well, where drivers have the tendency to press the accelerator and generally increase the speed because of a greater feeling of well-being and sense of familiarity of the road, consequently increasing the accident risk. A survey conducted by Collins (2008) has identified, drivers, on average, would drive faster on a straight open road, followed by a straight road in bad weather, a bendy open road, a bendy road in bad weather, a straight road in the dark and, finally, a closed bendy road. Nonetheless, it is also shown that speed limits, if suitably selected, can help to reduce the speeds thus reducing the accident rates (Hobbs and Richardson, 1967).
In a nutshell, it is evident that there is a clear relationship between changes in speed and changes in road safety: the larger the change in speed, the larger the impact on accidents or accident victims. In relation to this statement, it can be seen that road geometrical design also has some influences towards the speed of vehicles, thus explaining about the close relationship between road geometrical design, speed, and road safety. This paper focuses on the relationship between speed of vehicles and road geometrical design, and explains how different road geometrical design can influence the speed of vehicles. This paper describes the measurement of speed characteristics of the vehicles at a specified location under free-flow traffic conditions prevailing at the time of the study.
LITERATURE REVIEW Spot Speed
In moving traffic stream, each vehicle travels at a different speed. Thus, the traffic does not have a single characteristic value, but rather a distribution of individual speeds. Speed is generally qualified according to three main types: i) Spot speed, ii) Running speed, and iii) Journey speed.
specified location under the traffic and environmental conditions prevailing at the time of the study. According to Khanna (2001), spot speeds are affected by physical features of the road for example pavement width, curve, sight distance, gradient, pavement unevenness intersections, and roadside developments. Other factors that could influence spot speeds are environmental conditions (like weather, visibility), enforcement, traffic conditions, driver, vehicle, and motive of travel.
The above statement is supported by Hobbs (1967), where he wrote that measurements of spot speeds show a wide distribution and many interacting circumstances serve to determine the particular speed which individual drivers adopt. These circumstances will include those peculiar to the driver himself (such as his psychological and physiological traits); those concerned with his immediate environment and those affected by the more remote environmental considerations of law enforcement, type of district, and public opinions. Mohamed (1993), Khanna (2001), and Hobbs (1967) further explained the main elements of immediate environment are type of vehicle, road alignment, cross section and surface, weather, speed limits, and volume. As we can see, there are several elements that are repeated, which shows that the authors have agreed on the common elements that could influence spot speed.
Mohamed (1993) and Garber (2001) have cited that spot speed data can be used for certain purposes. It includes, but not limited to:
h. Establishment of parameters for traffic operation and control and determination of existing roadway speeds, such as speed zones, speed limits (85th percentile speed is commonly used as the speed limit on a road), passing restrictions, and prioritisation of speed enforcement locations;
i. evaluate the effectiveness of speed enforcement programs such as use of different speed limits for passenger cars and trucks;
j. evaluate, identify or determine the adequacy and speed impact of roadway geometric characteristics, including horizontal and vertical alignment and general roadway features;
k. identify whether the roadway is in need of greater law, enforcement, or reconstruction;
l. determine speed trends and impact of traffic control devices (traffic signs, pavement markings, signals etc.);
m. evaluate the effects of speed on highway safety through the analysis of crash data for different speed characteristics; and
In conducting the spot speed study, the suitable place and time for conducting this study are the important elements to be considered. According to Mohamed (1993), before placing the equipment and enumerators, researchers should search for a suitable site to conduct the study. Based on the objectives of the study, among the sites that are often selected as study site are highway or road that is straight, even and wide; road segment that is located between two junctions in urban area; road accident site or area where signboard is proposed. In terms of the suitable time to conduct the spot speed study, Mohamed (1993) has suggested the time between 9.00 a.m. to 12.00 noon; 3.00 p.m. to 6.00 p.m.; and 8.00 p.m. to 10.00 p.m.; study duration of one hour and; at least 50 vehicles as samples.
Road Geometrical Design
Ashley (1994) and Khanna (2001) stated that the required geometric design of highway depends on the speeds that vehicles are traveling. The speeds that are anticipated on the road are generally the basis for planning appropriate road alignment. Therefore, during the design stage, appropriate speed along the highways shall be determined in advance. However, Hong and Oguchi (2005) provided a contrast view stating that speed of traveling vehicles is dependent upon the geometric design of the highways. These statements highlight that both road geometrical design and speed of the vehicles have symbiosis relationship – i.e., both dependent upon each other. Ashley (1994) also stated that the geometric design parameters of horizontal alignment such as bends and straights should fit the functions of road. It was considered that straight roads are the safest and most beneficial of all but subsequently the opinion has shifted towards horizontal curvature can be beneficial as well, provided it is designed appropriately. An example of this is the introduction of bends in highway to reduce speeds, as long straight stretches of road may encourage undesirably high speeds whilst also contributing to loss of concentrations due to monotonous alignment.
lower 15 percent are considered to be traveling unreasonably slow and those observed above the 85th percentile value are assumed to be exceeding a safe and reasonable speed (Texas Department of Transportation, 2012).
In this regard, road geometry shall be designed to suit the needs of it, and speed is one of the main elements that must be taken into consideration as road geometry and its design influence speed. Currin (2001), Ashley (1994) and Hobbs (1967) agreed that speeds may vary, but it depends on several factors that might affect it such as:
e. general variables – time, date, weather conditions, highway classification, lighting conditions etc.
f. road users – drivers, journey purpose, travel mode etc.
g. vehicles – type, make, year, vehicle conditions, external and internal features etc.
h. road environment – traffic control, traffic conditions, road design features, road surface, adjacent land use, special consideration etc.
On the subject of traffic lane, both Bateman (1948) and Khanna (2001) agreed that the minimum width of traffic depends upon the width of the motor vehicles and lateral clearance between passing vehicles which is considered safe. Mannering (2005) also mentioned that when lanes are narrower, adjustment is needed because narrow lanes and obstructions close to the travel lane could cause the traffic to slow as a result of reduced psychological comfort and limits on driver maneuvering and accident avoidance options.
Highway Functional Classification
e. Limited-access facilities
f. Arterials – principal arterials and minor arterials g. Collectors – major collectors and minor collectors h. Local roads and streets
For this study, only literatures related to arterial system are focused in this section. Arterials are the surface facilities that are designed primarily for through movement but permit some access to abutting land (Roess, Prassas. and McShane, 2004). One of the most significant characteristics of arterial roads is vehicles traveling at a speed 80 to 90 km/h. As listed by Garber (2001), arterials can be divided into two: major or principal arterials and minor arterials. The principal and minor arterials then can be divided into two more categories namely – for principal: urban principal arterial system and rural principal arterial system, and for minor, urban minor arterial system and rural minor arterial system (Garber, 2001). Urban principal arterial system is the system of highways serves the majority activity centers of the urban areas and consist mainly the highest-traffic-volume corridors. On the other hand, the rural principal arterial system consists of a network of highways that serves substantial number of interstate trips. Virtually all highway trips between urbanized areas and a high percentage of the trips between small urban areas are made on this system.
The urban minor arterial system includes streets and highways that are interconnect with and augment the urban primary arterials. This system serves trips of moderate length and places more emphasis on land access than the primary arterial system. As for the rural minor arterial system, Garber (2001) stated that this system of road boosts the principal arterial system in the formation of a network of roads that connects cities, large towns, and other traffic generators, such as large resorts. Travel speeds on these roads are normally higher than principal arterial system.
OBJECTIVES AND RESEARCH METHODOLOGY
Objectives
The following are the objectives of this study:
v. To identify existing road geometrical design elements of straight and curved arterial road segments.
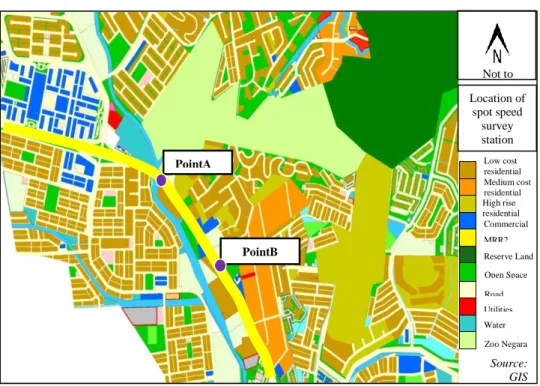
PointB PointA
Location of spot speed
survey station
Source: GIS Selangor
Low cost residential Medium cost residential High rise residential Commercial MRR2 Reserve Land Open Space Road Utilities Water Body Zoo Negara
Not to scale vii. To compare spot speed of traffic stream at the selected road
stretches.
viii. To suggest measures in achieving stipulated speed limit by the road users.
Background of Study Area
The study area is a stretch of an arterial road namely KL Middle Ring Road (MRR2). MRR2 is a ring road that was built by Public Works Department to link neighborhood areas around Wilayah Persekutuan Kuala Lumpur-Selangor border. The spot speed survey station was located at two points as indicated by point A and Point B in figure 1. Point A is located at the curvature stretch of the road near Zoo Negara, and point B at the straight stretch of the road near a Petronas Petrol Station. Both points have the same road characteristics having three lanes in each direction measuring 3.5 m lane width and 10.5 m total width. The stretches of the selected road were dual carriageway and the road surface was asphaltic concrete.
Sample Size and Sampling Method
The geometric design elements covered in this study include the horizontal curve, width of the road, and available lanes. Besides, the other physical aspects such as the width of road median, width of road shoulder, and road surface were also considered. On the other hand, the spot speed survey was conducted on 100 vehicles (which is the selected sample size) passing at a point at each of the straight and curved road.
Systematic sampling method was applied to ensure that the samples were appropriately selected to represent the population. Only passenger cars were selected as the target vehicle because they represent the predominate mode of transportation along the selected road and other roads. The systematic sampling method was applied by selecting the first vehicle randomly and then every 5th vehicle until the total sample size was reached. On average, the traffic volume on MRR2 was 180,000 to 200,000 vehicles per day (Ministry of Works, 2011). Data was collected during off-peak hour to measure the actual speed of vehicles during free-flow traffic.
Method of Data Collection
Data on roadway geometry such as horizontal curve, available lanes of the selected arterial road and road surface was observed. Pictures were taken to represent data on these elements by using a camera. Furthermore, the width of the road and its shoulder were measured using a laser distance meter device and a measuring tape. To measure spot speed, two points on the arterial road, one at the straight stretch and another at the curvature stretch were selected. In order to collect the data on spot speed, the enumerators have placed a radar gun at an appropriate location at the road side at a distance of minimum 10 meter from the selected vehicles. The radar gun was targeted at each selected vehicle to measure the spot speed of the vehicles.
Method of Data Analysis
RESEARCH FINDINGS
Road Geometrical Design Analysis
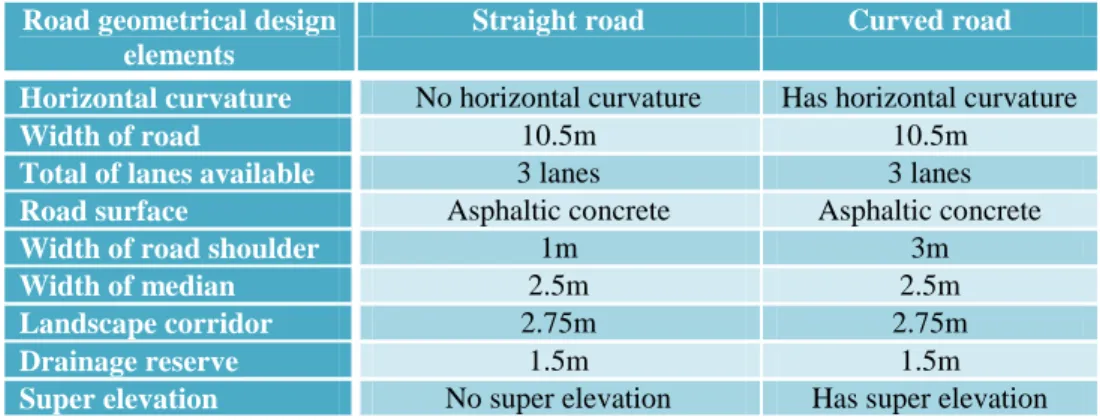
The road geometrical designs such as width and number of lanes were similar at the both selected road stretches. The width of the road is 10.5 meter with three lanes each direction, each measuring 3.5 meter wide. The width of this road is identical with that of the guideline requirements of an arterial road width (Ministry of Works, 2011).
For straight road, the width of each traffic lane is even. The road shoulder at the extreme left of the road is measured as 1 meter wide. The width of landscape and drainage reserve is 2.75 meter and 1.5 meter respectively (table 1). The median width of this road is 2.5 meter.
Similarly, the width of the curved road is also even for each of the three traffic lanes. The median is 2.5 meter wide. The width of landscape and drainage reserve is also 2.75 meter and 1.5 meter respectively. However, this road stretch has wider shoulder at approximately 3 meter. The normal, usable shoulder width that should be provided along arterial road is 3 meter (Ministry of Works, 2011).
Although both road stretches have no grades or vertical curvature, road with curvature, however, has super elevation. According to Ministry of Works, the maximum super elevation ratio that should be allowed for urban roads is 0.06. Generally, the main differences between the two road stretches are horizontal curvature, width of shoulder and super elevation (table 1). Other than that, the road stretches are similar in terms of road geometrical design.
Table 1: Road geometrical design elements at straight and curved arterial road
Road geometrical design elements
Straight road Curved road
Horizontal curvature No horizontal curvature Has horizontal curvature
Width of road 10.5m 10.5m
Total of lanes available 3 lanes 3 lanes
Road surface Asphaltic concrete Asphaltic concrete
Width of road shoulder 1m 3m
Width of median 2.5m 2.5m
Landscape corridor 2.75m 2.75m
Drainage reserve 1.5m 1.5m
Spot Speed Analysis
The spot speed was measured at two different points, one at straight stretch and another at curved stretch, along Middle Ring Road 2 (MRR2). The sample size at each point of the road stretch is 100. The modal speed at straight road was 68 – 74 km/h, but at curved stretch it was 76.5 - 82.5 km/h. The mean spot speed at straight road was 83.47 km/h and at the curved road stretch, it was 73.92 km/h. The difference in mean speed between the two roads is 9.55 km/h (table 2). It shows that drivers were driving at higher speed at straight road stretch than curved road.
Table 2: Spot speed characteristics at straight and curved road stretches
Type of road Straight road Curved road
No. of sample 100 100
Mean speed 83.47 km/h 73.94 km/h
Modal speed 71 km/h 79.5 km/h
Median speed 82.2 km/h 74.5 km/h
Standard Deviation 12.87 km/h 12.10 km/h
15th percentile 69.1 km/h 60.4 km/h
85th percentile 96.2 km/h 85.4 km/h
The median or 50th percentile speed at straight road stretch was 82.2 km/h and that of curved road stretch, it was 74.5 km/h (table 2). It indicates that half of the cars were travelled at a speed of 82 km/h and below at straight road stretch and 74.5 km/h at curved road stretch.
The standard deviation speed at straight road stretch was 12.87 km/h and 12.10 km/h at curved road stretch. Percentiles can be used to indicate the position of an individual speed in a group of vehicles. It is mentioned in the literature that the vehicles observed in the lower 15 per cent are considered to be traveling unreasonably slow and those observed above the 85th percentile value are assumed to be exceeding a safe and reasonable speed. So, it is necessary to identify 15th percentile, 50th percentile, and 85th percentile at straight and curved road. The results of the percentile speed were calculated by using Minitab software.
causing interferences within the traffic stream. So, the design speed for arterial road with straight stretch at the selected area at MRR2 shall be limited to 96 km/h and vehicles should travel at least 69 km/h to allow smooth traffic stream. Figure 3, on the other hand, shows the results for arterial road with curvature where the 15th percentile speed was 60.4 km/h and the 85th percentile speed was 85.4 km/h. For arterial road with curvature, a speed limit of 85 km/h should be imposed and vehicles should travel more than 60 km/h so that they would not cause interferences to the traffic stream.
From the overall results, it is obvious that every single value of speed that was calculated for both road stretches are different from each other. The speed characteristics at straight road stretch were higher than curved road stretch except for the modal speed. Looking at the speed characteristics at the two road stretches, it is obvious that the vehicles at straight road were traveling at higher speed than curved road.
4.2.1 Testing the difference between the mean spot speed at straight and curved road
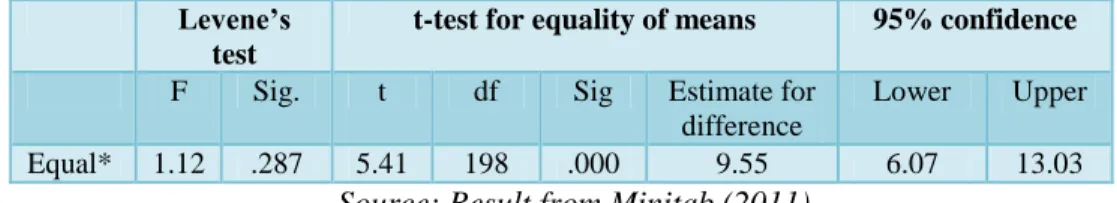
Two-sample t-test was used to determine whether there exists any significant difference between the mean of two independent samples statistically. The results would explain whether there exists any difference in spot speed between straight and curved arterial road stretch. Prior to t-test, Lavene‘s test was carried out to verify whether the variance of the variables is equal or not. The results show that F-value is 1.12 and the significance value (0.287) is greater than the critical value 0.05. So, it is safe to conclude that the variances for each group are equal. The t-test was conducted by using Minitab. Samples, mean, and standard deviation were filled in into Minitab prior to the calculation of the t-test. Table 3 shows the results of the t-test.
Figure 3: Cumulative frequency graph with 15th, 50th and 85th percentiles (for arterial road with curvature) Figure 2 : Cumulative frequency
Table 3: Result of t-test from Minitab
Levene’s test
t-test for equality of means 95% confidence
F Sig. t df Sig Estimate for
difference
Lower Upper
Equal* 1.12 .287 5.41 198 .000 9.55 6.07 13.03
Source: Result from Minitab (2011)
* Equal variances assumed
Table 3 shows that at 95% confidence interval, the sample mean is 6.07 and 13.03, which means it is 95% confident that the mean difference between straight road and curved road would fall between 6.08 (lower limit) and 13.03 (upper limit).
The t-test results show that the p-value is less than the 0.05 (in this case it is 0.00). It shows that there exists statistical significance difference in the mean speed between straight and curved road stretches. In other words, the speed of the vehicles at straight and curved road stretches is not equal. The differences in the mean speed of the vehicles at these two stretches were statistically significant. It can be concluded that the curved roads are an effective measure in reducing the speed of the vehicles. However, the extent to which the vehicles can reduce speed is actually depends on the design of the curved road segments.
DISCUSSION AND RECOMMENDATIONS
85th percentile speed of the straight road at MRR2 was 96 km/h, whereas at curved road it was 85km/h. As 85th percentile speed is used to impose speed limit because it is assumed to be the highest safe speed for roadway section, so current speed limit (80 km/h) at MRR2 is considered low. The theory behind this is that drivers usually travel at speed that is reasonable and prudent for a given roadway segment, and they also usually careful about the speed limit. So, 85th percentile could be a guideline in setting up the speed limit as this speed is considered safe and reasonable under ideal conditions of the road. In line with this context, the results of this study are considered valid because as a vehicle approaches a curve, it is expected that the drivers, obviously, reduce the speed of their vehicles to an appropriate speed to safely negotiate the curve (Melendy, 2008).
CONCLUSIONS
Speed is one of the traffic operational elements that should be considered in the design of the road geometrics. The safe allowable speed limit will make vehicles to travel in an orderly and safe manner. It is noticeable, however, the number of accidents especially along the major roads increases over the years because of vehicles traveling at higher than the posted speed limit. This study analyses the effect of road geometrical design in combating the speed of the vehicles especially along arterial road. Two different road alignments, one representing straight road path and other curved road stretch were selected. The road geometrical elements and spot speed was measured at each of the selected road stretches.
REFERENCES
Ashley, C. (1994) Traffic and Highway Engineering for Developments. 1st Edition, Oxford, UK: Blackwell Scientific Publications, Bartlett School of Planning. Bateman, John Henry (1948) Introduction to highway engineering: a textbook for
students of civil engineering. New York: J. Wiley & Sons.
Chen, et.al. Integrated safety speed model for curved roads, F2010-SC-0-25, Retrieved from http://www.fisita.com/education/congress/sc10/fisitasco25.pdf
Currin, Thomas R. (2001) Introduction to traffic engineering: a manual for data collection and analysis, Pacific Grove, Calif.: Brooks/Cole.
Eleni Petridou and Maria Moustaki (2000) Human factors in the causation of road traffic crashes, European Journal of Epidemiology, 16: 819-826.
Emma Collins (2008) Rural road safety – a question of speed?, Transport Research Institute, Napier University.
Garber, Nicholas J. (2001) Traffic and highway engineering, Pacific Grove, CA: Brooks/Cole Pub. Co., 1st Edition.
Herrstedt L and Griebe P (2001) Safer signing and marking of horizontal curves on rural roads, Traffic Engineering and Control, March 2001 pp 82-87, London. Hobbs, F. D. (1967) Traffic engineering, Oxford: New York Pergamon Press. Khanna, S.K (2001) Highway engineering, 8th edition, Roorkee; Nem Chand & Bros. Mannering, F. L. (2005) Principles of highway engineering and traffic analysis, 3rd
edition, Hoboken, NJ: Wiley.
Melendy, L. (2008) Signs for curves and turns, Retrieved from www.techtransfer.berkeley.edu/newsletter/08-2/signs-for-curves-and-turns.php Ministry of Works, A guide on geometric design of roads, Road Department Division,
Public Works Department Malaysia, 2011.
Ministry of Transportation of P.R. China ―Statistical yearbook on road traffic accidents of China (2008)‖, Ministry of Transportation of P.R. China, Beijing, April 2009.
Mohamed, D. (1993) Pengenalan tinjauan dan analisis lalulintas, Kuala Lumpur: Dewan Bahasa dan Pustaka.
Moore VM, Dolinis J, Woodward AJ (1995) Vehicle speed and risk of a severe crash, Epidemiology, 6: 258-262.
Roess R., Prassas E., and McShane W. (2004) Traffic Engineering, Prentice Hall, Englewood Cliffs, N.J., 3rd. Edition.
Rune Elvik, Peter Christensen, Astrid Amundsen (2004) Speed and road accidents: an evaluation of the Power Model, TOI Report 740/2004, Oslo.
Sung-Joon Hong and Takashi Oguchi (2005) Evaluation of highway geometric design and analysis of actual operating speed, Journal of the Eastern Asia Society for Transportation Studies, Vol. 6, pp. 1048-1061.