J.Sed.Soc.Japan.No.48,85-93,1998
Two point-counting methods for modal analyses of
Holocene sands: their comparison and evaluation
Mayumi Nirasawa*, Yoko Minato* and Koji Yagishita*
Two-different point-counting methods of thin-sectioned sands have been argued in evaluat-ing their grain size effects and aims. The traditional method that reflects the dependence of modal composition on grain-size quite differs from the Gazzi-Dickinson method that shows the total independence of grain-size in thin-section analyses. Sets of goals by the two meth-ods do not seem to be the same; the traditional method aims to demonstrate the effect of depositional environments, climates and diagenesis of sediments, whereas the primary target of the Gazzi- Dickinson method is mainly to clarify tectonic settings in provenances.
In an attempt to avoid some confusions raised by the two different point-counting methods , we reveal that there will be no significant difference of petrographic data between two meth-ods if we restrict the sand or sandstone samples less than 2.0 phi of mean diameter.
Key words: modal analyses, Gazzi-Dickinson method, traditional method, grain size, thin-section
INTRODUCTION
It has been well known that there are two methods of point-counting in determing detrital modes of sand and sandstone thin-sections
(Ingersoll et al., 1984) . One is the so-called tradi-tional method in which polymineralic coarsely crystalline grains are counted as rock (lithic) fragments. The other is known as the Gazzi-Dickinson method in which the assignment of a crystal or a grain (under the cross-hair) within a larger lithic fragment to the category of the crystal or grain, but not to the category of the larger rock fragment. The former method has
been used and developed by many workers.
Particularly, one of them is the school of Indiana University, and the students supervised by Lee J. Suttner understand well that there is a
funda-mental dependence of modal composition on
grain size (Suttner, 1974; Basu, 1976, Mack, Received : June 12, 1998, Accepted : August 17, 1998 *Department of Geology
, Faculty of Education, Iwate University, Morioka, Iwate 020-8550, Japan
1978) . Believers of the latter method are the stu-dents of William R. Dickinson, who developed his
counting method at Department of Geology,
Stanford University. The students of his school maintain that modal composition can be
demon-strated independently of grain size ( e.g.,
Dickinson, 1970, Graham et al., 1976; Dickinson and Suczek,1979; Ingersoll et al.,1984) .
In this short paper we attempt to evaluate how much grain size can affect on the modes of
Holocene sand composition in QFL diagrams.
We compare the modes of composition in testify-ing both the traditional and Gazzi-Dickinson methods in terms of grain-size parameter. To investigate the subject, we use weathered granitic rocks of so-called "masa" that deposited on relatively short-running river beds.
EXPLANATION FOR TWO DIFFERENT COUNTING METHODS
AND SAMPLING PROCEDURE
recog-Fig.1 Example of a plutonic rock (lithic) frag-ment seen in a thin-section made of very coarse-grained sand. The grain is counted as a plutonic rock fragment by the traditional method, but it should be counted as a mono-crystalline quartz grain by the Gazzi-Dickinson method. Bio: biotite, Qz: Quartz and P1; plagio-clase.
nize individual detrital grains as quartz, plagio-clase or lithic fragment. If the plutonic (granitic) rock fragment as shown in Figure 1 is intersected by the cross-hair, we should count as a plutonic rock fragment. Consequently the compositional change is produced as this original detrital grain is altered in size through physical breakdown processes.
In contrast, by the Gazzi-Dickinson method the rock fragment generally cannot be assigned to be "the rock fragment"
. We should focus our atten-tion only to an individual crystal or grain within
the rock fragment under the cross-hair. For
example, plutonic rock fragments like Figure 1 are counted as either quartz, K-feldspar, plagio-clase or mica, but never counted as the rock frag-ment. In the case of volcanic rock fragment (e.g., basalt) in the thin-section phenocrysts should be counted as olivine, augite, plagioclase or whatev-er else comes to the cross-hair, but not be count-ed as the volcanic rock fragment. Because of such
Fig.2 Sampling sites for modal analyses of Holocene sediments on stream floors of the Ukedo and Takase Rivers, central Japan. Modal analyses by the traditional method for various sand-size sediments were conducted from site No. 1 to No. 10. Cross mark (X) denotes the sampling site of sediments, for which modal analyses by both the traditional and Gazzi-Dickinson methods were conducted (Fig. 4).
controversial two point-counting methods, some
workers tried and acquired modal data using
both methods (e.g., Baker et al., 1993; Trop and Ridgway, 1997).
To testify and compare the traditional and Gazzi-Dickinson methods, a number of Holocene
sands of known provenance were collected.
Modern sand-sized sediments derived from plu-tonic igneous (granitic) rocks of the Abukuma
Plateau were sampled along two river valleys, the
Takase and Ukedo Rivers in Fukushima
Pre-fecture, Japan (Fig. 2) . And the sediments were sieved into very coarse-, coarse-, medium- and fine-grained sand size and impregnated by epoxi resin in film boxes. Thin-sections were made from these cylindrical boxes, and all were stained by sodium-cobaltinitrite to distinguish K-feldspar from plagioclase and quartz. For each
tion we counted 300 points, using an appropriate grid spacing that resulted in coverage of the entire slide.
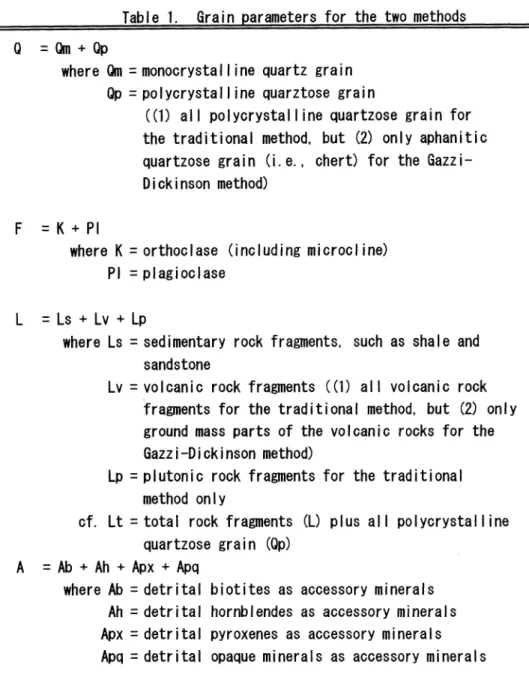
In an attempt to produce QFL diagrams and their daughter diagrams, such as a QmFLt
dia-gram, some grain parameters were set forth
(Table 1) . In both the traditional and
Gazzi-Dickinson methods, we recognize
monocrys-talline quartz grains (Qm) . However, we desig-nated only aphanitic quartzose aggregate grains (i.e., chert) as polycrystalline quartz grain (Qp) by the Gazzi-Dickinson method, whereas all poly-crystalline quartz grains including chert were assigned as (Qp) by the traditional method. In
this thin-section study, however, we have
encountered only few chert grains. Magic miner-als derived from weathered granitic rocks, such as biotite (Ab) , hornblende (Ah) together with some opaques (Apq) , were assigned as
accesso-ry minerals. Ortho- or clino-pyroxene (Apx)
derived from small-scale basic intrusive rocks was also assigned as the accessory mineral. Needless to say, these were not counted as con-stitutional detrital grains, when we made QFL diagrams (i.e., excluded from the three major component).
RESULTS AND DISCUSSION
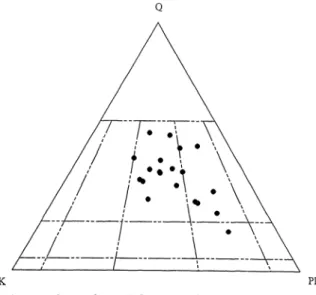
Modal analyses of parent rocks and weathered sands: Rocks making up the Abukuma Plateau are granites and granodiorites (Fig. 3). These plutonic rocks are divided into two major intru-sive blocks by the NNW-SSE running fracture
zone, and K-Ar ages of the eastern block (97.4 to 126 Ma) are rather older than those of western block (85 to 100 Ma, Kubo and Yamamoto, 1990). Although it is far beyond the scope of this study to embark on a systematic characterization of the source rocks, both intrusive bodies consist main-ly of fine-to medium-grained biotite granite, medium-grained hornblende-biotite granodiorite
and granodiorite porphyry. Average of some
modal analyses from these plutonic rocks are given in Table 2. The amount of total feldspars
(i.e., K-feldspar plus plagioclase) is generally more than, or close to 50% in each mode, where-as the amount of quartz is ubiquitously much less
Fig.3 Plots of QKPI diagram from parent rocks along river-side bluffs of the Ukedo and Takase Rivers. Data for this diagram are shown in Table 2.
Table 2. Modal analyses (percentage) of some exposed Branitic rocks along bluffs of the Takase and Ukedo Rivers
6 i ot.=biotite, Hrb.=Hornblende, Opq=opaque, and M i sc=miscellaneous. 2,000 points per thin-section were counted for the analyses.
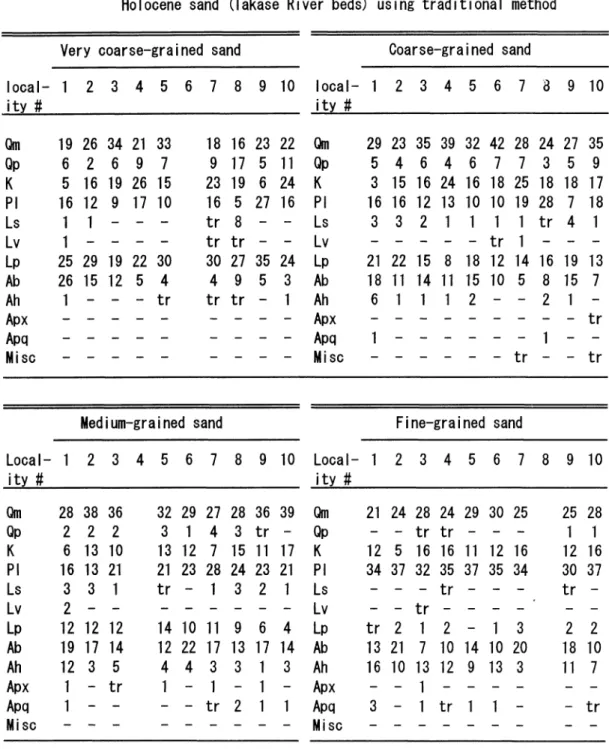
Table 3. Point-counting data (percentage) for se i ved fractions from Holocene sand (Takase River beds) using traditional method
The sampling localities i n the Takase River are shown i n Figure 2. Some vacant colums in the table means that, because of insufficiently impregnated epoxi
resins i n film boxes, the thin-sections were unable to be prepared. 300 points per thin-section were counted for the analyses.
than 50% and partly less than one-quater of the total mode. Biotite and hornblende are very com-mon maiic minerals, together with a minor amount of opaque minerals.
In contrast to such modal analyses of the par-ent rocks, Holocene sands on the stream floor of the Takase and Ukedo Rivers show that the total amount of feldspars in modes is much less than that of the parent rocks (Table 3). The reason for producing such modal gaps between the
par-ent rocks and the Holocene sands can be
ascribed to two factors; (1) the point-counting method and (2) actual weathering processes. Because thin-sections of the Holocene sands were
investigated using the traditional counting
method, many feldspars included in larger plu-tonic rock fragments were counted as the rock
fragments, but not counted as feldspars. The other reason for the modal gap is due to weath-ering processes of the parent rocks, in which destruction of feldspars was substantially caused under the medium humid climate, as revealed by Suttner (1974) and Basu (1976).
Variations in QmFLt diagrams due to two count-ing methods: Variations of plots of diagrams due to the different point-counting methods are
clear-ly shown in the QmFLt diagram of Figure 4. The modal plots of coarse-grained sand, counting in the manner of the traditional method, are plotted in the central part of the diagram. Using the same sand-size sample (i.e., the same thin-sec-tion), however, the plots by the Gazzi-Dickinson method occupy the quite different domain, near the edge of QmF line of the diagram. This is
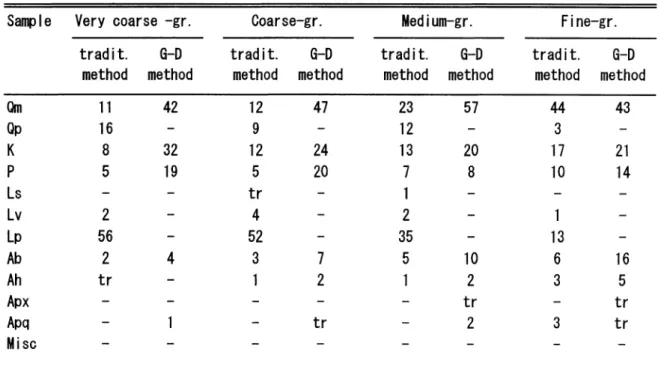
obvi-Table 4. Modal analyses (percentage) by two methods for seived
fractions of Holocene sand
The sampling site i s shown as "X" i n the Ukedo River i n Figure 2. Note that there i s no rock fragment and no po I ycrystal line quartz (Qp) by the Gazzi-D i ck i nson method. Op i n terms of the Gazzi -Dickinson method i n this paper
suggests the occurrence of chert grain, but the grain does not actually exist
in sands on the river beds. 300 points were counted in each thin-section for the analyses.
ously because that there should not be many rock fragments (Lt) by the Gazzi-Dickinson method
(Table 4) . Particularly the absence of plutonic rock fragments in the method is the major cause by that the plots are shifted toward the QmF line. It should be also mentioned that there is no poly-crystalline quartzose grain (Qp) in terms of the Gazzi-Dickinson method in this study, because there is no chert grain in treated thin-sections. Shifts of plots due to the decrease of grain size using the traditional method: By the traditional point-counting method, variations of modal com-position due to grain size are chiefly caused by the breakage of large grains into individual crys-tals or grains. Results using the traditional method in Figure 5 clearly show the shift of modal plots from the central part of QFL diagram toward the edge of QF line of the diagram, as the grain-size is decreased from coarse- to fine-grained sediments.
Fig.4 QmFLt plots of modal analysis data obtained by the Gazzi-Dickinson method (G-D) and the traditional method (TR) . Note that even using the same thin-section, difference of data between the two methods is very remark-able. Sampling site for this Holocene sediment is the cross mark (X) in Figure 1. Qm: Qm: monocrystalline quartz, F: total feldspar, and Lt; total rock fragment including aphanitic poly-crystalline quartz (e.g., chert). Data for this fig-ure are shown in Table 4.
As described, the studied Holocene sands were derived from granitic rocks in the Abukuma Plateau, and the plots of modal analyses using the Gazzi-Dickinson method are expected to be located in the "intracratonic stable domain"
(see figure 2 of Dickinson and Suczek, 1979). Thus Figure 5 indicates that, in the case of restricted grain size samples (finer than
fine-grained sand), Dickinson's QFL diagram can be applied even when we conduct modal analyses employing the traditional method. This means that in a limited grain-size range the QFL dia-gram aquired by the traditional method can be used for discussions on tectonic settings in prove-nances (e.g., Yagishita, 1985).
CONCLUSIONS
(1) Thin-section studies of weathered Holocene
sands from granitic rocks in the Abukuma
Plateau, central Japan, were conducted using two
Fig.5 Shifts of QFL plots due to grain-size vari-ations by the traditional method of point-count-ing. Note that plots in QFL diagram migrate from the center toward the QF line with decreasing size of sands. Q: total quartz, F: total feldspar, and L: total rock fragment. Thin-sec-tions were prepared from ten sampling locali-ties along the Takase River in Figure 2, and the
different point-counting methods (i.e., the tradi-tional and Gazzi-Dickinson methods).
(2) Even when we observe the same thin-sec-tion, domains of plots of mode in QmFLt dia-grams of Holocene sands quite differ from each
other between the two methods.
(3) If we restrict the grain size finer than the finer-grained sands, however, the QFL diagram
aiming to analyze tectonic settings can be used
no matter what point-counting method we
employ (i.e., either traditional or Gazzi-Dick-inson methods).
ACKNOWLEDGEMENTS
The original manuscript was greatly improved by critical comments of an anonymous reviewer. His stimulating suggestions are very helpful for our ongoing studies of sedimentary petrography of Holocene sands.
REFERENCES
Baker, J.C., Fielding, CR. , Caritat, PD. and Wikinson, MM. , 1993: Permian evolution of
sandstone composition in a complex back-arc extentional to foreland basin: The Bowen Basin, eastern Australia. Jour. Sediment. Petrol., 63, 881-893.
Basu, A., 1976: Petrology of Holocene fluvial sand derived from plutonic source rocks: implica-tions to paleoclimatic interpretation. Jour. Sediment. Petrol., 46, 694-709.
Dickinson, W.R., 1970: Interpreting detrital
modes of graywacke and arkose. Jour.
Sediment. Petrol., 40, 695-707. D
ickinson, W.R. and Suczek, C.A.,1979: Plate
tec-tonics and sandstone compositions. Am.
Assoc. Petroleum Geologists Bull., 63,
2164-2182.
Graham, S.A., Ingersoll, R.V. and Dickinson, W.R., 1976: Common provenance for lithic
grains in Carboniferous sandstones from Ouachita Mountains and Black Warrior Basin. Jour. Sediment. Petrol., 46, 620-332. Ingersoll, R.V., Bullard, T.F., Ford, R.L., Grimm,
J.P., Pickle, J.D, and Sares, SW. , 1984: The effect of grain size on detrital modes: A test of the Gazzi-Dickinson point-counting method. Jour. Sediment. Petrol., 54,103-116. Kubo, K. and Yamamoto, T., 1990: Cretaceous intrusive rocks of the Haramachi district,
eastern margin of the Abukuma Mountains -petrography and K-Ar age. Jour. Geol. Soc. Japan. 96, 731-743 (in Japanese with English
abstract).
Mack, G.H., 1978: The survivability of labile light-mineral grain in fluvial, aeolian and littoral marine environments: the Permian Cutler and Cedar Mesa Formations, Moab, Utah. Sedimetology, 25, 587-604.
Suttner, L.J.,1974: Sedimentary petrographic provinces: An evaluation. In Ross, C.A. ed., Paleogeographic provinces and provinciality. SEPM Spec. Publ. no. 21, 75-84.
Trop, J.M. and Ridgway, K.D., 1997: Petrofacies and provenance of a Late Cretaceous suture zone thrust-top basin, Cantwell Basin, cen-tral Alaska Range. Jour. Sediment. Res., 67, 469-485.
Yagishita, K., 1985: Evolution of a provenance as revealed by petrographic analyses of Creta-ceous formations in the Queen Charlotte Islands, British Columbia, Canada. Sedimen-tology, 32, 671-684.
砂 堆 積 物 の モ ー ド解 析 に お け る 二 つ の 測 定 法 一 比 較 と 評 価
韮 澤 真 弓 ・湊 陽子 ・八 木 下晃 司,1998,堆 積 学 研 究,No,48,85-93
Nirasawa, M., Minato, Y. and Yagishita, K., 1998: Two point-counting methods for modal analyses of Holocene sands: their comparison
and evaluation. Jour. Sed. Soc. Japan, No. 48, 85-93
薄 片 の モ ー ド比 を求 め る上 で,砂 堆 積 物 の 粒 径 が 測 定 結 果 に どの よ うな 影 響 を与 え る か を検 討 した.薄 片 の モ ー ド解 析 にお い て,粒 径 に よ りモ ー ド組 成 が 左 右 さ れ る伝 統 的 方 法 と,粒 径 に よる 影 響 を 受 け ない と され るGazzi-Dickinsonの 方 法 とで は測 定 値 に大 きな 差 が 生 じ る. そ こ で二 つ の異 な る カ ウ ン ト方 法 に よ り引 き起 こ され る 混 乱 を取 り除 く に は,堆 積 物 の粒 径 を2.0φ 以 下 の細 粒 砂 に 限 定 す れ ば,両 者 の 測 定 方 法 に よる デ ー タ に は 重 要 な差 異 が 生 じな い こ と を明 らか に した.こ の こ と は地 質 時 代 の砂 岩 に お い て も,平 均 粒 径 が 細 か い もの(細 粒 砂 以 下)で あ れ ば,両 測 定 法 に よ って 得 られ る デ ー タ に も大 差 は生 じな い こ と を意 味 し よ う.