Associate in Science Degree:
Veterinary Technology
Certificate:
Veterinary Management
Veterinary Technology
Comprehensive Academic Program Review
2010-11
Veterinary Technology
2010-11 Comprehensive Academic Program Review Department of Academic Effectiveness and Assessment
Copyright St. Petersburg College, June 2011. All rights reserved.
ii
Comprehensive Academic Program Review Produced by
Veterinary Technology Program
Richard Flora, Ph.D.
Dean, School of Veterinary Technology
Department of Academic Effectiveness and Assessment
James Coraggio, Ph.D.
Director of Academic Effectiveness and Assessment
Magaly Tymms, B.S.
Assessment Coordinator for Academic Programs
Amy Eggers, M.A.
Research Analyst
Amy Brush, M.S.
Outreach Coordinator
With contributions from:
Shirley Bell
Leigh Hopf
St. Petersburg College is dedicated to the concept of equal opportunity. The College will not discriminate on the basis of race, color, religion, sex, age, national origin, or marital status, or against any qualified individual with disabilities, in its employment practices or in the admission and treatment of students. Recognizing that sexual harassment constitutes discrimination on the basis of sex and violates this rule, the College will not tolerate such conduct.
Data and information contained herein cannot be used without the express written authorization of St. Petersburg College. All inquiries about the use of this information should be directed to the Director of Academic Effectiveness and Assessment at St. Petersburg College. Department of Academic Effectiveness and Assessment St. Petersburg College P.O. Box 13489 St. Petersburg, FL 33733 (727) 712-5237 FAX (727) 712-5411
Table of Contents
Executive Summary ... 5 SPC Mission Statement ...10 Introduction ...10 Institutional Effectiveness ...10 Educational Assessment ...11Program Review Process ...12
Program Description ...13
Degrees Offered ...13
Accreditation ...14
Major Learning Outcomes ...14
Program Performance ...15
Actual Course Enrollment ...15
Unduplicated Headcount ...16
Productivity ...17
Program Graduates...18
Grade Distributions ...19
Fulltime/Adjunct Faculty Ratio ...22
Program Profitability ...24
Relative Profitability Index (RPI-T) ...24
Program Improvements ...26
Capital Expenditures ...26
Academic Outcomes ...27
Stakeholder Perceptions ...31
Student Survey of Instruction (SSI) ...31
SSI Results ...32
Summary ...33
Advisory Committee ...34
Recent Meeting Summary ...35
Recent Alumni Survey Information ...37
Occupation Profile ...43
Occupation Description ...43
US, State, and Area Wage Information ...43
National, State, and County Trends ...44
Major Employers ...44
Total Placement ...46
Veterinary Technology
2010-11 Comprehensive Academic Program Review Department of Academic Effectiveness and Assessment
Copyright St. Petersburg College, June 2011. All rights reserved.
iv
Program Administrator’s Perspective: Issues, Trends, and Recent Successes ...48
Program Action Plan ...49
President’s Cabinet Review ...51
References ...52
Contact Information ...52
Appendix A: Program Overview (2011) ...53
Appendix B: Articulation Agreements ...55
Appendix C: Advisory Board Committee Minutes and Recommendations, 2010-11 ...57
Appendix D: Advisory Board Committee Minutes and Recommendations, 2009-10 ...61
Appendix E: Advisory Board Committee Minutes and Recommendations, 2008-09 ...69
Executive Summary
IntroductionThe program review process at St. Petersburg College (SPC) is a collaborative effort designed to continuously measure and improve the quality of educational services provided to the community.
Program Description
Graduate technicians assist veterinarians by using their scientific knowledge and skills for the benefit of society through the protection of animal health, the relief of animal suffering, the conservation of livestock resources, the promotion of public health, and the advancement of medical knowledge.
Degrees Offered
An Associate in Science Degree in Veterinary Technology, and a Certificate in Veterinary Management are offered at SPC.
Program Performance
Actual Course Enrollment increased during the Fall (1368) and Spring (1257) terms in 2009-10, from the previous two years. Summer has had the lowest actual enrollment over the last three years.
Unduplicated Headcount increased during Fall (302) and Spring (271) terms in 2009-10, from the previous year. Summer has had the lowest unduplicated headcount over the last three years.
Student Semester Hour (SSH) Productivity increased during Spring (0.87) and Summer (0.60) terms in 2009-10, from the previous year. Fall 2009-10 productivity remained the same (0.79).
The number of AS program graduates in the Veterinary Technology program decreased in 2009-10 (61) from the previous year, while the number of Certificate completers increased (5).
The vast majority of students in the program continue to succeed in the courses. In Spring 2010, 93.1% of the students were successful as compared to 94.6% in Spring 2011. In Fall 2009, 91.3% of the students succeeded as compared to 93.6% in Fall 2010.
Fulltime Faculty taught 60.1% of the ECHs in 2009-10 as compared to 67.5% in 2008-09. Adjunct Faculty taught 23.1% of the ECHs in 2009-10 as compared to 15.9% in 2008-09. The highest semester for Adjunct ECHs was Spring 2009-10 in which adjunct faculty taught 26.2% of the program’s course load. The three-semester average for adjuncts (23.1%) in 2009-10 is consistent with the College’s general 65/35 Fulltime/Adjunct Faculty Ratio guideline.
Program Profitability
The Relative Profitability Index (RPI-T) for the Veterinary Technology program increased (0.45) in 2009-10, from the previous two years. To provide a comparison of the program’s RPI-T to other similar programs, three other comparative measures were calculated. The 2009-10 mean RPI-T for SPC was 0.81; the 10 mean RPI-T for the Health Center was 0.50; and the
2009-Veterinary Technology
2010-11 Comprehensive Academic Program Review Department of Academic Effectiveness and Assessment
Copyright St. Petersburg College, June 2011. All rights reserved.
6
10 mean RPI-T for programs which offered between 50% and 75% of their courses online was 0.75.
Program Improvements
Capital Expenditures (Fund 10 and 16) for the Veterinary Technology program (Org: 11230111 and 11230112) during the past three years totaled $74,670. Program improvements made as a result of the capital expenditures included a digital radiograph machine, cat condos, computer equipment, teaching microscopes, and office supplies.
Academic Outcomes
The 2007-08 Academic Program Assessment Report indicated that four of the eight MLOs met the criteria for success in 2007, and all of the MLOs met the criteria for success in 2008.
The 2007-08 Academic Program Assessment Follow-up Report was completed in August 2008. All three action items were successfully completed and the results published in the 2007-08 follow-up report.
Stakeholder Perceptions
All the individual average content area scores for the Student Survey of Instruction (SSI) were above the traditional threshold (an average of 5.0) used by the College for evaluating seven-point satisfaction scales. These results suggest general overall satisfaction with the courses within the Veterinary Technology program; specifically, as they relate to faculty engagement, preparation and organization, and course instruction.
A Veterinary Technology advisory committee meeting was held on October 27, 2010. The meeting consisted of various reports including enrollment, program changes, graduation, Veterinary Technology National Exam (VTNE) results, a new building, new programs, equipment purchases, labor market data, and discussions about graduate placement, graduate and employer surveys, and updates on various topics.
One hundred and one Recent Alumni surveys were provided to the 2008-09 graduates of the Veterinary Technology program. Forty percent of the graduates contacted responded to the survey (41 of 101). Not all respondents answer every survey question; therefore, the percentages listed below represent the responses to each survey question in relation to the total number of responses received for each question.
Notable results include:
o 92.1% of recent graduate survey respondents, who were employed, were employed full-time.
o 94.3% of recent graduate survey respondents had a current position related to their studies.
o 28.9% of recent graduate survey respondents indicated their main goal in completing a degree or certificate at SPC was to “Meet certification-training needs,” 26.3% “Continue my education,” 18.4% “Earn more money,” 7.9% “Change career fields,” 7.9% “Obtain employment,” 7.9% “Get a promotion,” while the remaining 2.6% stated “Other.”
o 61.5% of recent graduate survey respondents indicated that their SPC degree allowed them to “Meet certification-training needs,” 53.8% “Earn more money,” 33.3% “Continue my education,” 33.3% “Get a promotion,” 23.1% “Obtain employment,” 7.7% “Change career fields,” and 10.2% “Other”. [Note: The total may exceed 100% as this question allows multiple responses.]
o 51.2% of recent graduate survey respondents indicated that SPC did “Exceptionally well” in helping them meet their goal; 39.0% said “Very well,” while 7.3% thought SPC did “Adequately.”
o 51.4% of recent graduate survey respondents indicated that they earned between $10.00 and $14.99 per hour ($21,000 and $30,999 annually), 45.9% earned between $15.00 and $19.99 per hour ($31,000 and $41,999 annually), while the remaining 2.7% earned $20.00 and 24.99 per hour ($42,000 -$51,999 annually).
o 28.2% of recent graduate survey respondents indicated they are continuing their education.
o 100.0% of recent graduate survey respondents would recommend SPC’s Veterinary Technology program to another.
Seventeen employer surveyswere sent out based on the permissions provided by recent graduates in the 2008-09 recent graduate survey. Nine survey respondents provided an evaluation of the graduates’ college preparation.
Notable results include:
o 100.0% of employers responding to the survey indicated they would hire another graduate from SPC.
o 44.4% of employers responding to the survey had graduate employees who earned between $15.00 and $19.99 per hour ($31,000 - $41,999 annually). 44.4% indicated earnings between $10.00 and $14.99 per hour ($21,000 - $30,999 annually), while the remaining 11.1% earned between $20.00 and $24.99 per hour ($42,000 - $51,999 annually).
Occupation Profile
One occupation description, veterinary technologists and technicians, was located in the Bureau of Labor Statistics for the Veterinary Technology program.
The 2009 median yearly income for veterinary technologists and technicians was $29,300in the United States and $27,200 in Florida.
Employment trend information for veterinary technologists and technicians showed a significant average annual increase (24% - 36%) in employment for the profession over the next 7 years for both the country and state.
The major employers of SPC’s Veterinary Technology program are employed in various areas related to their field. The primary local employers of these graduates are Bay Moorings Animal Hospital, Bay Road Animal Hospital, Berera Animal Hospital, Dogs and Cats Veterinary Referral, Florida Veterinary Specialist, Gulf Winds Animal Hospital, Happy Tails Veterinary Emergency Clinic, Heron Creek Animal Hospital, Hillside Animal Hospital, Janesville Veterinary Clinic, Lake City Animal Hospital, Martin Downs Animal Hospital, Metropolitan Veterinary Associates, Shamrock Veterinary Clinic, Tampa Bay Veterinary
Veterinary Technology
2010-11 Comprehensive Academic Program Review Department of Academic Effectiveness and Assessment
Copyright St. Petersburg College, June 2011. All rights reserved.
8
Surgery, University of Tennessee Veterinary Teaching Hospital, and Veterinary Emergency Clinic.
Total Placement in the Veterinary Technology program from 2005-06 through 2007-08 ranged from 97% to 100%.
State Graduates Outcomes
State Graduates Outcome indicated that one hundred and eight students completed a state Veterinary Technology program in 2008-09, of those seventy-five had some matching state data and were employed. Eighty-seventy-five percent (85%) of those state graduates were employed at least a full quarter. SPC’s graduates exceeded this rate with 88% of the graduates employed at least a full quarter.
Program Administrator’s Perspective: Issues, Trends, and Recent Successes
As the sophistication of veterinary medicine continues to increase, one of our challenges is to remain current with respect to the knowledge we encourage and expect our students to acquire at SPC. A major advantage in addressing this challenge is that fact that most of our faculty remain active members of the veterinary profession, and are affiliated with several veterinary hospitals. As a result, our instructors are intimately involved on a daily basis with the advances in veterinary medicine and the expectations of pet owners. Our instructors deliver this important knowledge and perspective to their students.
The placement rate for our graduates continues to be in the 90-100% range. The Veterinary Technician occupation has been identified as one of the top growing professions by the Department of Labor Statistics. The employment outlook for our graduates remains encouraging at this time.
We continue to receive requests from veterinary practices around the country regarding their interest in hiring additional program graduates. Just last week I heard from a practice that employs one of our graduates, and one of our current students, and they would like for a new employee to enroll in our program. Another practice that employs one of our graduates asked us to post a job announcement, as they are seeking to hire an additional graduate.
Recommendations/Action Plan
Program Recommendations and action plans are compiled by the Provost and Program Administrator, and are located at the end of the document.
Veterinary Technology
2010-11 Comprehensive Academic Program Review Department of Academic Effectiveness and Assessment
Copyright St. Petersburg College, June 2011. All rights reserved.
10
SPC Mission Statement
The mission of St. Petersburg College is to provide accessible,
learner-centered education for students pursuing selected baccalaureate degrees,
associate degrees, technical certificates, applied technology diplomas and
continuing education within our service area and globally, while retaining
leadership as a comprehensive, sustainable, multi-campus postsecondary
institution and as a creative partner with students, communities, and
other educational institutions to deliver rich learning experiences and to
promote economic and workforce development.
Introduction
In a holistic approach, the effectiveness of any educational institution is
the aggregate value of the education it provides to the community it
serves. For over seventy-five years, St. Petersburg College (SPC) has
provided a wide range of educational opportunities and services to a
demographically diverse student body producing tens of thousands of
alumni who have been on the forefront of building this county, state, and
beyond. This is due, in large part, to the College’s institutional
effectiveness.
Institutional Effectiveness
Institutional Effectiveness is the integrated, systematic, explicit, and
documented process of measuring performance against the SPC mission for
the purposes of continuous improvement of academic programs,
administrative services, and educational support services offered by the
College.
Operationally, the institutional effectiveness process ensures that the
stated purposes of the College are accomplished. In other words did the
institution successfully execute its mission, goals, and objectives? At SPC,
the Offices of Planning, Budgeting, and Research work with all
departments and units to establish measurable statements of intent that
are used to analyze effectiveness and to guide continuous quality
improvement efforts. Each of St. Petersburg College's units is required to
participate in the institutional effectiveness process.
The bottom-line from SPC’s institutional effectiveness process is
improvement. Once SPC has identified what it is going to do then it acts
through the process of teaching, researching, and managing to accomplish
its desired outcomes. The level of success of SPC’s actions is then
evaluated. A straightforward assessment process requires a realistic
consideration of the intended outcomes that the institution has set and a
frank evaluation of the evidence that the institution is achieving that
intent.
There is no single right or best way to measure success, improvement, or
quality. Nevertheless, objectives must be established, data related to
those objectives must be collected and analyzed, and the results of those
findings must be used to improve the institution in the future. The
educational assessment is a critical component of St. Petersburg College’s
institutional effectiveness process.
Educational Assessment
Educational programs use a variety of assessment methods to improve
their effectiveness. Assessment and evaluation measures are used at
various levels throughout the institution to provide provosts, deans,
program managers, and faculty vital information on how successful our
efforts have been.
While the focus of a particular educational assessment area may change,
the assessment strategies remain consistent and integrated to the fullest
extent possible. The focus for Associate in Arts degrees is targeted for
students continuing on to four-year degree programs as opposed to the
Associate in Applied Science, Associate in Science, and Baccalaureate
programs which are targeted towards students seeking employable skills.
The General Education based assessments focus on the general learning
outcomes from all degree programs, while Program Review looks at the
viability of the specific programs.
The individual reports unique by their individual nature are nevertheless
written to address how the assessments and their associated action plans
have improved learning in their program. The College has developed an
Educational Assessment Website (
https://it.spcollege.edu/edoutcomes/)
to serve as repository for all SPC’s educational outcomes reports and to
systematically manage our assessment efforts.
Veterinary Technology
2010-11 Comprehensive Academic Program Review Department of Academic Effectiveness and Assessment
Copyright St. Petersburg College, June 2011. All rights reserved.
12
Program Review Process
The program review process at St. Petersburg College is a collaborative
effort to continuously measure and improve the quality of educational
services provided to the community. The procedures described below go
far beyond the “periodic review of existing programs” required by the
State Board of Community Colleges; and exceeds the necessary guidelines
within the Southern Association of Community Colleges and Schools (SACS)
review procedures.
State guidelines require institutions to conduct program reviews every
seven years as mandated in chapter 1001.03(13) of the Florida Statutes,
the State Board of Education (formerly the Florida Board of Education)
must provide for the review of all academic programs.
(13) …CYCLIC REVIEW OF POSTSECONDARY ACADEMIC
PROGRAMS.--The State Board of Education shall provide
for the cyclic review of all academic programs in
community colleges and state universities at least every 7
years. Program reviews shall document how individual
academic programs are achieving stated student learning
and program objectives within the context of the
institution's mission. The results of the program reviews
shall inform strategic planning, program development, and
budgeting decisions at the institutional level.
In addition, Rule 6A-14.060 (5) states that each community college shall:
(5) …Develop a comprehensive, long-range program plan,
including program and service priorities. Statements of
expected outcomes shall be published, and facilities shall
be used efficiently to achieve such outcomes. Periodic
evaluations of programs and services shall use placement
and follow-up data, shall determine whether expected
outcomes are achieved, and shall be the basis for
necessary improvements.
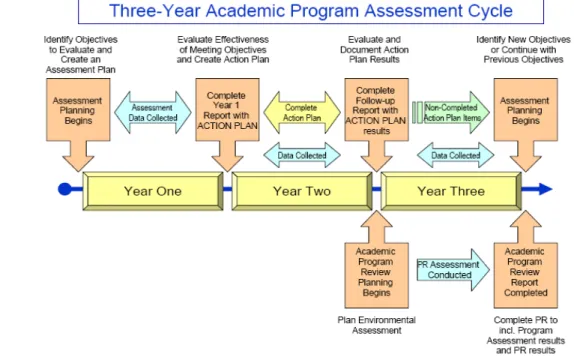
In 2007, SPC reduced the recommended program review timeline to three
years to coincide with the long-standing three-year academic program
assessment cycle, producing a more coherent and integrated review
process.
Figure 1 represents the relationship between program
assessment and program reviewing during the three-year assessment
cycle.
Figure 1: Three-Year Academic Program Assessment Cycle
Program Description
Graduate technicians assist veterinarians by using their scientific
knowledge and skills for the benefit of society through the protection of
animal health, the relief of animal suffering, the conservation of livestock
resources, the promotion of public health, and the advancement of
medical knowledge.
Degrees Offered
An Associate in Science Degree in Veterinary Technology and a Certificate
in Veterinary Management are offered at SPC.
For a complete listing of all courses within the Veterinary Technology
program, please see Appendix A. The A.S. program currently has 21
articulations with high schools and colleges. For a complete list, see
Appendix B.
Veterinary Technology
2010-11 Comprehensive Academic Program Review Department of Academic Effectiveness and Assessment
Copyright St. Petersburg College, June 2011. All rights reserved.
14
Accreditation
The Veterinary Technology Program is accredited by the American
Veterinary Medical Association (AVMA). The program was last reaffirmed in
2010, and the next accreditation is scheduled for 2011.
Major Learning Outcomes
1.
The student will recognize the principles of pharmacology, classes
of drugs, and be familiar with the pharmacology of commonly used
medications.
2.
The student will understand sterile technique, surgical assisting,
and be familiar with the characteristics of common surgical
instruments.
3.
The student will know the procedures for and be able to perform
common clinical laboratory tests such as blood counts, serum
chemistry, and urinalysis.
4.
The student will understand nursing practices and be able to use
intravenous catheters, urinary catheters, and bandaging materials
properly.
5.
The student will understand and practice radiation safety while
taking radiographs, and will be able to recognize and correct errors
in technique to produce diagnostic radiographs.
6.
The student will understand anesthetic agents and their admission,
the monitoring of anesthetized patients, and safe recovery.
7.
The student will understand office systems for patient records,
inventory, health certificates, invoicing, patient reminders and
tracking of controlled substances.
8.
The student will recognize the principles of dentistry and become
familiar with the procedures associated with dentistry in veterinary
medicine.
Program Performance
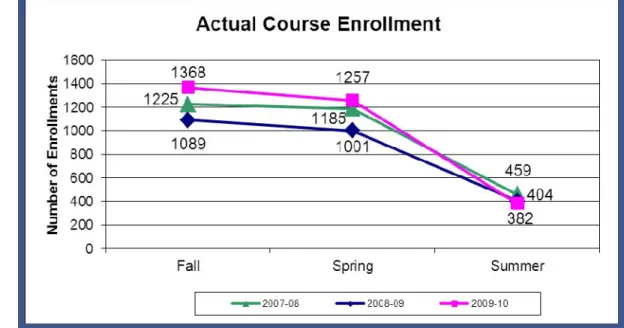
Actual Course Enrollment
Actual Course Enrollment is calculated using the sum of actual student
enrollment for the courses within the program (Academic Organization
Code). This number is a duplicated headcount of students enrolled in the
program's core courses, and does not reflect the actual number of
students enrolled in the A.S. program or its associated certificates (if
applicable). Actual Course Enrollment increased during the Fall (1368) and
Spring (1257) terms in 2009-10, from the previous two years. Summer has
had the lowest actual enrollment over the last three years, as shown in
Figure 2.
Figure 2: Actual Course Enrollment
Veterinary Technology
2010-11 Comprehensive Academic Program Review Department of Academic Effectiveness and Assessment
Copyright St. Petersburg College, June 2011. All rights reserved.
16
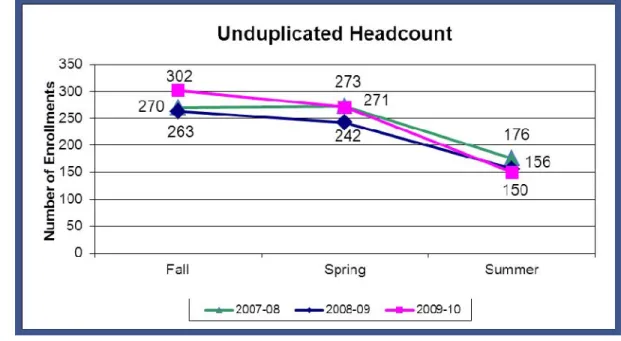
Unduplicated Headcount
Unduplicated Headcount is the total number of unduplicated students with
a program plan within the area of study (e.g., A.S. or certificate) that are
currently enrolled in a course under that Academic Org. during the term
of interest. This excludes 1) students in a different program plan or 2)
students in the right program plan who are not taking courses within that
Academic Org. for the term of interest. Unduplicated Headcount increased
during Fall (302) and Spring (271) terms in 2009-10, from the previous
year. Summer has had the lowest unduplicated headcount over the last
three years, as shown in Figure 3.
Figure 3: Unduplicated Headcount Source: PeopleSoft Student Administration System
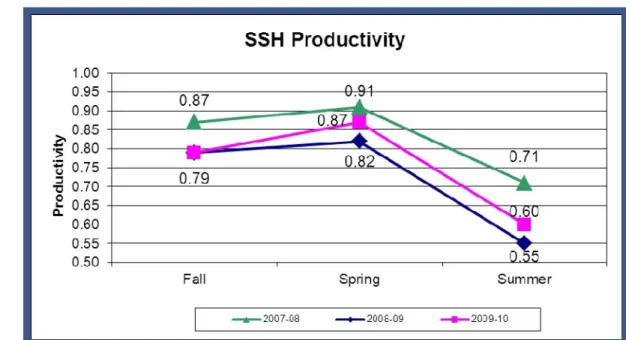
Productivity
Student Semester Hour (SSH) Productivity is calculated by dividing actual
SSH by the budgeted SSH. SSH productivity increased during Spring (0.87)
and Summer (0.60) terms in 2009-10, from the previous year. Fall 2009-10
productivity remained the same (0.79), as shown in Figure 4.
Figure 4: SSH Productivity
Veterinary Technology
2010-11 Comprehensive Academic Program Review Department of Academic Effectiveness and Assessment
Copyright St. Petersburg College, June 2011. All rights reserved.
18
Program Graduates
The number of AS degree graduates in the Veterinary Technology program
decreased in 2009-10 (61) from the previous year, while the number of
Certificate completers increased (5), as shown in Figure 5.
Figure 5: Program Graduates Source: 2010-11 SPC Factbook, Table 31
Grade Distributions
To provide a reference for program performance at the classroom level,
grade distributions are provided. Table 1 includes the percentage of
students receiving an A, B, C, D, or F in the program core courses. The
information was compiled from the college wide grade distribution report
generated at the end of the session. Some course data, such as dual credit
courses generally do not end at the same time as the regular campus
courses and may be omitted. In addition, the number of enrollments is a
duplicated headcount where students are counted for each class
registered, however, only A, B, C, D, and F grades are included in the
calculations.
Table 1
Program Core Course Grade Distributions
Semester Grade Distributions
A B C D F Spring 2009 63.5% 25.1% 7.8% 0.7% 2.9% Spring 2010 58.4% 26.7% 8.0% 2.5% 4.4% Spring 2011 58.4% 28.3% 7.9% 1.9% 3.6% Fall 2009 56.5% 26.0% 8.9% 4.8% 3.9% Fall 2010 55.4% 27.9% 10.3% 3.3% 3.2%
Veterinary Technology
2010-11 Comprehensive Academic Program Review Department of Academic Effectiveness and Assessment
Copyright St. Petersburg College, June 2011. All rights reserved.
20
Figure 6 provides a visual representation of the grade distributions for those students receiving a grade of A, B, or C.
ABC Grade Distributions
63.5% 58.4% 58.4% 56.5% 55.4% 27.9% 26.0% 28.3% 25.1% 26.7% 10.3% 8.9% 7.9% 7.8% 8.0% 0.0% 20.0% 40.0% 60.0% 80.0% 100.0% 2009 2010 2011 2009 2010 Spring Fall P e rc e n t o f S tude nt s ( inc lu . A B C D F ) A B C
Figure 6: ABC Grade Distributions
A classroom success rate was also calculated for the program. Classroom
success is defined as the percent of students successfully completing the
course with a grade of A, B, or C, divided by the total number of students
in the course. The vast majority of students in the program continue to
succeed in the courses, as shown in Figure 7. In Spring 2010, 93.1% of the
students were successful as compared to 94.6% in Spring 2011. In Fall
2009, 91.3% of the students succeeded as compared to 93.6% in Fall 2010.
Figure 7: Classroom Success
Veterinary Technology
2010-11 Comprehensive Academic Program Review Department of Academic Effectiveness and Assessment
Copyright St. Petersburg College, June 2011. All rights reserved.
22
Fulltime/Adjunct Faculty Ratio
Table 2 displays the number and percentage of Veterinary Technology
program equated credit hours (ECHs) taught by the individual faculty
classifications. As shown, Fulltime Faculty taught 60.1% of the ECHs in
2009-10 as compared to 67.5% in 2008-09. Adjunct Faculty taught 23.1% of
the ECHs in 2009-10 as compared to 15.9% in 2008-09.
Table 2
Equated Credit Hours by Faculty Classification Fulltime
Faculty Percent of Load Faculty Adjunct Faculty Number
of ECHs
% of Classes
Taught Number of ECHs Classes % of Taught Number of ECHs % of Classes Taught Fall 2007-2008 140.6 68.2% 39.2 19.0% 26.5 12.8% Spring 2007-2008 136.4 66.1% 33.3 16.1% 36.5 17.7% Summer 2007-2008 56.3 63.8% 19.5 22.1% 12.5 14.2% 2007-2008 Total 333.3 66.6% 92.0 18.4% 75.5 15.1% Fall 2008-2009 143.9 70.7% 30.3 14.9% 29.4 14.4% Spring 2008-2009 119.4 63.4% 31.3 16.6% 37.6 20.0% Summer 2008-2009 58.0 69.2% 17.4 20.8% 8.4 10.0% 2008-2009 Total 321.3 67.5% 79.0 16.6% 75.4 15.9% Fall 2009-2010 142.4 62.0% 36.8 16.0% 50.4 22.0% Spring 2009-2010 125.8 57.9% 34.6 15.9% 56.8 26.2% Summer 2009-2010 45.8 60.3% 16.8 22.1% 13.4 17.6% 2009-2010 Total 314.0 60.1% 88.2 16.9% 120.6 23.1%
The Fulltime/Adjunct Faculty Ratio is calculated by dividing a program’s
adjunct’s ECHs by the sum of the Adjunct’s, Percent of Load’s, and
Fulltime Faculty’s ECHs. Figure 8 displays the Fulltime/Adjunct Faculty
Ratio information for the last three academic years. The highest semester
for Adjunct ECHs was Spring 2009-10 in which adjunct faculty taught 26.2%
of the program’s course load as shown in Table 2. The three-semester
average for adjuncts (23.1%) in 2009-10 is consistent with the College’s
general 65/35 Fulltime/Adjunct Faculty Ratio guideline.
Figure 8: Full-time/Adjunct Faculty Ratio
Veterinary Technology
2010-11 Comprehensive Academic Program Review Department of Academic Effectiveness and Assessment
Copyright St. Petersburg College, June 2011. All rights reserved.
24
Program Profitability
Relative Profitability Index (RPI-T)
Relative Profitability Index (RPI-T) is a measure of program profitability. It
is calculated by dividing a program’s income by the sum of its personnel
expenses and current expenses. Only Fund 10 financials are used in the
calculation of RPI-T; specifically, program revenues (GL 400000),
personnel expenses (GL 500000), and current expenses (GL 600000).
Program revenues (GL 400000) can include (1) student application fees
and tuition, (2) out of state fees, and (3) gifts from alumni and charitable
organizations.
Personnel expenses (GL 500000) can include (1) personnel salary expenses
for program management, and instructional staff, (2) personnel salary
expenses for OPS and student assistants, and (3) personnel benefits.
Personnel assigned to multiple programs may have partial personnel
expenses assigned to an individual program.
Current expenses (GL 600000) can include operating expenses for (1)
travel, (2) goods and services, and (3) materials and supplies. Current
expenses can also include scholarship and fee waivers.
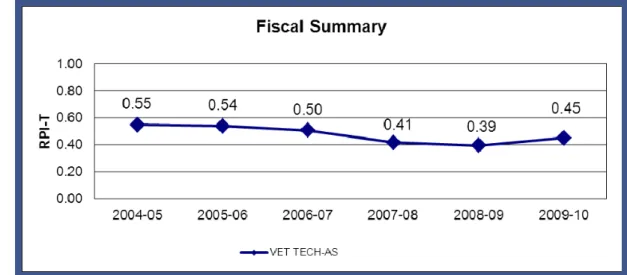
The RPI-T for the Veterinary Technology program increased (0.45) in
2009-10, from the previous two years, as shown in Figure 9.
To provide a comparison of the program’s RPI-T to other similar programs,
three other comparative measures were calculated. The 2009-10 mean
RPI-T for SPC was 0.81; the 2009-10 mean RPI-T for the Health Center was
0.50; and the 2009-10 mean RPI-T for programs which offered between
50% and 75% of their courses online was 0.75.
Figure 9: Fiscal Summary
Source: PeopleSoft Financial Production System: Summary of Monthly Organization Budget & Actuals Status Report (ORGBUDA1) from End of Fiscal Year
Veterinary Technology
2010-11 Comprehensive Academic Program Review Department of Academic Effectiveness and Assessment
Copyright St. Petersburg College, June 2011. All rights reserved.
26
Program Improvements
Capital Expenditures
Capital Expenditures (Fund 10 and 16) for the Veterinary Technology
program (Org: 11230111 and 11230112) during the past three years totaled
$74,670 as shown in Table 3. Program improvements made as a result of
the capital expenditures included a digital radiograph machine, cat
condos, computer equipment, teaching microscopes, and office supplies.
Table 3
Veterinary Technology Program Capital Expenditures Capital Expenditures
Year Capital Outlay Account Purchase Description
2007-08 73,894 700000
Digital radiograph machine, cat condos, computer equipment, and teaching microscopes were purchased. 2008-09 776 700000 Office supplies
2009-10 0 700000 --
Total $74,670
Source: PeopleSoft Financial Production System: Summary of Monthly Organization Budget & Actuals Status Report (ORGBUDA1) from End of Fiscal Year
Academic Outcomes
As part of SPC quality improvement efforts, academic assessments are
conducted on each AAS/AS program every three years to evaluate the
quality of the program’s educational outcomes. The Veterinary
Technology program was evaluated through an Academic Program
Assessment Report (APAR) in 2007-08.
Each of the program’s eight Major Learning Outcomes (MLOs) was
evaluated during the 2007-08 assessment. Each of the eight MLOs is listed
below:
1.
The student will recognize the principles of pharmacology, classes
of drugs, and be familiar with the pharmacology of commonly used
medications.
2.
The student will understand sterile technique, surgical assisting,
and be familiar with the characteristics of common surgical
instruments.
3.
The student will know the procedures for and be able to perform
common clinical laboratory tests such as blood counts, serum
chemistry, and urinalysis.
4.
The student will understand nursing practices and be able to use
intravenous catheters, urinary catheters, and bandaging materials
properly.
5.
The student will understand and practice radiation safety while
taking radiographs, and will be able to recognize and correct errors
in technique to produce diagnostic radiographs.
6.
The student will understand anesthetic agents and their admission,
the monitoring of anesthetized patients, and safe recovery.
7.
The student will understand office systems for patient records,
inventory, health certificates, invoicing, patient reminders and
tracking of controlled substances.
Veterinary Technology
2010-11 Comprehensive Academic Program Review Department of Academic Effectiveness and Assessment
Copyright St. Petersburg College, June 2011. All rights reserved.
28
8.
The student will recognize the principles of dentistry and become
familiar with the procedures associated with dentistry in veterinary
medicine.
Means of Assessment
The purpose of the End of the Program assessment is to make summative
interpretations for program improvement.
The Veterinary Technology program used the results of the Professional
Exam service’s National Exam to evaluate the students. This exam is part
of the licensing, registration or certification requirements for a veterinary
technician in the majority of states.
The criteria for success stated that the SPC average should be above the
mean score of all candidates (nationally) taking the exam for the first
time.
Data were collected during June 2007 and January 2008. The data findings
for each semester in 2007-08, for each of the eight MLOs are displayed in
Table 4 and Table 5. In June 2007, four of the eight MLOs showed mean
scores that were above the criteria for success. In January 2008, the
resulting mean scores for all of the MLOs were above the criteria for
success in every category, with the exception of MLO 7 which was not
evaluated.
Table 4
Veterinary Technology June 2007 Assessment Results
Major Learning Objectives
Summary of Assessment Findings
SPC Average National Average Percent Difference
MLO 1 466 460 +1.3 MLO 2 481 504 -4.6 MLO 3 569 516 +9.7 MLO 4 504 501 +0.6 MLO 5 398 408 -2.5 MLO 6 402 411 -2.1
MLO 7 No scores were reported for this MLO because it was replaced by a section on dentistry beginning with the June 2007 exam.
MLO 8 498 453 +9.9
Source: Academic Outcomes from 2007-08 Academic Program Assessment Report (APAR) Table 5
Veterinary Technology January 2008 Assessment Results
Major Learning Objectives
Summary of Assessment Findings
SPC Average National Average Percent Difference
MLO 1 528 498 +6.0 MLO 2 522 509 +2.6 MLO 3 533 415 +28.4 MLO 4 503 453 +10.1 MLO 5 395 357 +11.5 MLO 6 580 521 +11.3
MLO 7 No scores were reported for this MLO because it was replaced by a section on dentistry beginning with the June 2007 exam.
MLO 8 516 487 +6.0
Veterinary Technology
2010-11 Comprehensive Academic Program Review Department of Academic Effectiveness and Assessment
Copyright St. Petersburg College, June 2011. All rights reserved.
30
The 2007-08 follow-up report was completed in August 2008. All three
action items were successfully completed and the results published in the
2007-08 follow-up report. The next assessment report is scheduled to be
completed during the 2010-11 academic year.
Stakeholder Perceptions
Student Survey of Instruction (SSI)
Each semester, St. Petersburg College (SPC) administers the Student
Survey of Instruction. Students are asked to provide feedback on the
quality of their instruction using a 7-point scale where 7 indicates the
highest rating and 1 indicates the lowest rating.
The purpose of the SSI survey is to acquire information on student
perception of the quality of courses, faculty, and instruction, and to
provide feedback information for improvement.
Beginning in Fall 2008, all SSI forms (except Clinical B) have been
administered electronically using an online format.
During 2009-10, the
SSI items were reviewed and revised by a committee composed of faculty
and administrators. As a result of the revision process, the lecture,
non-lecture, and eCampus forms were consolidated into one form,
independent of modality, which has been administered online since Spring
2010.
As part of the instrument validation process, the results from the SSI over
the last few years were assessed for reliability and validity. The results of
this assessment suggested three underlying factors.
The three factors are faculty engagement, preparation and organization,
and course instruction. The survey questions are grouped into these
categories as defined below:
Faculty Engagement – focuses on how successful the instructor was in
encouraging student performance, the instructor’s level of enthusiasm
for the subject and respect for students, how well the instructor
applied the stated grading policies including providing students
appropriate information to determine their grades, and the
instructor’s responsiveness to student questions outside of the
classroom.
Preparation and Organization - focuses on the instructor’s overall
preparation for the course, the instructor’s ability to start and end
class on time, the amount of time spent on course-related activities by
Veterinary Technology
2010-11 Comprehensive Academic Program Review Department of Academic Effectiveness and Assessment
Copyright St. Petersburg College, June 2011. All rights reserved.
32
the instructor, and the even assignment and appropriateness of course
material throughout the term.
Course Instruction – focuses on the instructor’s clarity of instruction,
how well the course objectives were defined by the instructor, and
how well the instructor met student expectations.
SSI Results
The SSI survey is electronically distributed to all students enrolled in
traditional classroom sections, lab courses and self-paced or directed
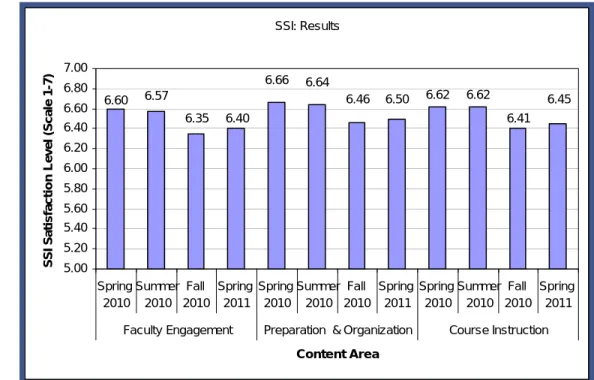
individual study, and online courses at the College. The average scores are
all well above the traditional threshold (an average of 5.0) used by the
College for evaluating seven-point satisfaction scales during all three
semesters. The average survey results by semester and content area are
shown in Figure 10.
SSI: Results 6.57 6.35 6.40 6.45 6.41 6.62 6.60 6.66 6.64 6.46 6.50 6.62 5.00 5.20 5.40 5.60 5.80 6.00 6.20 6.40 6.60 6.80 7.00 Spring 2010 Summer 2010 Fall 2010 Spring 2011 Spring 2010 Summer 2010 Fall 2010 Spring 2011 Spring 2010 Summer 2010 Fall 2010 Spring 2011 Faculty Engagement Preparation & Organization Course InstructionContent Area S S I S a ti sf a c ti o n L evel ( S cal e 1-7)
Figure 10: SSI Results
Summary
All the individual average content area scores were above the traditional
threshold (an average of 5.0) used by the College for evaluating
seven-point satisfaction scales. These results suggest general overall satisfaction
with the courses within the Veterinary Technology program; specifically,
as they relate to faculty engagement, preparation and organization, and
course instruction.
Veterinary Technology
2010-11 Comprehensive Academic Program Review Department of Academic Effectiveness and Assessment
Copyright St. Petersburg College, June 2011. All rights reserved.
34
Advisory Committee
Community input and participation is an important component of the
educational process at the College. The advisory committees are an
example of community input. Advisory committees meet a minimum of
twice annually with additional meetings as needed for good program
coordination.
Advisory committee members are appointed by the College President to
serve a one-year term of office and must have a demonstrated
competency in the program specialty area or an understanding of the
program and of the community at large. An exception to the above may be
a lay person directly involved in a related program field such as
counseling, public relations, or administration of a business or industry.
Specific Functions of Advisory Committees are:
1.
Assessing how the program meets the current occupational needs of
employers.
2.
Reviewing and making recommendations on the program
curriculum.
3.
Providing input to help prepare students for work in their chosen
field.
4.
Assisting in recruiting, providing internships, and in placing
qualified graduates in appropriate jobs.
5.
Expanding and enhancing St. Petersburg College’s reputation in the
community by fostering positive community relationships.
Recent Meeting Summary
A Veterinary Technology advisory committee meeting was held on October
27, 2010. The meeting consisted of various reports including enrollment,
program changes, graduation, Veterinary Technology National Exam
(VTNE) results, a new building, new programs, equipment purchases, labor
market data, and discussions about graduate placement, graduate and
employer surveys, and updates on various topics.
Enrollment
Enrollment for both the AS and BAS programs were discussed. It was
determined that interest in both programs continues to be very high.
The last count indicated that there are 285 students enrolled in the AS
degree program, and 119 in the BAS program.
Program Changes
The program is in the process of reviewing its courses to ensure that
“active learning” is being used, and that the assessments being utilized
are reliable, appropriate, and actually determine whether the students
are meeting the learning objectives for their courses.
Graduation
The committee discussed the total number of graduates during the May
2010, and July 2010 commencements.
VTNE Results
The results from this exam indicate that SPC’s pass rate continues to
surpass the national average. However, there is still a need to evaluate
course content, teaching effectiveness, and test performance. The test
is now being administered online.
New Building
Construction of the new building is underway and its completion is
expected in June 2011. Classes for August are expected to be moved
into the new building in July.
New VT programs
New veterinary technology programs are being developed at Edison
State College and Pensacola State College.
Veterinary Technology
2010-11 Comprehensive Academic Program Review Department of Academic Effectiveness and Assessment
Copyright St. Petersburg College, June 2011. All rights reserved.
36
Equipment Purchases
With the assistance of Amy Brush, the use of Perkins Grant money
allowed for the purchase of important equipment. However, there is
still a need of an electrocautery unit.
Labor Market Data
There is a projected 55% increase in the number of veterinary
technicians needed within the state of Florida between the years
2006-2016.
Graduate Placement
Placement continues to exceed 97%.
Graduate and Employer Surveys
As indicated by the results of these surveys, both graduates and
employers are very satisfied with the programs.
Student Internships
There have been no internships since April; however, the members are
working on developing more internship opportunities.
BAS Update
Enrollment is very good. The Nutrition and Animal Science courses
were approved and are being recommended by UF to meet their
veterinary school admission requirement.
Next Meeting
The next meeting was scheduled for April 15, 2011.
The complete committee minutes along with the minutes from previous
meetings are located in Appendices C, D, and E.
Recent Alumni Survey Information
One hundred and one Alumni Surveys were provided to the 2008-09
graduates of the Veterinary Technology program. Responses were
received from thirty-eight A.S. graduates and three Certificate
completers.
Forty percent of the graduates contacted responded to the survey (41 of
101). Not all respondents answer every survey question; therefore, the
percentages listed below represent the responses to each survey question
in relation to the total number of responses received for each question.
Notable results include:
92.1% of recent graduate survey respondents, who were employed,
were employed full-time.
94.3% of recent graduate survey respondents had a current position
related to their studies.
28.9% of recent graduate survey respondents indicated their main
goal in completing a degree or certificate at SPC was to “Meet
certification-training needs,” 26.3% “Continue my education,”
18.4% “Earn more money,” 7.9% “Change career fields,” 7.9%
“Obtain employment,” 7.9% “Get a promotion,” while the
remaining 2.6% stated “Other.”
61.5% of recent graduate survey respondents indicated that their
SPC degree allowed them to “Meet certification-training needs,”
53.8% “Earn more money,” 33.3% “Continue my education,” 33.3%
“Get a promotion,” 23.1% “Obtain employment,”; 7.7% “Change
career fields,” and 10.2% “Other.” [Note: The total may exceed
100% as this question allows multiple responses.]
51.2% of recent graduate survey respondents indicated that SPC did
“Exceptionally well” in helping meet their goal; 39.0% “Very well,”
while 7.3% thought that SPC did “Adequately.”
51.4% of recent graduate survey respondents indicated that they
earned between $10.00 and $14.99 per hour ($21,000 - $30,999
annually). 45.9% earned between $15.00 and $19.99 per hour
($31,000 - $41,999), while the remaining 2.7% earned $20.00 and
$24.99 per hour ($42,000 - $51,999 annually).
28.2% of recent graduate survey respondents indicated they are
continuing their education.
Veterinary Technology
2010-11 Comprehensive Academic Program Review Department of Academic Effectiveness and Assessment
Copyright St. Petersburg College, June 2011. All rights reserved.
38
100.0% of recent graduate survey respondents would recommend
SPC’s Veterinary Technology program to another.
An evaluation of Veterinary Technology graduates’ general
education outcomes is displayed in Table 6. Graduates indicated
high levels of satisfaction with their college preparation in the area
of general education outcomes. Twenty outcomes received mean
scores 4.0 or higher, while the remaining five outcomes received
mean scores between 3.5 and 3.9.
Table 6
College Preparation Ratings for Recent Veterinary Technology Program Graduates
General Education Outcomes
(Five point rating scale with five being the highest) Item Ratings
N MEAN SD
Communicating clearly and effectively with others
through: Speaking 41 4.1 0.85 Listening 41 4.1 0.73 Reading 41 4.1 0.86 Writing 41 4.0 0.72
Your use of mathematical and computational skills:
Comfortable with mathematical calculations 41 3.7 0.96
Using computational skills appropriately 41 3.9 0.79
Accurately interpreting mathematical data 41 3.7 0.92
Using the following forms of technology:
Email 41 4.4 0.77 Word Processing 41 4.3 0.81 Spreadsheets 41 3.7 0.94 Databases 41 3.5 0.90 Internet Research 41 4.2 0.76
Thinking logically and critically to solve problems:
Gathering and assessing relevant information 41 4.2 0.59
Inquiring about and interpreting information 41 4.1 0.57
Organizing and evaluating information 41 4.3 0.61
Analyzing and explaining information to others 41 4.0 0.67
Veterinary Technology
2010-11 Comprehensive Academic Program Review Department of Academic Effectiveness and Assessment
Copyright St. Petersburg College, June 2011. All rights reserved.
40
Table 6, continued
College Preparation Ratings for Recent Veterinary Technology Program Graduates
General Education Outcomes
(Five point rating scale with five being the highest) Item Ratings
N MEAN SD
Working effectively with others in a variety of
settings:
Participating as a team player (e.g., group projects) 41 4.5 0.67 Working well with individuals from diverse
backgrounds 41 4.4 0.67
Using ethical courses of action 41 4.4 0.55
Demonstrating leadership skills 41 4.0 0.82
Appreciating the importance of lifelong learning:
Showing an interest in career development 41 4.5 0.55
Being open to new ideas and challenges 41 4.4 0.54
Willingness to take on new responsibilities 41 4.4 0.59
Pursuing additional educational opportunities 41 4.4 0.70
Employer Survey Information
Seventeen employer surveys were sent out to employers based on the
permissions provided by recent graduates in the 2008-09 recent alumni
survey. Fifty-two percent of employers surveyed responded to the survey.
Notable results include:
100.0% of employers responding to the survey indicated they would
hire another graduate from SPC.
44.4% of employers responding to the survey had graduate
employees who earned between $15.00 and $19.99 per hour
($31,000 - $41,999 annually). 44.4% indicated earnings between
$10.00 and $14.99 per hour ($21,000 - $30,999 annually), while the
remaining 11.1% earned between $20.00 and $24.99 per hour
($42,000 - $51,999 annually).
An employer evaluation of Veterinary Technology graduates’
general education outcomes is displayed in Table 7. Employers
indicated high levels of satisfaction with graduates’ general
education outcomes. Five outcomes received a mean score of 5.0,
while twenty outcomes received mean scores between 4.2 and 4.
Table 7
Employer Competency Ratings for Recent Veterinary Technology Program Graduates
General Education Outcomes Item Ratings
(Five point rating scale with five being the highest)
N Mean SD N/A*
Communicate clearly and effectively with others
through:
Speaking 9 5.0 ---
Listening 9 4.9 0.33
Reading 8 5.0 --- 1
Writing 8 5.0 --- 1
Use mathematical and computational skills:
Comfortable with mathematical calculations 9 4.3 0.87
Uses computational skills appropriately 8 4.6 0.74 1
Accurately interprets mathematical data 8 4.6 0.74 1
Use the following forms of technology:
E-mail 7 5.0 --- 2
Word Processing 6 4.5 0.55 3
Spreadsheets 4 4.8 0.50 5
Databases 3 4.7 0.58 6
Internet Research 7 4.9 0.38 2
Think logically and critically to solve problems
Gathers and assesses relevant information 9 4.7 0.50
Inquires and interprets information 9 4.8 0.44
Organizes and evaluates information 9 4.7 0.50
Analyzes and explains information to others 9 4.7 0.50
Uses information to solve problems 9 4.4 0.88
Work effectively with others in a variety of
settings:
Veterinary Technology
2010-11 Comprehensive Academic Program Review Department of Academic Effectiveness and Assessment
Copyright St. Petersburg College, June 2011. All rights reserved.
42
Table 7, continued
Employer Competency Ratings for Recent Veterinary Technology Program Graduates
General Education Outcomes Item Ratings
(Five point rating scale with five being the
highest)
N Mean SD N/A*
Works well with individuals from diverse
backgrounds 9 4.9 0.33
Uses ethical courses of action 9 5.0 ---
Demonstrates leadership skills 9 4.2 0.97
Appreciate the importance of lifelong learning:
Shows interest in career development 9 4.6 0.73
Open to new ideas and challenges 9 4.7 0.71
Willing to take on new responsibilities 9 4.7 0.71
Pursues additional educational opportunities 9 4.4 0.88
*The survey allowed employers to select N/A if a competency was not applicable for an employee.
Occupation Profile
One occupation description was located in the Bureau of Labor Statistics
for the Veterinary Technology program. The occupation description title
was Veterinary Technologists and Technicians.
Occupation Description
The occupation description for Veterinary Technologists and Technicians
used by the Bureau of Labor Statistics is shown below:
Perform medical tests in a laboratory environment for use in the
treatment and diagnosis of diseases in animals. Prepare vaccines and
serums for prevention of diseases. Prepare tissue samples, take blood
samples, and execute laboratory tests, such as urinalysis and blood
counts. Clean and sterilize instruments and materials and maintain
equipment and machines.
US, State, and Area Wage Information
The distribution of 2009 wage information for Veterinary Technologists
and Technicians is located in Table 8. The median yearly income
for
veterinary technologists and technicians was $29,300 in the United States
and $27,200 in Florida. The wage information is divided by percentiles for
hourly and yearly wages. This information is also separated by location.
Table 8
Wage Information for Veterinary Technology
Location Period Pay 2009
10% 25% Median 75% 90%
United States Hourly $9.70 $11.54 $14.08 $17.25 $20.71
Yearly $20,200 $24,000 $29,300 $35,900 $43,100
Florida Hourly $9.21 $10.81 $13.09 $15.70 $18.95
Yearly $19,200 $22,500 $27,200 $32,700 $39,400
Source: Bureau of Labor Statistics, Occupational Employment Statistics Survey; Florida Agency for Workforce Innovation
Veterinary Technology
2010-11 Comprehensive Academic Program Review Department of Academic Effectiveness and Assessment
Copyright St. Petersburg College, June 2011. All rights reserved.
44
National, State, and County Trends
Employment trend information for veterinary technologists and
technicians is included in Table 9 and divided by country and state. A
significant average annual increase (24% - 36%) in employment for the
profession over the next 7 years for the country and state is shown.
Table 9
State and National Trends
United States Employment Percent Change Job Openings 1
2008 2018
Veterinary technologists and
technicians 79,600 108,100 +36% 4,850
Florida Employment Percent Change Job Openings 1
2008 2018
Veterinary technologists and
technicians 6,560 8,160 +24% 330
1Job Openings refers to the average annual job openings due to growth and net replacement.
Source: Bureau of Labor Statistics, Office of Occupational Statistics and Employment Projections; Florida Employment Projections
Major Employers
Graduates of SPC’s Veterinary Technology program are employed in
various areas related to their field. The primary local employers of these
graduates are Bay Moorings Animal Hospital, Bay Road Animal Hospital,
Berera Animal Hospital, Dogs and Cats Veterinary Referral, Florida
Veterinary Specialist, Gulf Winds Animal Hospital, Happy Tails Veterinary
Emergency Clinic, Heron Creek Animal Hospital, Hillside Animal Hospital,
Janesville Veterinary Clinic, Lake City Animal Hospital, Martin Downs
Animal Hospital, Metropolitan Veterinary Associates, Shamrock Veterinary
Clinic, Tampa Bay Veterinary Surgery, University of Tennessee Veterinary
Teaching Hospital, and Veterinary Emergency Clinic, as depicted in Table
10.
Table 10
Major Employers
Employers of Veterinary Technology Graduates
Bay Moorings Animal Hospital
Bay Road Animal Hospital
Berera Animal Hospital
Dogs and Cats Veterinary Referral
Florida Veterinary Specialist
Gulf Winds Animal Hospital
Happy Tails Veterinary Emergency Clinic
Heron Creek Animal Hospital
Hillside Animal Hospital
Janesville Veterinary Clinic
Lake City Animal Hospital
Martin Downs Animal Hospital
Metropolitan Veterinary Associates
Shamrock Veterinary Clinic
Tampa Bay Veterinary Surgery
University of Tennessee Veterinary Teaching Hospital
Veterinary Emergency Clinic
Veterinary Technology
2010-11 Comprehensive Academic Program Review Department of Academic Effectiveness and Assessment
Copyright St. Petersburg College, June 2011. All rights reserved.
46
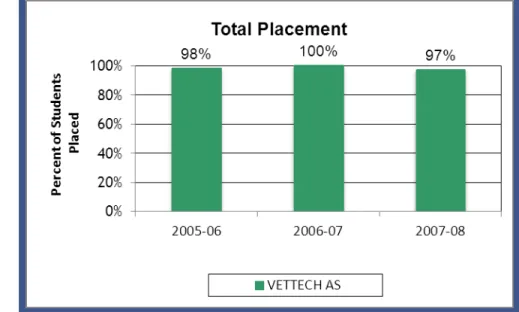
Total Placement
Total Placement is the percentage of students who have an acceptable
placement after graduation. Acceptable placement includes students who
are enlisted in the military, continuing their education, and/or employed
in their field within the first year of graduation. Only students with A.S.
and A.A.S degrees are used in the calculation. The Total Placement in the
Veterinary Technology program from 2005-06 through 2007-08 has
remained consistent ranging from 97% to 100%, as shown in Figure 11.
Figure 11: Total Placement Source: 2010-11 SPC Factbook, Table 38
State Graduates Outcomes
To provide reference information for the employment trend data, program
graduate state outcome data are provided for all academic programs
included within Veterinary Technology. Veterinary Technology program
graduate state outcome data are provided in Table 11.
One hundred and eight students completed a state Veterinary Technology
program in 2008-09, of those seventy-five had some matching state data
and were employed. Eighty-five percent (85%) of those state graduates
were employed at least a full quarter. SPC’s graduates exceeded this rate,
with 88% of the graduates employed at least a full quarter, as depicted in
Table 11.
Table 11
Veterinary Technology Program Graduates 2008-09 Outcomes by Florida Community College Florida Community College Total Completers # Found Employed # Employed for a Full Qtr % Employed For a Full Qtr FETPIP Pool # Training Related (Employed, Education, or Military) Placement Rate Brevard 9 7 5 71% 6 6 100% Miami Dade College 10 10 8 80% 8 5 63% St. Petersburg College 88 57 50 88% 61 56 92% Hillsborough Community College 1 1 1 100% 1 1 100% Total 108 75 64 85% 76 68 89%
Source: Florida Education and Training Placement Information Program (FETPIP), Community College Vocational Reports (http://www.fldoe.org/fetpip/pdf/0809pdf/fcs0809asc.pdf)
Veterinary Technology
2010-11 Comprehensive Academic Program Review Department of Academic Effectiveness and Assessment
Copyright St. Petersburg College, June 2011. All rights reserved.