2014 JOINT ADMINISTRATION-SENATE OVERSIGHT COMMITTEE ON
Contents
List of Figures iv
List of Tables vi
1 Summary and Recommendations 2
1.1 Summary of Findings . . . 2
1.2 Caveats . . . 6
1.3 Future Analyses . . . 7
1.4 Recommendations for Action . . . 8
2 Introduction 10 2.1 Charge . . . 10
2.2 Process . . . 11
3 Methodology 14 3.1 Salary Comparison Units (SCUs) . . . 14
3.2 Model Specification . . . 14
3.3 Normalizations . . . 15
3.4 Interpretation . . . 16
4 Data 18 4.1 Variables: Office of the Vice Provost-Academic A↵airs dataset . . . 18
4.2 Variables: School of Medicine dataset . . . 20
5 Results 22 5.1 University of California, Davis . . . 23
5.1.1 Description . . . 23
5.1.2 Stop the Clock Program . . . 25
5.1.3 Regression analysis of total current salary . . . 26
5.1.4 Regression analysis of current o↵-scale salary . . . 27
5.1.5 Regression analysis of o↵-salary salary at time of hire . . . 28
5.2 College of Agricultural and Environmental Sciences . . . 30
5.2.1 Descriptive statistics . . . 30
5.2.2 Regression analyses . . . 32
5.2.3 Correlation between academic progress and current o↵-scale . . . 37
5.3 College of Biological Sciences . . . 39
5.3.1 Descriptive statistics . . . 39
5.3.2 Regression analyses . . . 41
5.3.3 Correlation between academic progress and current o↵-scale . . . 46
5.4 College of Engineering . . . 47
5.4.1 Descriptive statistics . . . 47
5.4.2 Regression analyses . . . 49
5.4.3 Correlation between academic progress and current o↵-scale . . . 54
5.5 Division of Humanities, Arts and Cultural Studies . . . 55
5.5.1 Descriptive statistics . . . 55
5.5.2 Regression analysis . . . 57
5.5.3 Correlation between academic progress and current o↵-scale . . . 60
5.6 Division of Mathematical and Physical Sciences . . . 62
5.6.1 Descriptive statistics . . . 62
5.6.2 Regression analysis . . . 64
5.6.3 Correlation between academic progress and current o↵-scale . . . 68
5.7 Division of Social Sciences . . . 70
5.7.1 Descriptive statistics . . . 70
5.7.2 Regression analyses . . . 72
5.7.3 Correlation between academic progress and current o↵-scale . . . 78
5.8 Betty Irene Moore School of Nursing . . . 79
5.9 Graduate School of Management . . . 80
5.9.1 Descriptive statistics . . . 80
5.9.2 Regression analyses . . . 82
5.9.3 Correlation between academic progress and current o↵-scale . . . 87
5.10 School of Education . . . 89
5.10.1 Descriptive statistics . . . 89
5.10.2 Regression analysis . . . 91
5.10.3 Correlation between academic progress and current o↵-scale . . . 94
5.11 School of Law . . . 96
5.11.1 Descriptive statistics . . . 96
5.11.2 Regression analyses . . . 98
5.11.3 Correlation between academic progress and current o↵-scale . . . 101
5.12 School of Medicine . . . 103
5.12.1 Health Sciences Compensation Plan . . . 104
5.12.2 Descriptive statistics: Ladder Rank . . . 105
5.12.3 Comment on regression analyses . . . 107
5.12.4 Regression analyses: Ladder Rank . . . 108
5.12.5 Correlation between academic progress and current o↵-scale . . . 114
5.12.6 Regression analyses: Health Sciences Clinical Professors . . . 116
5.12.7 Regression analyses: Professors of Clinical . . . 121
5.13 School of Veterinary Medicine . . . 126
5.13.1 Descriptive statistics . . . 126
5.13.2 Regression analyses . . . 128
A Charge 134
B College of Agricultural and Environmental Sciences: Supplemental tables137
C College of Biological Sciences: Supplemental tables 149
C.1 By Department . . . 149 C.2 By Salary Comparison Unit . . . 155
D College of Engineering: Supplemental tables 163
E Division of Humanities, Arts and Cultural Studies: Supplemental tables 169
F Division of Mathematical and Physical Sciences: Supplemental tables 176
G Division of Social Sciences: Supplemental tables 183
H Graduate School of Management: Supplemental tables 193
I School of Education: Supplemental tables 198
J School of Law: Supplemental tables 202
K School of Medicine: Supplemental tables 204
K.1 Health Sciences Clinical Professor series . . . 212 K.2 Professor of Clinical series . . . 214
L School of Veterinary Medicine: Supplemental tables 217
References 225
List of Figures
5.1 Relationship between academic progress and current o↵-scale salary for UCD faculty. . . 29 5.2 Current total salary of CAES faculty by rank. . . 32 5.3 Relationship between academic progress and current o↵-scale salary for CAES
faculty. . . 38 5.4 Current total salary of CBS faculty by rank. . . 41 5.5 Relationship between academic progress and current o↵-scale salary for CBS
faculty. . . 46 5.6 Current total salary of COE faculty by rank. . . 49 5.7 Relationship between academic progress and current o↵-scale salary for COE
faculty. . . 54 5.8 Current total salary of CL&S – HARCS faculty by rank. . . 56 5.9 Relationship between academic progress and current o↵-scale salary for CL&S
– HARCS faculty. . . 61 5.10 Current total salary of CL&S – MPS faculty by rank. . . 64 5.11 Relationship between academic progress and current o↵-scale salary for CL&S
– MPS faculty. . . 69 5.12 Current total salary of CL&S – DSS faculty by rank. . . 72 5.13 Relationship between academic progress and current o↵-scale salary for CL&S
– DSS faculty. . . 79 5.14 Current total salary of GSM faculty by rank. . . 82 5.15 Relationship between academic progress and current o↵-scale salary for GSM
faculty. . . 88 5.16 Current total salary of SOE faculty by rank. . . 90 5.17 Relationship between academic progress and current o↵-scale salary for SOE
faculty. . . 95 5.18 Current total salary of SOL faculty by rank. . . 97 5.19 Relationship between academic progress and current o↵-scale salary for SOL
faculty. . . 102 5.20 Current total salary of SOM Ladder Rank faculty by rank. . . 107 5.21 Current total salary of SOM Ladder Rank faculty by salary scale. . . 108 5.22 Relationship between academic progress and current o↵-scale salary for SOM
5.23 Relationship between academic progress and current o↵-scale salary for SOM
Ladder Rank clinical faculty. . . 115
5.24 Current total salary of SOM HSCP faculty by salary scale. . . 116
5.25 Current total salary of SOM Professor of Clinical series by salary scale. . . . 121
5.26 Current total salary of SVM faculty by rank. . . 128
5.27 Relationship between academic progress and current o↵-scale salary for SVM faculty. . . 133
B.1 Current total salary of CAES faculty by department. . . 138
C.1 Current total salary of CBS faculty by department. . . 149
D.1 Current total salary of COE faculty by department. . . 163
E.1 Current total salary of CL&S – HArCS faculty by department. . . 169
F.1 Current total salary of CL&S – MPS faculty by department. . . 176
G.1 Current total salary of CL&S – DSS faculty by department. . . 184
H.1 Current total salary of GSM faculty by scale. . . 193
K.1 Current total salary of SOM HSCP faculty by rank. . . 212
K.2 Current total salary of SOM Professor of Clinical fseries by rank. . . 214
L.1 Current total salary of SVM faculty by department. . . 218
List of Tables
1.1 Statistically significant e↵ects of gender and ethnicity on current salary and
current o↵-scale salary by academic unit: all faculty models. . . 3
1.2 Statistically significant e↵ects of gender and ethnicity on o↵-scale salary and interval step at time of hire. . . 4
1.3 Statistically significant e↵ects of gender and ethnicity on X + X0 + Y + Z salary in the School of Medicine. . . 5
1.4 Correlation between current o↵-scale salaries and academic progress. . . 6
5.1 Salary Comparison Unit definitions . . . 23
5.5 University of California, Davis, Ladder Rank faculty: total salary (current). . 26
5.6 University of California, Davis, Ladder Rank faculty: o↵-scale salary (current). 27 5.7 University of California, Davis, Ladder Rank faculty: o↵-scale salary at time of hire. . . 28
5.8 College of Agricultural and Environmental Sciences: salary (current). . . 31
5.9 College of Agricultural and Environmental Sciences, all Professors: total salary (current). . . 33
5.10 College of Agricultural and Environmental Sciences, all Professors: o↵-scale salary (current). . . 35
5.11 College of Agricultural and Environmental Sciences, all Professors: interval at time of hire. . . 36
5.12 College of Agricultural and Environmental Sciences, all Professors: o↵-scale salary at time of hire. . . 37
5.13 College of Biological Sciences: salary (current). . . 40
5.14 College of Biological Sciences, all Professors: total salary (current) . . . 42
5.15 College of Biological Sciences, all Professors: o↵-scale salary (current). . . 43
5.16 College of Biological Sciences, all Professors: interval at time of hire. . . 44
5.17 College of Biological Sciences, all Professors: o↵-scale salary at time of hire. . 45
5.18 College of Engineering: salary (current). . . 48
5.19 College of Engineering, all Professors: total salary (current). . . 50
5.20 College of Engineering, all Professors: o↵-scale salary (current). . . 51
5.21 College of Engineering, all Professors: interval at time of hire. . . 52
5.22 College of Engineering, all Professors: o↵-scale salary at time of hire. . . 53
5.23 Division of Humanities, Art, and Cultural Studies: salary (current). . . 55
5.24 Division of Humanities, Arts and Cultural Studies, all Professors: total salary (current). . . 57
5.25 Division of Humanities, Arts and Cultural Studies, all Professors: o↵-scale
salary (current). . . 58
5.26 Division of Humanities, Arts and Cultural Studies, all Professors: interval at time of hire. . . 59
5.27 Division of Humanities, Arts and Cultural Studies, all Professors: o↵-scale salary at time of hire. . . 60
5.28 Division of Mathematical and Physical Sciences: salary (current). . . 63
5.29 Division of Mathematical and Physical Sciences, all Professors: total salary (current). . . 65
5.30 Division of Mathematical and Physical Sciences, all Professors: o↵-scale salary (current). . . 66
5.31 Division of Mathematical and Physical Sciences, all Professors: interval at time of hire. . . 67
5.32 Division of Mathematical and Physcial Sciences, all Professors: o↵-scale salary at time of hire. . . 68
5.33 Division of Social Sciences: salary (current). . . 71
5.34 Division of Social Sciences, all Professors: total salary (current). . . 73
5.35 Division of Social Sciences, all Professors: o↵-scale salary (current). . . 75
5.36 Division of Social Sciences, all Professors: interval at time of hire. . . 76
5.37 Division of Social Sciences, all Professors: o↵-scale salary at time of hire. . . 78
5.38 Graduate School of Management: salary (current). . . 81
5.39 Graduate School of Management, all Professors: total salary (current). . . . 84
5.40 Graduate School of Management, all Professors: o↵-scale salary (current). . . 85
5.41 Graduate School of Management, all Professors: interval at time of hire. . . . 86
5.42 Graduate School of Management, all Professors: o↵-scale salary at time of hire. 87 5.43 School of Education: salary (current). . . 89
5.44 School of Education, all Professors: total salary (current). . . 91
5.45 School of Education, all Professors: o↵-scale salary (current). . . 92
5.46 School of Education, all Professors: interval at time of hire. . . 93
5.47 School of Education, all Professors: o↵-scale salary at time of hire. . . 94
5.48 School of Law: salary (current). . . 96
5.49 School of Law, all Professors: total salary (current). . . 98
5.50 School of Law, all Professors: o↵-scale salary (current). . . 99
5.51 School of Law, all Professors: interval at time of hire. . . 100
5.52 School of Law, all Professors: o↵-scale salary at time of hire. . . 101
5.53 School of Medicine Ladder Rank: salary (current). . . 106
5.54 School of Medicine, Ladder Rank faculty (basic science): X + X0 salary. . . . 109
5.55 School of Medicine, Ladder Rank faculty (basic science): X + X0 + Y salary. 110 5.56 School of Medicine, Ladder Rank faculty (basic science): Y salary. . . 110
5.57 School of Medicine, Ladder Rank faculty (basic science): X + X0 + Y + Z salary. . . 111
5.58 School of Medicine, Ladder Rank faculty (basic science): Z salary. . . 111
5.59 School of Medicine, Ladder Rank faculty (clinical): X + X0 salary. . . 112
5.60 School of Medicine, Ladder Rank faculty (clinical): X + X0 + Y salary. . . . 113 5.61 School of Medicine, Ladder Rank faculty (clinical): X + X0 + Y + Z salary. 113
5.62 School of Medicine, Ladder Rank faculty (clinical): Y salary. . . 114 5.63 School of Medicine, faculty in the HSCP series: X + X0 salary. . . 117 5.64 School of Medicine, faculty in the HSCP series: X + X0 + Y salary. . . 118 5.65 School of Medicine, faculty in the HSCP series: X + X0 + Y + Z salary. . . 118 5.66 School of Medicine, faculty in the HSCP series: Y salary. . . 119 5.67 School of Medicine, faculty in the HSCP series: Z salary. . . 120 5.68 School of Medicine, faculty in the Professor of Clinical series: X + X0 salary. 122 5.69 School of Medicine, faculty in the Professor of Clinical series: X + X0 + Y
salary. . . 123 5.70 School of Medicine, faculty in the Professor of Clinical series: Y salary. . . . 124 5.71 School of Medicine, faculty in the Professor of Clinical series: X + X0 + Y +
Z salary. . . 124 5.72 School of Medicine, faculty in the Professor of Clinical series: Z salary. . . . 125 5.73 School of Veterinary Medicine: salary (current). . . 127 5.74 School of Veterinary Medicine, all Professors: total salary (current). . . 129 5.75 School of Veterinary Medicine, all Professors: o↵-scale salary (current). . . . 130 5.76 School of Veterinary Medicine, all Professors: interval at time of hire. . . 131 5.77 School of Veterinary Medicine, all Professors: o↵-scale salary at time of hire. 132 B.1 College of Agricultural and Environmental Sciences: total salary (current). . 137 B.2 College of Agricultural and Environmental Sciences, all Professors not on BEE
pay scale: total salary (current). . . 139 B.3 College of Agricultural and Environmental Sciences, all Professors on BEE
pay scale: total salary (current). . . 139 B.4 College of Agricultural and Environmental Sciences, Assistant Professors:
to-tal salary (current). . . 140 B.5 College of Agricultural and Environmental Sciences, Associate Professors:
to-tal salary (current). . . 140 B.6 College of Agricultural and Environmental Sciences, full Professors: total
salary (current). . . 141 B.7 College of Agricultural and Environmental Sciences, Assistant Professors not
on BEE pay scale: total salary (current). . . 141 B.8 College of Agricultural and Environmental Sciences, Associate Professors not
on BEE pay scale: total salary (current). . . 142 B.9 College of Agricultural and Environmental Sciences, full Professors not on
BEE pay scale: total salary (current). . . 142 B.10 College of Agricultural and Environmental Sciences, Assistant Professors on
BEE pay scale: total salary (current). . . 143 B.11 College of Agricultural and Environmental Sciences, Associate Professors on
BEE pay scale: total salary (current). . . 143 B.12 College of Agricultural and Environmental Sciences, full Professors on BEE
pay scale: total salary (current). . . 144 B.13 College of Agricultural and Environmental Sciences, Assistant Professors: o↵
B.14 College of Agricultural and Environmental Sciences, Associate Professors: o↵
-scale salary (current). . . 145
B.15 College of Agricultural and Environmental Sciences, full Professors: o↵-scale salary (current). . . 145
B.16 College of Agricultural and Environmental Sciences, hired as Assistant Pro-fessor: step at time of hire. . . 146
B.17 College of Agricultural and Environmental Sciences, hired as Associate Pro-fessor: step at time of hire. . . 146
B.18 College of Agricultural and Environmental Sciences, hired as full Professor: step at time of hire. . . 146
B.19 College of Agricultural and Environmental Sciences, hired as Assistant Pro-fessor: o↵-scale salary at time of hire. . . 147
B.20 College of Agricultural and Environmental Sciences, hired as Associate Pro-fessor: o↵-scale salary at time of hire. . . 147
B.21 College of Agricultural and Environmental Sciences, hired as full Professor: o↵-scale salary at time of hire. . . 148
C.1 College of Biological Sciences, Assistant Professors: total salary (current). . . 150
C.2 College of Biological Sciences, Associate Professors: total salary (current). . 150
C.3 College of Biological Sciences, full Professors: total salary (current). . . 151
C.4 College of Biological Sciences, Assistant Professors: o↵-scale salary (current). 151 C.5 College of Biological Sciences, Associate Professors: o↵-scale salary (current). 152 C.6 College of Biological Sciences, full Professors: o↵-scale salary (current). . . . 152
C.7 College of Biological Sciences, hired as Assistant Professor: step at time of hire.153 C.8 College of Biological Sciences, hired as Associate Professor: step at time of hire.153 C.9 College of Biological Sciences, hired as full Professor: step at time of hire. . . 153
C.10 College of Biological Sciences, hired as Assistant Professor: o↵-scale salary at time of hire. . . 154
C.11 College of Biological Sciences, hired as Associate Professor: o↵-scale salary at time of hire. . . 154
C.12 College of Biological Sciences, hired as full Professor: o↵-scale salary at time of hire. . . 155
C.13 College of Biological Sciences: total salary (current). . . 155
C.14 College of Biological Sciences: total salary (current). . . 156
C.15 College of Biological Sciences, all Professors: total salary (current) . . . 156
C.16 College of Biological Sciences, Assistant Professors: total salary (current). . . 157
C.17 College of Biological Sciences, Associate Professors: total salary (current). . 157
C.18 College of Biological Sciences, full Professors: total salary (current). . . 158
C.19 College of Biological Sciences, all Professors: o↵-scale salary (current). . . 158
C.20 College of Biological Sciences, Assistant Professors: o↵-scale salary (current). 159 C.21 College of Biological Sciences, Associate Professors: o↵-scale salary (current). 159 C.22 College of Biological Sciences, full Professors: o↵-scale salary (current). . . . 160
C.23 College of Biological Sciences, all Professors: o↵-scale salary at time of hire. . 160
C.24 College of Biological Sciences, hired as Assistant Professor: o↵-scale salary at time of hire. . . 161
C.25 College of Biological Sciences, hired as Associate Professor: o↵-scale salary at
time of hire. . . 161
C.26 College of Biological Sciences, hired as full Professor: o↵-scale salary at time of hire. . . 162
D.1 College of Engineering, Assistant Professors: total salary (current). . . 164
D.2 College of Engineering, Associate Professors: total salary (current). . . 164
D.3 College of Engineering, full Professors: total salary (current). . . 165
D.4 College of Engineering, Assistant Professors: o↵-scale salary (current). . . 165
D.5 College of Engineering, Associate Professors: o↵-scale salary (current). . . . 165
D.6 College of Engineering, full Professors: o↵-scale salary (current). . . 166
D.7 College of Engineering, hired as Assistant Professor: step at time of hire. . . 166
D.8 College of Engineering, hired as Associate Professor: step at time of hire. . . 166
D.9 College of Engineering, hired as full Professor: step at time of hire. . . 167
D.10 College of Engineering, hired as Assistant Professor: o↵-scale salary at time of hire. . . 167
D.11 College of Engineering, hired as Associate Professor: o↵-scale salary at time of hire. . . 167
D.12 College of Engineering, hired as full Professor: o↵-scale salary at time of hire. 168 E.1 Division of Humanities, Arts and Cultural Studies, Assistant Professors: total salary (current). . . 170
E.2 Division of Humanities, Arts and Cultural Studies, Associate Professors: total salary (current). . . 170
E.3 Division of Humanities, Arts and Cultural Studies, full Professors: total salary (current). . . 171
E.4 Division of Humanities, Arts and Cultural Studies, Assistant Professors: o↵ -scale salary (current). . . 171
E.5 Division of Humanities, Arts and Cultural Studies, Associate Professors: o↵ -scale salary (current). . . 172
E.6 Division of Humanities, Arts and Cultural Studies, full Professors: o↵-scale salary (current). . . 172
E.7 Division of Humanities, Arts and Cultural Studies, hired as Assistant Profes-sor: step at time of hire. . . 173
E.8 Division of Humanities, Arts and Cultural Studies, hired as Associate Profes-sor: step at time of hire. . . 173
E.9 Division of Humanities, Arts and Cultural Studies, hired as full Professor: step at time of hire. . . 173
E.10 Division of Humanities, Arts and Cultural Studies, hired as Assistant Profes-sor: o↵-scale salary at time of hire. . . 174
E.11 Division of Humanities, Arts and Cultural Studies, hired as Associate Profes-sor: o↵-scale salary at time of hire. . . 174
E.12 Division of Humanities, Arts and Cultural Studies, hired as full Professor: o↵-scale salary at time of hire. . . 175
F.1 Division of Mathematical and Physcial Sciences, Assistant Professors: total salary (current). . . 177 F.2 Division of Mathematical and Physcial Sciences, Associate Professors: total
salary (current). . . 177 F.3 Division of Mathematical and Physical Sciences, full Professors: total salary
(current). . . 178 F.4 Division of Mathematical and Physical Sciences, Assistant Professors: o↵-scale
salary (current). . . 178 F.5 Division of Mathematical and Physical Sciences, Associate Professors: o↵
-scale salary (current). . . 179 F.6 Division of Mathematical and Physical Sciences, full Professors: o↵-scale
salary (current). . . 179 F.7 Division of Mathematical and Physical Sciences, hired as Assistant Professor:
step at time of hire. . . 180 F.8 Division of Mathematical and Physical Sciences, hired as Associate Professor:
step at time of hire. . . 180 F.9 Division of Mathematical and Physical Sciences, hired as full Professor: step
at time of hire. . . 180 F.10 Division of Mathematical and Physcial Sciences, hired as Assistant Professor:
o↵-scale salary at time of hire. . . 181 F.11 Division of Mathematical and Physical Sciences, hired as Associate Professor:
o↵-scale salary at time of hire. . . 181 F.12 Division of Mathematical and Physcial Sciences, hired as full Professor: o↵
-scale salary at time of hire. . . 182 G.1 Division of Social Sciences: total salary (current). . . 183 G.2 Division of Social Sciences, Assistant Professors: total salary (current). . . . 184 G.3 Division of Social Sciences, Associate Professors: total salary (current). . . . 185 G.4 Division of Social Sciences, full Professors: total salary (current). . . 185 G.5 Division of Social Sciences, Assistant Professors: o↵-scale salary (current). . 186 G.6 Division of Social Sciences, Associate Professors: o↵-scale salary (current). . 186 G.7 Division of Social Sciences, full Professors: o↵-scale salary (current). . . 187 G.8 Division of Social Sciences, hired as Assistant Professor: step at time of hire. 187 G.9 Division of Social Sciences, hired as Associate Professor: step at time of hire. 187 G.10 Division of Social Sciences, hired as full Professor: step at time of hire. . . . 188 G.11 Division of Social Sciences, all Professors on BEE pay scale: o↵-scale salary
at time of hire. . . 188 G.12 Division of Social Sciences, all Professors not on BEE pay scale: o↵-scale
salary at time of hire. . . 189 G.13 Division of Social Sciences, hired as Assistant Professor: o↵-scale salary at
time of hire. . . 189 G.14 Division of Social Sciences, hired as Associate Professor: o↵-scale salary at
time of hire. . . 190 G.15 Division of Social Sciences, hired as full Professor: o↵-scale salary at time of
hire. . . 190
G.16 Division of Social Sciences, hired as Assistant Professor not on BEE pay scale:
o↵-scale salary at time of hire. . . 191
G.17 Division of Social Sciences, hired as Associate Professor not on BEE pay scale: o↵-scale salary at time of hire. . . 191
G.18 Division of Social Sciences, hired as full Professor not on BEE pay scale: o↵-scale salary at time of hire. . . 192
H.1 Graduate School of Management, Assistant Professors: total salary (current). 194 H.2 Graduate School of Management, Associate Professors: total salary (current). 194 H.3 Graduate School of Management, full Professors: total salary (current). . . . 194
H.4 Graduate School of Management, full Professors: o↵-scale salary (current). . 195
H.5 Graduate School of Management, hired as Assistant Professor: step at time of hire. . . 195
H.6 Graduate School of Management, hired as Associate Professor: step at time of hire. . . 195
H.7 Graduate School of Management, hired as full Professor: step at time of hire. 196 H.8 Graduate School of Management, hired as Assistant Professor: o↵-scale salary at time of hire. . . 196
H.9 Graduate School of Management, hired as Associate Professor: o↵-scale salary at time of hire. . . 196
H.10 Graduate School of Management, hired as full Professor: o↵-scale salary at time of hire. . . 197
I.1 School of Education, Assistant Professors: total salary (current). . . 198
I.2 School of Education, Associate Professors: total salary (current). . . 198
I.3 School of Education, full Professors: total salary (current). . . 199
I.4 School of Education, Assistant Professors: o↵-scale salary (current). . . 199
I.5 School of Education, Associate Professors: o↵-scale salary (current). . . 199
I.6 School of Education, full Professors: o↵-scale salary (current). . . 200
I.7 School of Education, hired as Assistant Professor: step at time of hire. . . . 200
I.8 School of Education, hired as full Professor: step at time of hire. . . 200
I.9 School of Education, hired as Assistant Professor: o↵-scale salary at time of hire. . . 201
I.10 School of Education, hired as full Professor: o↵-scale salary at time of hire. . 201
J.1 School of Law, hired as Acting Professor: step at time of hire. . . 202
J.2 School of Law, hired as full Professor: step at time of hire. . . 202
J.3 School of Law, hired as Acting Professor: o↵-scale salary at time of hire. . . 203
J.4 School of Law, hired as full Professor: o↵-scale salary at time of hire. . . 203
K.1 Summary of Academic Series in the SoM . . . 204
K.2 School of Medicine: X + X0 salary. . . 205
K.3 School of Medicine: X + X0 + Y salary. . . 206
K.4 School of Medicine: X + X0 + Y + Z salary. . . 207
K.5 School of Medicine: Y salary. . . 208
K.7 Statistically significant e↵ects of gender and ethnicity on salary in the School of Medicine. . . 210 K.8 School of Medicine, Ladder Rank faculty (clinical): X + X0 salary. . . 211 K.9 School of Medicine, Ladder Rank faculty (clinical): X + X0 + Y salary. . . . 211 K.10 School of Medicine, Ladder Rank faculty (clinical): X + X0 + Y + Z salary. 211 K.11 School of Medicine, faculty in the HSCP series: X + X0 salary. . . 213 K.12 School of Medicine, faculty in the Professor of Clinical series: X + X0 salary. 215 K.13 School of Medicine, faculty in the Professor of Clinical series: X + X0 + Y
salary. . . 215 K.14 School of Medicine, faculty in the Professor of Clinical series: X + X0 + Y +
Z salary. . . 215 K.15 School of Medicine, faculty in the Professor of Clinical series: Y salary. . . . 216 K.16 School of Medicine, faculty in the Professor of Clinical series: Z salary. . . . 216 L.1 School of Veterinary Medicine: total salary (current). . . 217 L.2 School of Veterinary Medicine, Assistant Professors: total salary (current). . 219 L.3 School of Veterinary Medicine, Associate Professors: total salary (current). . 219 L.4 School of Veterinary Medicine, full Professors: total salary (current). . . 220 L.5 School of Veterinary Medicine, Assistant Professors: o↵-scale salary (current). 220 L.6 School of Veterinary Medicine, Associate Professors: o↵-scale salary (current). 221 L.7 School of Veterinary Medicine, full Professors: o↵-scale salary (current). . . . 221 L.8 School of Veterinary Medicine, hired as Assistant Professor: step at time of
hire. . . 222 L.9 School of Veterinary Medicine, hired as Associate Professor: step at time of
hire. . . 222 L.10 School of Veterinary Medicine, hired as full Professor: step at time of hire. . 222 L.11 School of Veterinary Medicine, hired as Assistant Professor: o↵-scale salary
at time of hire. . . 223 L.12 School of Veterinary Medicine, hired as Associate Professor: o↵-scale salary
at time of hire. . . 223 L.13 School of Veterinary Medicine, hired as full Professor: o↵-scale salary at time
of hire. . . 224
Abbreviations
Academic Programmatic Units APU
Business/Economics and Engineering salary plan BEE College of Agriculture and Environmental Sciences CAES College of Biological Sciences CBS
College of Engineering COE
College of Letters and Science CL&S Division of Humanities, Arts, and Cultural Studies HARCS Division of Mathematical and Physical Sciences MPS
Division of Social Sciences DSS
Graduate School of Management GSM
Health Sciences Clinical HSC
Salary Comparison Unit SCU
School of Education SOE
School of Law SOL
School of Medicine SOM
Betty Irene Moore School of Nursing BIMSON
School of Veterinary Medicine SVM
Underrepresented Minority URM
Summary and Recommendations
This report examined faculty salaries in order to address the possible presence of inequities associated with gender or ethnicity. Data were provided by the Office of the Vice Provost-Academic A↵airs as well as by the School of Medicine.
Due to the remarkable diversity of schools and colleges at UC Davis, the majority of the analysis was conducted at the level of the academic unit or below. The main analyses are accompanied by analyses disaggregated by current rank, rank at hire, and pay scale, as appropriate. There was one exception to this choice of level. Evaluating faculty salary equity ideally should include examining the impact of programs designed to enhance faculty diversity in multiple dimensions. A specific program of interest to UC Davis was utilization of the “Stop the Clock” program for faculty who have primary responsibility for the care of a newborn or adopted child. Assistant Professors can, with rare exceptions, take one year o↵
the tenure clock for each child up to a total of two years. A relatively small share of current UC Davis faculty, 6%, have utilized the program, necessitating its evaluation at the campus level.
1.1
Summary of Findings
The most common finding across the analyses for the campus, individual academic units, and more disaggregated analyses was that faculty hired earlier in time had lower current total and o↵-scale salaries, had been appointed at lower interval steps, and had lower o↵-scale salaries at time of hire.
At the campus level, gender and ethnicity were not statistically significant determinants of current salary, when women, Asians, Underrepresented Minorities (URM) are compared to white men. Participation in the Stop the Clock Program had a negative and statistically significant e↵ect (P<0.05). Regarding current o↵-scale salary, gender and Stop the Clock had a significant interaction: women who utilized Stop the Clock had lower current o↵-scale salaries, and the e↵ect was highly significant (P<0.01). Women who did not utilize Stop the Clock had higher o↵-scale salaries (P<0.05), as did URMs (P<0.05). For purposes of comparison with the unit analyses, the determinants of o↵-scale salary at time of hire were also estimated. URM faculty had higher initial o↵-scale salaries, although the e↵ect was only weakly significant (P<0.10).
In the analyses conducted at the college or school level, there were very few statistically significant gender or ethnicity di↵erences. Of those present, roughly half were significant
1.1. Summary of Findings
only at the P<0.10 level. Table 1.1 summarizes the results of the college/school analyses of current total salary and current o↵-scale salary. DSS results are also reported by pay scale due to the existence of one (weakly) statistically significant di↵erence when the population is disaggregated. There was only one significant di↵erence in current salaries: Asians in the SOL had higher salaries (P<0.05). Regarding current o↵-scale salary, URMs in HArCS had higher salaries (P<0.05). Two additional e↵ects were weakly statistically significant (P<0.10): women on the regular pay scale in DSS had lower salaries and Asians in SOL has higher salaries.
Table 1.2 summarizes the results of the college/school analyses of o↵-scale salary and interval step at the time of hire. With one exception there were no gender or ethnicity-based di↵erences in o↵-scale at time of hire. URMs obtained higher o↵-scale salaries in the SOL, although the e↵ect was only weakly significant. In contrast, there were several statistically significant gender or ethnicity di↵erences in the interval step at the time of hire regression models. Women were hired at a lower interval step in three units: CAES, CBS, and DSS. The negative e↵ects in CAES and CBS were highly statistically significant (P<0.01), while the e↵ect in DSS was weakly significant (P<0.01). Asians were hired at a higher interval step in GSM and SVM, although both e↵ects were only weakly significant. URMs were hired at a lower interval step in COE, and the e↵ect was highly statistically significant.
Table 1.1: Statistically significant e↵ects of gender and ethnicity on current salary and current
o↵-scale salary by academic unit: all faculty models.
Current total salary Current o↵-scale salary Unit N Female Asian URM Female Asian URM
CAES 269 · · · · CBS 108 · · · · · · COE 171 · · · · HArCS 185 · · · +, P<.05 MPS 156 · · · · · · DSS 197 · · · · · · DSS: BEE 27 · · · · DSS: non-BEE 170 · · · -, P<.10 · · GSM 29 · · · · · · SOE 26 · · · · SOL 34 · +, P<.05 · · +, P <.10 ·
SOM 205 See Table 1.3
SVM 110 · · · ·
1.1. Summary of Findings
Faculty compensation in the School of Medicine (SOM) is complex, due to multiple compensation components and faculty titles. While not all data available for other campus faculty were available for SOM ladder rank faculty, the analysis was able to address Health Sciences Clinical Professors and Professors of Clinical X in addition to ladder faculty. Ladder faculty were divided into two disciplines: basic and clinical sciences. In addition to total salaries, various salary components were addressed. (See the 5.12 SOM results section for a discussion of these components.)
Table 1.2: Statistically significant e↵ects of gender and ethnicity on o↵-scale salary and interval
step at time of hire.
O↵-scale salary at hire Interval step at hire Unit N Female Asian URM Female Asian URM
CAES 269 · · · -, P< .10 · · CBS 108 · · · -, P< .10 · · COE 171 · · · · · -, P< .10 HArCS 185 · · · · · · MPS 156 · · · · DSS 197 · · · -, P< .10 · · GSM 29 · · · · +, P <.10 · SOE 26 · · · · SOL 34 · · +, P <.10 · · ·
SOM 205 Data not available
SVM 110 · · · · +, P <.10 ·
Note: +; positive. –; negative. ·; no significant e↵ect.
1.1. Summary of Findings
Table 1.3 summarizes the results for total salaries only. There were no statistically significant gender or ethnicity salary di↵erences found for Ladder Rank basic science faculty, nor were there any statistically significant interactions between gender and ethnicity variables and scale to consider because faculty in this title and discipline are virtually all in the same subset of scales. In contrast, among Ladder Rank faculty in clinical disciplines, Asian faculty in Scales 7–9 had lower total salaries. Female and Asian faculty in the Health Sciences Clinical Professors series had lower total salaries. In the Professor of Clinical series significantly lower total salaries were observed for female faculty at higher scales. These outcomes are presented in the Results section 5.12.
Table 1.3: Statistically significant e↵ects of gender and ethnicity on X + X0 + Y + Z salary in the School of Medicine.
Female Asian URM Statistically significant interactions ladder-rank basic science
· · · ·
ladder-rank clinical
· · · Asian x Scale 7–9. -; P<0.05 Health Science Clinical Professors
-; P<0.01 -; P<0.05 · ·
Professor of Clinical
· · · Female x Scale 4–6. -; P<0.05 Female x Scale 7-9. -; P<0.05 Ethnicity scale interactions omitted
1.2. Caveats
Table 1.4 summarizes the correlation measures between current o↵-scale salaries and academic progress. School of Medicine o↵-scale compensation is divided by type of primary faculty appointment (basic science vs. clinical) and type of compensation Y or Y+Z (clinical only). There are two notable features of the table. First, the correlations between the two are uniformly low. Second, the remaining variability in o↵-scale salaries must be explained by factors that are not considered in the personnel process. Even in the college with the highest correlation between these factors, academic progress could only explain 25% of the variability in current o↵-scale salaries.
Table 1.4: Correlation between current o↵-scale salaries and academic progress.
Unit Correlation Coefficient
P-value CAES 0.09 0.16 CBS 0.53 <0.0001 COE 0.33 <0.0001 CL&S – HArCS 0.11 0.15 CL&S – MPS 0.33 <0.0001 CL&S – DSS 0.27 0.0002 GSM 0.12 0.55 SOE 0.11 0.61 SOL 0.34 0.05 SOM Y basic -0.04 0.33 Y clinical 0.28 <0.0001 Y+Z clinical 0.25 <0.0001 SVM 0.19 0.05
1.2
Caveats
There are a number of caveats associated with the analyses presented here. First, the analyses excluded summer salary, due in part to the inability to di↵erentiate it by source, and also because public funding of faculty salaries at UC is intrinsically within the oversight of the UC Regents, unlike private funding of individuals (provided this does not conflict with compensation rules). Second, the analysis relied on conventional statistical methods, especially linear models, as discussed in the methodology section. More extensive analysis into determinants of salaries could enrich or alter the results. Third, not all data were available for SOM faculty that were available for other faculty, so the nature of the analysis for SOM is di↵erent. Finally, the academic units vary greatly in size which should be taken into account when assessing the results.
1.3. Future Analyses
1.3
Future Analyses
A number of additional considerations and possibilities for future analysis were identified during the preparation of the report. They fall into three categories: 1) defining the variables of interest di↵erently, 2) additional data to collect, and 3) additional analyses to conduct.
There are various ways to redefine the variables of interest. This report excluded summer salaries, as noted above. Redefining total salary to include summer salary may alter the results. Another suggestion for the appropriate unit of total compensation was to normalize by month of e↵ort; this could include summer salary. This approach was proposed as an alternative to normalizing salaries to either a fiscal or academic year. A third possibility that was o↵ered was to analyze total compensation based on a hypothetical 12-month maximum salary, regardless of the months of e↵ort an individual actually undertook.
As a result of conducting this analysis, the Task Force has several recommendations that it believes would increase the value of future equity studies. First, a number of faculty members are still reported as having ethnicity “unknown.” To the extent that this number can be reduced through voluntary reporting or be redefined as “decline to state” a source of ambiguity in the analysis can be removed. Second, while by all accounts retention o↵ers in response to outside recruitment o↵ers are a critical determinant of o↵-scale salaries, no reli-able data are availreli-able to support this assumption. More broadly, regularizing the collection of data on the reasons for all changes in o↵-scale would provide information not only on the importance of retentions, but also on the number and magnitude of any equity adjustments made by deans.
Additional data to collect would include information on summer salaries and the source of those funds. Knowing the source would allow the di↵erentiation of summer salary earned from grants and from other sources, with the exception of the SOM. As noted above under recommendations, data regarding retention e↵orts and their relationship with o↵-scale salary would be valuable. Alternative metrics for advancement, including time at rank, could also be explored.
The charge of the Task Force was to examine salaries for Ladder Rank faculty. An additional analysis that would be of particular value to CAES, SOM, and SVM would be to utilize the same approach for examining the salaries of Academic Federation members. Other additional analyses would be to model salary inequities for a broader range of SCUs. Another option would be to include whether a faculty member is on an academic year or a fiscal year appointment as a dummy variable.
School of Medicine
Future data collection and analysis for the School of Medicine must take into account many factors that di↵erentiate it from other UC Davis academic units. The School of Medicine is a complex entity that includes 800+ faculty in five distinct faculty series. Each faculty member has, in addition to his/her faculty series designation, a Departmental and possible Divisional affiliation, an associated rank and step, an assigned APU, and varied associated duties stemming from basic science to clinical research and/or innovation, clinical duties, teaching, training, administration, and intramural and extramural service responsibilities. The SOM contains much variation among the faculty, and so it is challenging to devise a
1.4. Recommendations for Action
salary equity analysis that captures all of these complexities and makes comparisons between faculty members in a meaningful way. An additional complication is that a large fraction of SOM faculty (39%) is not represented by the Academic Senate. Health Sciences Clinical Professors and Adjunct faculty are members of an alternative governing body unique to UC Davis, the Academic Federation. There is faculty movement between academic series that is not captured in the current analysis, and inequities may exist between series that are not captured in our current analysis. It is notable that there are stark disparities in gender distributions between the academic series: women are more represented among faculty in the HSCP series (42%), a clinical series with no protected time for scholarly activities, and as such are not voting members of the Academic Senate. Future analyses might include a focus on the reasons for very low representation of women among ladder faculty (21%) and in the Academic Senate clinical series Clinical (34%).
1.4
Recommendations for Action
The decision to conduct college and school-specific analyses was made for technical and organizational accountability reasons. From the technical perspective, an analysis performed on a university-wide scale with statistical control for academic units (and sub-units such as departments, specialized pay scales, etc.) constrains results to be average e↵ects across the units. This has the potential to obscure heterogeneity of gender and ethnicity e↵ects across units as the trade-o↵ for the presentation of more easily understood synoptic e↵ects (as was done when using the campus-level analysis to evaluate the impacts of Stop the Clock). When true e↵ects are present within units, and the populace of such units is small relative to the campus population, they can be averaged out and go unrecognized. This problem becomes particularly exacerbated when the joint distributions of gender, ethnicity, and other covariates embedded in statistical models lead to sparse data. Fitting larger models that account for such heterogeneity is not uniformly successful. For these reasons, we believed it was imperative to explore such sources of heterogeneity, and our findings affirm the value of doing so.
In terms of accountability, an additional rationale for such analyses recalls the charge to the Task Force from then President Yudof: “I expect campuses to address any pattern of discriminatory salary di↵erences that are uncovered through such studies and to examine individual outlier cases in their full context.” Deans at UC Davis recently became empowered to address and redress financial inequities within their own college/school, so the finding of average e↵ects across the university may not be of particular relevance to them. In order to begin to rectify the problem, it is incumbent to first recognize the problem, and that must occur at the individual unit level. This is particularly important under the present budget model that distributes more resources to units than in the past. With such resources comes responsibility, however, and for this reason the Task Force urges the Provost to consider progress in addressing financial inequities as part of the annual and five-year review of deans. Finally, it is also worth remembering that what is true on average is not necessarily true in individuals. While this report found little evidence of systematic salaries disparities as a function of gender and ethnicity, it nevertheless found substantial evidence of individual-level disparities that are functions of other factors, especially the disadvantage associated
1.4. Recommendations for Action
with earlier decade of hire. The results of this report are consistent with the existence of a “loyalty tax.” Faculty members who have more years of service at UC Davis are paid less after controlling for the other variables considered here. There are no doubt other factors that contribute to disproportionately low individual salaries; one alluded to above is the failure to obtain outside recruitment o↵ers. Examining the extent to which faculty members who do not pursue outside o↵ers also pay a form of a loyalty tax requires additional data. In the opinion of the Task Force, it is antithetical to presume that universities outside the UC system are better evaluators of faculty worth than our own university, and so they should not be allowed to remain important drivers of salary inequity.
Of course, the counter-argument regarding these considerations is that current total and o↵-scale salaries represent the quality of faculty members’ academic records. The Task Force analyzed the relationship between faculty progress through the merit process and current o↵-scale salary. Remarkably, faculty progress was not a driver of salary equity: there was an astonishing dissociation between progress rate and o↵-scale salaries. That a minimum of 75% of such variability (and often considerably more) in o↵-scale salaries can be explained by non-academic factors should give considerable pause to those in a position to reverse and ameliorate these inequities. Until such time comes that system-wide base academic salaries sufficiently rise to subsume most o↵-scale salaries, restoring some semblance of uniform usage of salary scales that conform to those of other universities, solutions must inevitably arise as a proactive partnership between the central campus and the unit deans.
The campus has made a significant investment in the physical infrastructure required for increased student enrollment; however, this report forcefully shows that there has not been a commensurate investment in our existing and valued human capital, leaving a consequential subset of our faculty lagging behind. Rather than waiting, perhaps interminably, for the State of California or the UC Office of the President to solve our problems, the inequities arising from di↵erential investments in our faculty must out of fairness and justice become a high priority for UC Davis when allocating financial resources in the coming years.
Introduction
The genesis of this faculty salary equity analysis can be traced back to then-UC Execu-tive Vice President and Provost Lawrence Pitts’ appointment of a University of California Senate-Administration Task force on Faculty Salaries on March 14, 2011. A Report from this Task force, including its recommendations dated February 24, 2012 can be found at: Recommendation on long-term faculty salaries.
The subsequent divisional Academic Senate responses to it from May 14, 2012 can be found at: Academic Senate Response.
Due in part to the Task force’s somewhat controversial recommendations, which failed to garner uniform support by the divisions of the Academic Senate across the UC campuses, then-UC President Mark G. Yudof issued on September 11, 2012 a directive to all Chancellors “to implement a series of actions on your campus to address issues of faculty salary equity” (Appendix A).
On the Davis campus the initial response to the President’s directive was the constitution of a Joint Administration-Academic Senate Task Force on Analysis of Faculty Salary Equity to advise the Chancellor on how to initiate a salary equity analysis. The membership of this Task Force, and its November 2013 Report [heretofore referred to as the 2013 Report], can be found at: 2013 Report.
Among the recommendations of this report was the establishment of the present Joint Administration-Academic Senate Oversight Task Force on Faculty Salary Equity Analyses
[heretofore referred to as the “Task Force”] to undertake data collection and oversee analysis of faculty salary equity at UC Davis. The product of this Task Force (which is the current document) was intended to be a comprehensive report provided to both the Davis Division of the Academic Senate as well as the UC Davis administrative officers for comment prior its submission to the UC Office of the President by January 1, 2015.
2.1
Charge
As indicated in President Yudof’s directive, campuses were asked to take the following ac-tions:
“Each campus will determine the administrators and faculty committees who will be involved in the faculty salary analysis; the period of salary equity reviews (annual, biannual, other); the units to be studied; plans for addressing and re-porting any pattern of discriminatory salary di↵erences; and the methodology
2.2. Process
to be employed. Campuses may elect to continue current studies that are al-ready analyzing salary equity and they may choose to make this analysis a part of standard reports, like the academic Affirmative Action report, as appropri-ate. Findings should be transparent and accessible to the campus. ... I expect campuses to address any pattern of discriminatory salary di↵erences that are uncovered through such studies and to examine individual outlier cases in their full context.”
The Task Force agreed that six issues, however important, were not within its scope and hence were not pursued further. These included: 1) initiating a process for departments or colleges/schools to develop objective evidence-based metrics for advancement, as addressed and recommended in the 2013 Report; 2) evaluating possible gender and ethnicity-based disparities in advancement within and across ranks; the latter is addressed in a separate report from the Office of Academic A↵airs; 3) the role of retention o↵ers on o↵-scale salaries; 4) comprehensive analyses of non-ladder rank faculty; 5) examining the standing of UC Davis salaries relative to those of other UC campuses; 6) examining the standing of UC Davis salaries relative to those of other universities.
2.2
Process
In Spring 2014 Vice Provost Maureen Stanton and UC Davis Academic Senate Chair Bruno Nachtergaele agreed to constitute a task force to oversee the UC Davis salary equity analysis. This task force, constituted in June, 2014, is composed of four representatives from the campus administration and four representatives from the Academic Senate (that were chosen by the Committee on Committees). The Task Force membership includes:
Edward Callahan Associate Dean, School of Medicine and Professor, Department of Family and Community Medicine
Colleen Clancy Chair, Compensation Advisory Committee, School of Medicine and Profes-sor, Department of Pharmacology, School of Medicine
Steven Currall Dean Emeritus, Graduate School of Management and Chancellor’s Advisor Rachael Goodhue* Vice Chair, Academic Senate and Professor, Department of Agricultural and
Resource Economics
Philip Kass* Associate Vice Provost for Faculty Equity and Inclusion and Professor, De-partment of Population Health and Reproduction
Lori Lubin Chair, Committee on Faculty Welfare and Professor, Department of Physics Andrea Quintero Postdoctoral Scholar, Academic A↵airs, Offices of the Chancellor and
Provost and UC Davis ADVANCE Program Saul Schaefer Professor, Department of Internal Medicine
Everett Wilson Data Management and Analysis Coordinator, Academic A↵airs, Offices of the Chancellor and Provost
2.2. Process
The Task Force began meeting shortly after it was constituted to select a postdoctoral scholar proficient in statistics to perform the analyses contained in this Report. It then met on a regular basis to define the campus’ approach to fulfilling its charge. It also reached consensus early on that because of the many disparate and unique units on the campus it would be preferable to conduct separate analyses on each of them and explore their potential heterogeneity with respect to determinants of salary equity. The University is comprised of the following colleges and schools:
Academic unit Ladder faculty
College of Agriculture and Environmental Sciences 269 College of Biological Sciences 108 College of Engineering 171 College of Letters and Science
Division of Humanities, Arts, and Cultural Studies 185 Division of Mathematical and Physical Sciences 156 Division of Social Sciences 197 Graduate School of Management 29
School of Education 26
School of Law 34
School of Medicine 189
Betty Irene Moore School of Nursing 16 School of Veterinary Medicine 110
The 2013 Report recommended the establishment of “Salary Comparison Units” (SCU), defined as collections of faculty within which salaries are to be compared and who share the same salary reference standard. The SCU were established following consultation with the leadership (deans and/or associate deans) and Faculty Executive Committees in each of the four colleges (one of which is divided into three divisions), and six schools (n.b., in this Report, the Betty Irene Moore School of Nursing is included with the School of Medicine). The choices of SCU will be addressed in the unit-specific sections of this Report.
The Task Force met weekly to review interim results, suggest additional analyses, and select which analyses should be included in the body of the report or its Appendix. On September 12, 2014 Vice Provost-Academic A↵airs Stanton transmitted a request from the Task Force co-chairs to Deans and Academic Senate Faculty Executive Committee Chairs to meet and discuss appropriate SCUs. The Task Force co-chairs met individually or jointly with members of the academic unit administration and Academic Senate Faculty Executive Committee members of the following units:
2.2. Process
Academic unit Meeting date
College of Agriculture and Environmental Sciences October 17 College of Biological Sciences September 30 College of Engineering October 13 College of Letters and Science
Division of Humanities, Arts, and Cultural Studies October 10 Division of Mathematical and Physical Sciences October 17 Division of Social Sciences October 21 Graduate School of Management September 29 School of Education October 29
School of Law October 8
School of Medicine and
Betty Irene Moore School of Nursing October 22 School of Veterinary Medicine October 2
Methodology
Executing the analysis requires specifying the models, the statistical methods used to esti-mate each model, and the population of faculty used for the estimation of each model.
3.1
Salary Comparison Units (SCUs)
One of the key initial considerations as the Task Force began this undertaking was the selection of an appropriate set of faculty for evaluating the determinants of salaries, referred to as the salary comparison unit, or SCU. The decision to conduct analyses that either controlled for or individually studied SCUs was commensurate with the recommendations of the earlier generation UC Davis Joint Administration-Academic Senate Task Force on Analysis of Faculty Salary Equity. The choice of SCU involves a tradeo↵ between model specification validity and precision. The larger the set of faculty, the greater the potential for the model to estimate e↵ects with sufficient precision to be statistically significant. However, the larger the set of faculty, the less homogeneous units (and hence nested individuals) are likely to be, making the models potentially less useful due to obfuscation of e↵ects. Because of the number and remarkable diversity of the colleges and schools at UC Davis, solely approaching this work through inclusion of the entire faculty in a single statistical model did not seem propitious nor advisable. As a starting point, the Task Force chose academic units (colleges and schools) as SCUs. This approach was then refined through consultations with deans and faculty executive committee members for each unit, as discussed in the introduction. Analytic strategies that include when: 1) faculty within an academic unit are separated into di↵erent SCUs entirely; 2) indicator variables are used to control for SCU; and 3) indicator variables are used to allow the e↵ects of other factors to vary across SCUs are described at the beginning of the sections devoted to the findings for the relevant academic unit.
3.2
Model Specification
The Task Force was charged with evaluating determinants of current faculty salaries, in-cluding gender and ethnicity. Linear regressions were used throughout this report to model the salaries. Recognizing that base salaries should strictly be a function of rank, step, and the appropriate published salary scale, variations in o↵-scale salaries, both current and at the time of appointment, are an important component of variation in current total salaries
3.3. Normalizations
and were modeled separately, using the same explanatory variables as models for current total salaries. Due to their skewed distribution, salaries were transformed using natural log-arithms for the analyses. Because many faculty members had no o↵-scale salary, $1.00 was added to the amount before performing the adjustment. Secondary explanatory variables were included in each regression model: 1) decade of hire; 2) start after degree, the number of years between hire and terminal degree; and 3)interval, an ordinal scale variable combining non-overlapping ranks and steps (because di↵erences in rank and step at the time of appointment could conceivably be sources of di↵erences in current salaries). When appro-priate, models included an additional salary comparison unit variable. All regression models contrasted: 1) women to men, 2) each ethnic identification group’s faculty to White faculty, and 3) decade of hire within the past ten years (2014–2005) to previous decades until 1984– 1975. Ten faculty members hired prior to 1975 were not included in the regression analyses. In cases in which all faculty members were hired within the same decade, to ensure that each intercept corresponded to the current year, the year of hire was subtracted from the current year of 2014. One set of regressions modeled di↵erences in salary based on gender and ethnic identification, while controlling for other factors, for Ladder Rank faculty across campus units. Minimally, two additional sets of models were conducted: one at the unit level across the three academic ranks, and another set separately for Assistant, Associate, and full Professors. For this final set of rank-specific models, the interval variable was replaced by step within rank. The range consisted of Steps 1–6 for Assistant Professors, Steps 1–5 for Associate Professors, and Steps 1 to above scale for full Professors. In some units the number of Ladder Rank faculty was small, and a full set of variables could not be modeled. Secondary variables were removed from analysis in the following order: step within rank, start time after degree, and decade of hire in order until a model could be fit.
3.3
Normalizations
Two normalizations were required for the analysis. First, in order to compare starting salaries for current employees, salaries were converted to real dollars using the Consumer Price Index for All Urban Consumers (Bureau of Labor Statistics 2014). To reflect current conditions, salaries were converted using 2013 as the base year. Second, approximately half of UC Davis faculty members are paid on a 9-month (academic year) basis and approximately half are paid on an 11-month (fiscal year) basis. Faculty members on the 11-month scale are virtually all in the College of Agriculture and Environmental Sciences (CAES), the College of Biological Sciences (CBS), the School of Medicine (SOM) and the School of Veterinary Medicine (SVM). Other academic units are predominantly or exclusively on the 9-month scale. With the exception of CAES and CBS, a clear majority of the faculty in each unit are on one of the two scales, and that scale is used for the statistical analyses of that unit. Because there is no strong majority of either in CAES and CBS, this report adheres to the recommendation of the prior UC Davis Joint Administration-Academic Senate Task Force on Analysis of Faculty Salary Equity to normalize salaries to an 11-month scale. Absolute salary numbers for these two units need to be interpreted while keeping this conversion in mind.
3.4. Interpretation
3.4
Interpretation
For readers unfamiliar with some of the notation and graphics included in this report, we provide below some brief explanations to facilitate understanding.
First, many findings are accompanied by “P-values.” In most cases these reflect the probability of observing positive regression coefficients at least as large (or negative regression coefficients as small) as those estimated in the analyses when, in reality, the coefficient equals zero. That is, when a variable has no association with the outcome in the analyses (the “null hypothesis”), the coefficient is expected to be close to zero. A positive association is reflected by a positive coefficient, and the converse holds for negative coefficients. The smaller the P-value, the less compatible the data are with the null hypothesis. Three levels of statistical significance (which reflect judgments about how compatible the evidence is with the null hypothesis) are reported: weakly significant (P<0.10), significant (P <0.05), and strongly significant (P < 0.01). The use of ‘weakly’ and ‘strongly’ are used to provide subjective interpretation to relative significance levels, and are not qualitative judgements about the direction or magnitude of di↵erences or e↵ects. The smaller the P-value, the more likely one would be to abandon the null hypothesis in favor of an alternate one favoring the presence of an actual association.
Two forms of regression analyses are included in this report. The more common one, linear regression, is used to model the relationship between a continuous outcome (such as the logarithmic transform of salary) and one or more predictor variables, which may be continuous or semi-continuous (e.g., rank/step interval), ordinal (e.g., decade of hire), or nominal (e.g., gender or ethnicity). The strength of the linear relationship between the pre-dictor variables and the outcome variable is measured by the correlation coefficient (r): a positive r indicates a positive relationship between the linear predictors and the outcome, and a negative r indicates a negative relationship. In this report correlation coefficients are used to show the relationship between academic progress (where 1 = normative progress;
< 1 = delayed progress, and > 1 = accelerated progress) and o↵-scale salaries in dollars. If data were perfectly correlated, all points in a scatterplot would lie on a straight line; if the slope of the line was positive, the correlation coefficient would be 1.0, and the con-verse would also be true. Correlation coefficients are accompanied by P-values. The null hypothesis of no association between predictor variables and the outcome corresponds to a correlation coefficient of zero. The smaller the P-value, the less likely it is that the true correlation coefficient is actually zero. For additional detail about correlation coefficients, see: Interpreting results: Correlation.
Not all outcomes in this analysis are continuous, though. We also address how factors potentially a↵ect the step of hire for Assistant, Associate, and full Professors. This outcome is ordinal, rather than continuous, so an alternate form of regression called ordered (ordinal) logistic regression was used. The null hypothesis of no association is similar to the one above (meaning the coefficients are expected to be close to zero), and the P-values have the same interpretation as with linear regression.
In this report we chose not to attempt to provide literal interpretations to each of the regression coefficients given the logarithmic transformations used. Instead, associations are described with respect to their level of significance (or non-significance), as well as their
3.4. Interpretation
direction (positive or negative).
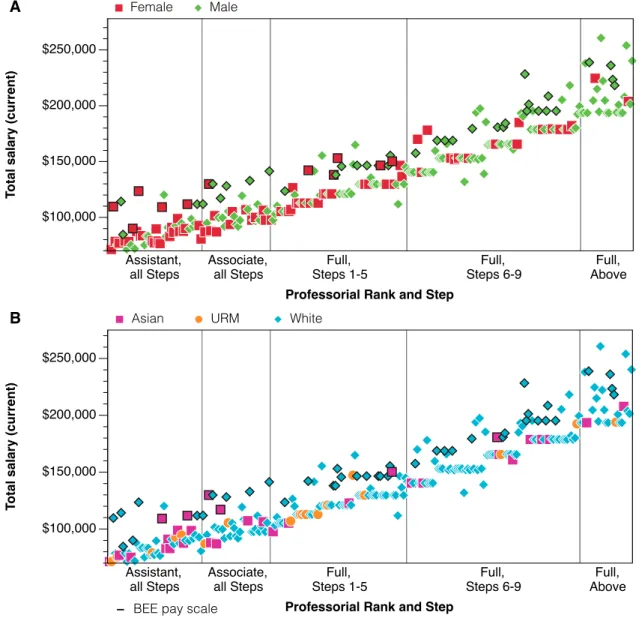
For a particular rank, step, and SCU, variability in total salary can usually be attributed to the o↵-scale component. Scatterplots of current o↵-scale salaries for the entire university (except faculty on the Health Sciences Compensation Plan) and in each of the units are provided to demonstrate their relationship to academic progress. The plots contain three horizontal lines corresponding to the 25th, 50th, and 75th percentiles of o↵-scale salaries among faculty in the units actually receiving them (i.e., o↵-scale salaries of zero were not included in these calculations). The vertical line corresponds to a progress rate of 1.0, which is normative. Some random “noise” was added to each point in the scatterplot to reduce the number of points that are superimposed. Faculty whose points fall in the lower right quadrant are the most disadvantaged by virtue of their normative or accelerated progress, but comparatively low (or no) o↵-scale salary.
In addition, boxplots are presented to show the distribution of progress rates among fac-ulty receiving any current o↵-scale salary versus those receiving none. A horizontal boxplot is comprised of several parts. The “left edge” of the box corresponds to the 25th percentile of academic progress values; the “right edge” of the box corresponds to the 75th percentile of academic progress values; the vertical line inside the box corresponds to the 50th per-centile of academic progress values. The boxes typically have horizontal lines emanating from the bottom and top of them; these represent the distribution of most of the remaining progress values below the 25th and above the 75th percentiles. Outlying observations, which usually (but not always) are in the (approximate) lowest and highest 5th percentiles, are illustrated with individual points (although note that identical progress values have super-imposed points). A short video on the interpretation of boxplots provides additional detail: Boxplot Basics and Interpretation.
A final note: all statistical models are approximation of unknown, underlying relation-ships between variables. They represent, in a sense, a combination of our own belief struc-tures and the evidence that the data provide. Thus, models contain implicit assumptions that may or may not be correct and represent approximations to the truth. For example, the functional relationship between year of hire and current salary is likely to be complicated, non-linear, and challenging to individually model for each unit. Conversely, modeling each year of hire separately would obviate us of the need to functionally describe an e↵ect, but doing so could compromise model precision and validity, particularly in small units, because of the need to estimate so many regression coefficients. So we elected to analyze our findings using decade of hire, the e↵ects of which are assumed to be constant within the decade and that change in a step-wise fashion at the boundaries of the decade. All models are, to some extent, wrong (misspecified), for not only the above reasons, but also because we can never know precisely every factor that influences a faculty member’s salary, especially the negotiated component.
Data
All data used in this report were collected and provided to the Task Force by the Office of the Vice Provost - Academic A↵airs. The report’s main dataset was primarily based on the data in the Payroll Personnel System Data Warehouse on October 1st, 2014, focusing only on Ladder Rank Faculty. A second dataset was provided by the School of Medicine that also included Professors of Clinical , and Health Sciences Clinical Professors. Of the 1,505 faculty employed as of October 1, 2014, 16 were excluded from the analysis due to missing data and/or being hired before 1975.
4.1
Variables: O
ffi
ce of the Vice Provost-Academic
Af-fairs dataset
• Composition — Ladder Rank faculty, does not include the Chancellor, the Provost, Vice Chancellors, Vice Provosts, Deans, and the academic series Supervisor of Physical Education.
• Salary — Regular Ladder Rank faculty salary. For the Schools of Medicine all salary sources have been included. For the Graduate School of Management and the School of Law summer compensation provided by the respective Dean’s office has been included. Salary does not include stipends, compensation from external funding sources (includ-ing summer compensation), and summer compensation connected with administrative duties.
• Normalization of Starting Salary — in order to compare starting salaries for current employees, these were converted to real dollars using the Consumer Price Index for All Urban Consumers (Bureau of Labor Statistics 2014). To reflect current conditions, salaries were converted using 2013 as the base year.
• Employee ID (names are not included)
• Gender (male or female)
• Ethnicity — based on Department of Labor guidelines, combining faculty into the groups Asian, Black, Hispanic, Native American, Caucasian, and Unknown. The dataset also includes an indicator for traditionally Underrepresented Minorities (URM) which combines the categories Black, Hispanic, and Native American.