THE EFFECTS OF HEPATITIS C INFECTION, TREATMENT, AND POPULATION INTERVENTIONS ON ALL-CAUSE MORTALITY AMONG PEOPLE LIVING WITH HIV
Alexander Samuel Breskin
A dissertation submitted to the faculty at the University of North Carolina at Chapel Hill in partial fulfillment of the requirements for the degree of Doctor of Philosophy in the Department
of Epidemiology in the Gillings School of Global Public Health.
Chapel Hill 2018
ii © 2018
iii ABSTRACT
Alexander Samuel Breskin: The effects of hepatitis C infection, treatment, and population interventions on all-cause mortality among people living with HIV
(Under the direction of Daniel Westreich)
Approximately 25% of people living with HIV (PLWH) in the United States are co-infected with hepatitis C virus (HCV), which, if left untreated, causes mortality through decompensated cirrhosis and hepatocellular carcinoma. Direct-acting antiviral (DAA) treatment for HCV can produce sustained HCV virologic response in nearly all PLWH and HCV (PLWH+HCV). However, in the era of effective antiretroviral therapy (ART), the effects of HCV infection, treatment, and population interventions on mortality are not clear for PLWH.
Using data from 3,056 PLWH in the Women’s Interagency HIV Study and Multicenter AIDS Cohort Study from 1994 to 2015, we used the parametric g-formula to estimate the effects of HCV infection and DAA treatment on 10-year all-cause mortality. We also estimated the effects of DAA treatment policies in which different groups are treated with DAAs: all PLWH+HCV, PLWH+HCV who met two existing Medicaid treatment criteria – achieving HIV suppression and having severe fibrosis or cirrhosis, and PLWH+HCV chosen at random with proportions treated equal to those under the Medicaid criteria. All estimates occurred after a hypothetical intervention to have all PLWH initiate ART at baseline, as modern guidelines suggest ART for all PLWH regardless of CD4 cell count.
iv
those with HIV suppression and severe fibrosis or cirrhosis was -1.1% (95% CI: -2.8%, 0.6%). Under this policy, 51% (95% CI: 38%, 59%) of PLWH+HCV would be treated with DAAs. The RD for treating the same proportion of PLWH+HCV chosen at random was 1.9% (95% CI: -4.7%, 0.3%). The population attributable risk difference for treating all PLWH+HCV with direct acting antivirals (DAA) was -0.7% (95% CI: -1.8%, 0.1%).
v
vi
ACKNOWLEDGEMENTS
First and foremost, I thank my wife, Greta Breskin. This dissertation would not have been possible without her love, support, wit, humor, patience, and intelligence.
I thank my advisor, Dr. Daniel Westreich, whose generosity with his time, knowledge, and resources during my time in this program gave me the freedom to pursue my research interests along with the structure and guidance to develop as an epidemiologist and researcher. Because of Daniel, my time as a doctoral student has been a rich, rewarding experience.
I thank the members of my dissertation committee for their time, patience, and guidance. Drs. Adaora Adimora and Christopher Hurt gave me the clinical perspective necessary to be
successful as an epidemiologist, and Drs. Stephen Cole and Michael Hudgens provided me with methodological support and helped me understand complex, cutting-edge epidemiological methods.
I thank Valerie Hudock and Jennifer Moore for helping me with the administrative aspects of this program.
I thank Drs. Jess Edwards and Alex Keil for additional methodological support. They helped me work my way through methodological issues and helped me with many of the computational aspects of this dissertation, likely saving me weeks of running the analysis for this dissertation.
vii
Phyllis Tien provided me excellent feedback on the manuscripts associated with this dissertation, and ultimately made this research stronger.
I thank everyone involved with the Women’s Interagency HIV Study and the Multicenter AIDS Cohort Study, including the members of the cohorts and the staff who make these studies possible. Their dedication to HIV research is remarkable, and without them our understanding of HIV would not be where it is today.
I thank the many friends I have made in this program. Without you, I would never have made it past the first semester.
Finally, I thank my family for their support throughout my career and education, in particular my mother, Wendy Breskin.
viii
TABLE OF CONTENTS
LIST OF TABLES ... xi
LIST OF FIGURES ... xii
LIST OF ABBREVIATIONS ... xiii
CHAPTER 1: INTRODUCTION ...1
1.1 Hepatitis C Virus (HCV) ...1
1.2 Human Immunodeficiency Virus (HIV) ...11
1.3 HIV/HCV Coinfection ...24
CHAPTER 2: STATEMENT OF SPECIFIC AIMS ...37
2.1 Specific aims and justifications ...37
2.2 Rationale ...39
2.3 Quantities to estimated ...41
CHAPTER 3: METHODS ...43
3.1 Description of data sources ...43
3.2 Variable measurement and operationalization ...49
3.3 Notation...56
3.4 The parametric generalized computation algorithm formula ...56
3.5 Inverse probability weighted estimation of marginal structural models ...70
3.6 Policy-relevant effect measures ...74
ix
CHAPTER 4: THE EFFECTS OF HEPATITIS C INFECTION AND TREATMENT
ON ALL-CAUSE MORTALITY AMONG PEOPLE LIVING WITH HIV ...84
4.1 Introduction ...84
4.2 Methods...85
4.3 Results ...90
4.4 Discussion ...92
4.5 Tables and figures ...96
CHAPTER 5: THE POPULATION INTERVENTION EFFECTS OF HEPATITIS C TREATMENT CRITERIA ON ALL-CAUSE MORTALITY AMONG PEOPLE LIVING WITH HIV ...102
5.1 Introduction ...102
5.2 Methods...103
5.3 Results ...107
5.4 Discussion ...110
5.5 Tables and figures ...113
CHAPTER 6: DISCUSSION ...118
6.1 Overview ...118
6.2 Study findings ...119
6.3 Strengths and limitations...123
6.4 Future directions ...128
6.5 Figures...131
APPENDIX A: FURTHER DETAILS OF ANALYSIS IN CHAPTER 4...132
A.1 Notation ...132
A.2 Natural course and g-formula equations used in chapter 4 ...133
x
A.4 Estimation of the marginal structural model for chapter 4 ...137
A.5 Comparison of observed and modelled natural course in chapter 4 ...139
A.6 Results of sensitivity analyses for chapter 4 ...141
APPENDIX B: FURTHER DETAILS OF ANALYSIS IN CHAPTER 5 ...142
B.1 Notation...142
B.2 Natural course and g-formula equations used in chapter 5 ...143
B.3 Final models used in chapter 5 ...144
B.4 Comparison of observed and modelled natural course in chapter 5 ...149
B.5 Timing of DAA treatment under dynamic interventions in chapter 5 ...151
xi
LIST OF TABLES
Table 1.1: Prior studies estimating the effect of HCV coinfection on mortality
among people living with HIV in the ART era...35 Table 1.2: Prior studies estimating the effect of HCV sustained virologic
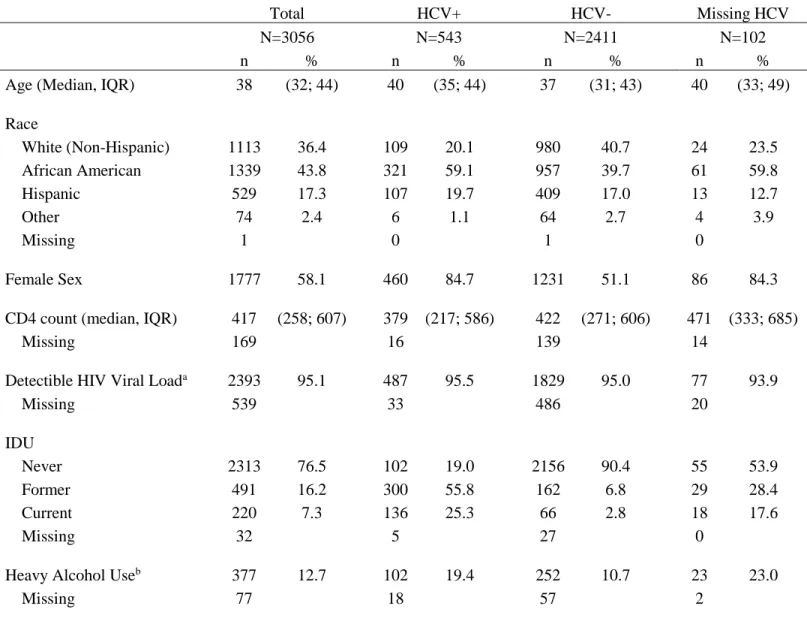
response on mortality among people living with HIV and HCV in the ART era ...36 Table 4.1: Study population at baseline, Women’s Interagency HIV Study and
Multicenter AIDS Cohort Study, 1994-2015 ...96 Table 4.2: Effects of HCV infection and DAA treatment on 10-year all-cause
mortality had all subjects initiated ART at baseline, Women’s Interagency HIV
Study and Multicenter AIDS Cohort Study, 1994-2015 ...98 Table 5.1: Baseline characteristics of eligible study participants stratified by
source, Women’s Interagency HIV Study and Multicenter AIDS Cohort
Study, 1994-2015 ...113 Table 5.2: Effects of DAA treatment criteria on 10-year all-cause among people
living with HIV and HCV, Women’s Interagency HIV Study and
Multicenter AIDS Cohort Study, 1994 - 2015 ...115 Table 5.3: Population intervention effects of DAA treatment criteria on
10-year all-cause mortality among people living with HIV, Women’s
Interagency HIV Study and Multicenter AIDS Cohort Study, 1994 - 2015 ...116 Table A.1: Comparison of observed versus modelled variable distributions
under the natural course using models from chapter 4, Women’s
Interagency HIV Study and Multicenter AIDS Cohort Study, 1994-2015 ...139 Table A.2: Sensitivity analysis results for chapter 4...141 Table B.1: Comparison of observed versus modelled variable distributions
under the natural course using models from chapter 5, Women’s
xii
LIST OF FIGURES
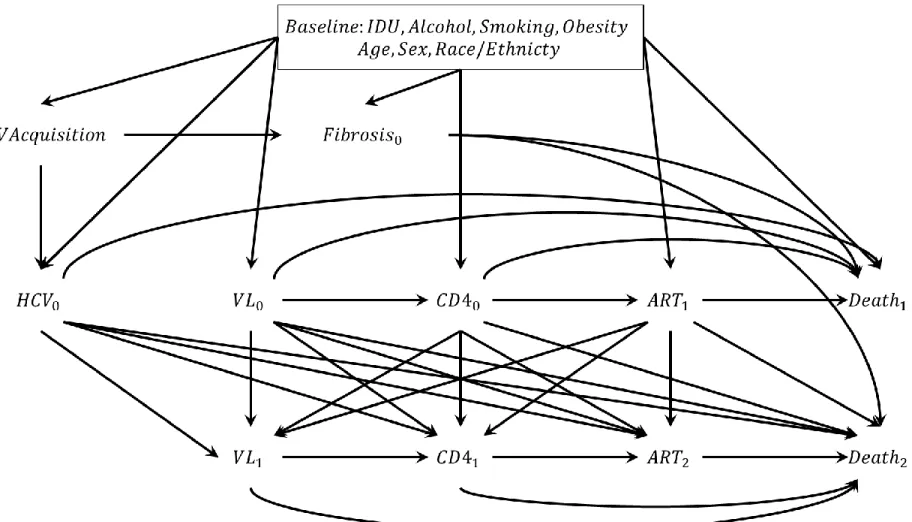
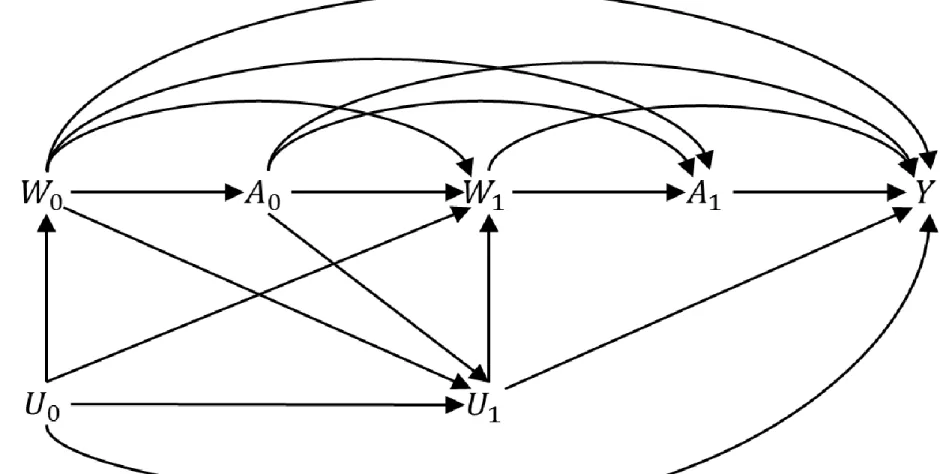
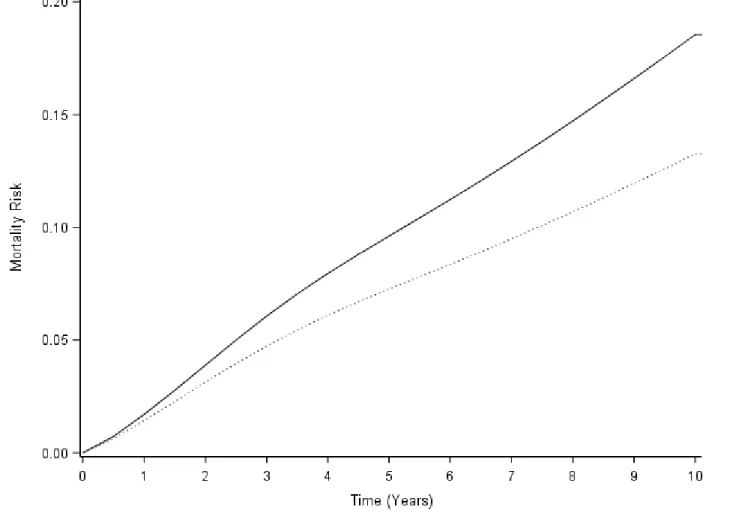
Figure 3.1: Causal diagram used to select confounders ...55 Figure 3.2: Causal diagram motivating the g-computation algorithm formula ...62 Figure 4.1: The effect of HCV infection on 10-year all-cause mortality among
PLWH, Women’s Interagency HIV Study and Multicenter AIDS Cohort
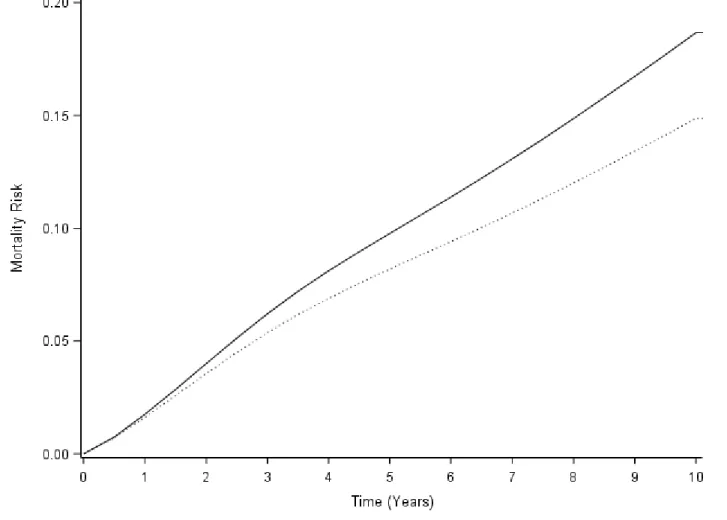
Study, 1994-2015 ...99 Figure 4.2: The effect of HCV infection on 10-year all-cause mortality among
PLWH and HIV, Women’s Interagency HIV Study and Multicenter AIDS
Cohort Study, 1994-2015 ...100 Figure 4.3: The effect of DAA treatment on 10-year all-cause mortality among
PLWH and HIV, Women’s Interagency HIV Study and Multicenter AIDS
Cohort Study, 1994-2015 ...101 Figure 5.1: Effects of DAA treatment criteria on 10-year all-cause mortality among
people living with HIV and HCV, the Women’s Interagency HIV Study
and Multicenter AIDS Cohort Study, 1994-2015 ...117 Figure 6.1: Simplified causal diagram demonstrating potential lack of conditional
exchangeability when estimating HCV treatment effects ...131 Figure A.1: Comparison of observed versus modelled mortality under the natural
course using models from chapter 4 ...140 Figure B.1: Comparison of observed versus modelled mortality under the natural
xiii
LIST OF ABBREVIATIONS AIDS Acquired immune deficiency syndrome
APEX Average effect of policy in the exposed ART Antiretroviral therapy
ARV Antiretroviral drug BMI Body mass index DAA Direct-acting antiviral
DPEX Dynamic effect of policy in the exposed GPEX Generalized effect of policy in the exposed HCV Hepatitis C virus
HIV Human immunodeficiency virus IDU Injection drug use
INI Integrase inhibitor
NNRTI Non-nucleoside reverse transcriptase inhibitor NRTI Nucleoside reverse transcriptase inhibitor PEG-IFN Pegylated Interferon
PI Protease inhibitor
PLWH Person(s) living with human immunodeficiency virus
1
CHAPTER 1: INTRODUCTION
In the following section, key concepts related to hepatitis C virus (HCV) and human immunodeficiency virus (HIV) are highlighted. First, important topics for HCV and HIV are reviewed separately, including their virology, pathogenesis, natural history, epidemiology, and treatment. Next, a thorough overview of HIV/HCV coinfection is presented, including the reasons for the high prevalence of coinfection, the way each virus affects the other, the
implications of coinfection for treatment of each disease, and current challenges and unanswered questions.
1.1 Hepatitis C virus
Virology of the hepatitis C virus
Hepatitis C virus (HCV) is a single-stranded, positive-sense RNA virus of the family Flaviviridae (Chevaliez & Pawlotsky 2006). The virus is introduced into a host via contact with infected blood (Liang et al. 2000). After exposure, the virus enters host cells through a
combination of receptors referred to as a “receptor complex,” which includes (but is not limited to) the SRB1, CD81, CLDN1, OCLN, EFGR, EphA2, NPC1L1, and LDL receptors (Kim & Chang 2013; Scheel & Rice 2013; Dubuisson & Cosset 2014). Of particular importance are the SRB1 and NPC1L1 receptors, as these are highly expressed in the liver and are likely part of the reason why the virus primarily infects hepatic cells (Dubuisson & Cosset 2014).
2
proteins, 3 structural - Core, E1, and E2 - and 7 non-structural - NS2, NS3, NS4A, NS4B, NS5A, NS5B, and p7 (Kim & Chang 2013). The structural proteins are used to form the virion itself, with core being a component of the viral capsid and E1 and E2 being proteins that bind to cell receptors and aid the virus in entering the host cell. The non-structural proteins include an RNA-dependent RNA polymerase (NS5B) involved in replicating the viral genome, proteases for processing the viral polyprotein (NS2, NS3, NS4A), and other proteins with various functions. Of these other proteins, the most important is perhaps NS5A, which alters the host cell to increase viral replication efficiency. The NS3/NS4A proteases, NS5A multi-function protein, and NS5B RNA polymerase are the targets of many modern HCV drugs.
The viral genome is reproduced by creating a negative-sense RNA template from the positive-sense RNA, and then using that template to create additional positive-sense strands (Chevaliez & Pawlotsky 2006). These newly created positive-sense strands are then used for further translation into viral protein and for packaging into new virions. Of note, the liver-specific microRNA miR-122 is necessary to facilitate viral replication, further explaining why the liver is the primary target for the virus. (Dubuisson & Cosset 2014). Because of the lack of efficient infectious cell culture systems until 2005 as well as the limitations of most in vitro models (Tariq et al. 2012), many aspects of the pathobiology of HCV remain poorly understood (Scheel & Rice 2013; Hoshida et al. 2014).
HCV does not enter the host cell’s nucleus and does not integrate into the host genome, and thus the virus must continuously replicate (Hoshida et al. 2014). The virus is extremely efficient at replication, with a single person with HCV producing as many as 1012 virions per day
3
(HIV shares many of these properties, see Virology of HIV). To date, 7 HCV genotypes (referred to as 1-7) and dozens of subtypes (referred to with letters) have been identified (Jackowiak et al. 2014). Each genotype shares only 70% of its genome with other HCV genotypes, and each subtype shares only 85% of its genome with other subtypes of the same genotype. This rapid mutation leads to HCV existing as a “quasispecies,” with substantial genetic variability within a host (Jackowiak et al. 2014). The extreme diversity of HCV makes it difficult for the host immune response to fully clear the infection and makes vaccine development challenging. Pathogenesis of HCV
HCV is non-cytopathic, and instead damages the host through indirect mechanisms (Irshad et al. 2013; Hoshida et al. 2014). HCV triggers relatively weak humoral and cellular immune responses to infection. Due to the high mutation rate within a host, the humoral response is typically unable to completely neutralize the virus (Liang et al. 2000). The cellular immune response is characterized by a weak T-cell response, which often fails to control the virus and instead leads to chronic inflammation, hepatocellular injury, and fibrosis (Liang et al. 2000; Hoshida et al. 2014). Additionally, a complex interaction between HCV and lipoproteins may shield the virus from the host immune response (Dubuisson & Cosset 2014).
4
lead to fibrosis, though the exact mechanism is not fully understood (Irshad et al. 2013). Because insulin resistance and steatosis are also caused by obesity, weight management is an important aspect of HCV care.
Natural history of HCV
HCV is transmitted through contact with infected blood, either directly through inoculation (e.g. through injection drug paraphernalia) or transfusion of contaminated blood products, or indirectly through breakage of a cutaneous or mucosal barrier, as may happen with sexual or perinatal transmission (Liang et al. 2000). HCV remains stable on surfaces for extended periods of time, and as such the sharing of many types of drug paraphernalia beyond needles and
syringes, such as spoons, tourniquets, cotton balls, or water glasses, can potentially lead to HCV transmission. HCV transmission through contaminated blood products is virtually non-existent in the United States, as the blood supply has been screened for HCV since 1992 (Centers for
Disease Control and Prevention 2016).
5
Patients who accumulate enough fibrosis to be classified as cirrhotic may succumb to end-stage liver disease, hepatocellular carcinoma (HCC), and other liver-related causes of death. Cirrhosis develops in 10-20% of patients after 20-30 years of chronic infection, but the pace differs substantially from person to person depending on the presence of other risk factors, such as older age at infection, male sex, coinfection with HIV or hepatitis B virus, obesity, heavy drinking, smoking, type 2 diabetes, and hepatic steatosis (Seeff 2002; Hajarizadeh et al. 2013; Westbrook & Dusheiko 2014). Once cirrhosis develops, patients experience a 1-5% annual risk of HCC and a 3-6% annual risk of hepatic decompensation, defined as the failure of normal liver function due to cirrhosis (Westbrook & Dusheiko 2014). Although episodes of hepatic
decompensation may be reversible with medical therapy, once a patient has experienced
decompensation for the first time, their annual risk of death is 15-20% (Westbrook & Dusheiko 2014).
Epidemiology of HCV
The incidence of HCV and its risk factors are a challenge to investigate, as most acute cases are undiagnosed, and chronic cases are discovered years after infection. For instance, in 2014, out of an estimated 30,500 incident cases of HCV infection in the US, only 2,194 were reported to the CDC (Centers for Disease Control and Prevention 2017d). Therefore, most of the
understanding of HCV incidence and risk factors comes from biological knowledge of how the virus operates and from prevalence estimates, and therefore many aspects of the disease are still not fully understood.
non-6
B” hepatitis in 1989 (Bukh 2016). Between 1988 and 1994, an estimated 1.3% of adults in the US had chronic HCV based on the National Health and Nutrition Examination Survey
(NHANES) (Alter et al. 1999). In a follow-up study from NHANES conducted between 1999 and 2002, the prevalence remained stable at 1.3% (Armstrong et al. 2006). Finally, the most recent NHANES study estimated the prevalence of chronic HCV infection in the United States to be slightly lower at 1.0%, corresponding to 2.7 million chronic cases (Denniston et al. 2014). The majority of HCV in the US is genotype 1 (primarily 1a, followed by 1b) (comprising 70% of cases), but genotypes 2 and 3 are also prevalent (Scheel & Rice 2013).
The prevalence in the US varies within subpopulations, with the highest prevalence being among 40-49 year-olds, males, and non-Hispanic blacks (Denniston et al. 2014). The epidemic is rapidly evolving, however, with increasing proportions of cases occurring in younger, non-Hispanic white PWID (Suryaprasad et al. 2014). Certain other subpopulations in the US face a substantially increased burden of HCV, for instance people born between 1945 and 1965 (Smith et al. 2012) and people with HIV, as discussed in section 2C: HIV-HCV Coinfection.
7
HCV infection remains the leading cause of liver transplantation in the United States (Thuluvath et al. 2010). In 2007, the number of deaths in the US attributed to HCV exceeded those due to HIV for the first time (Ly et al. 2012). In 2014, nearly 20,000 deaths in the United States were attributed in whole or in part to HCV infection (Centers for Disease Control and Prevention 2017d).
Treatment of HCV: historical context
Successful treatment for HCV is defined as achieving a sustained virologic response (SVR), which means a loss of detectable HCV RNA during treatment, and a continued absence for at least 12 weeks after therapy ends (American Association for the Study of Liver Diseases & Infectious Diseases Society of America 2017). SVR is durable in over 95% of patients (Feld & Hoofnagle 2005), and Patients who achieve SVR have improved clinical outcomes (Veldt et al. 2007).
Shortly after HCV was discovered in 1989, interferon-α (IFN) was identified as a moderately effective treatment (Davis et al. 1989; Di Bisceglie et al. 1989). IFN has general antiviral,
antiproliferative, and immunomodulatory activity, and it operates to treat HCV through at least two known mechanisms (neither of which acts directly on HCV). First, it induces IFN-stimulated genes, causing a general antiviral state to occur within the cell. Second, it causes memory T-cell to proliferate and prevents their apoptosis, and it causes the stimulation and maturation of natural killer and dendritic cells (Feld & Hoofnagle 2005). Unfortunately, IFN produces moderate to severe side effects, including influenza-like symptoms, gastrointestinal disturbances,
8
note, IFN is substantially less effective for infections by HCV genotype 1, the most commonly found genotype in the US, compared with other genotypes (Jackowiak et al. 2014).
In the late 1990s, it was discovered that the addition of ribavirin to IFN based treatments substantially improved treatment outcomes (Davis et al. 1998; Poynard et al. 1998), leading to SVR rates of 35-40% (Feld & Hoofnagle 2005). Like IFN, ribavirin is a non-specific antiviral agent that directly inhibits viral replication. It is believed that ribavirin acts as a viral mutagen which increases the number of mutations and causes “error catastrophes” that lead to non-viable viral mutants (Feld & Hoofnagle 2005).
In the early 2000s, researchers found that the use of IFN conjugated to polyethylene glycol (PEG-IFN) led to additional improvements in treatment success (Manns et al. 2001), with SVR rates over 50% (Feld & Hoofnagle 2005). PEG-IFN has an improved pharmacokinetic profile and fewer side effects (Feld & Hoofnagle 2005). Unfortunately, due to the lack of efficient cell culture systems and limited in vitro models, PEG-IFN remained the best available treatment for over a decade, leaving the nearly half of treated individuals who did not achieve SVR with no alternatives.
Treatment of HCV: recent developments
9
and the variability of NS3 across genotypes, these drugs were specifically approved for that genotype (Kiser & Flexner 2013). When used in combination with PEG-IFN and ribavirin, these drugs led to SVR rates as high as 75% (Poordad et al. 2011; Jacobson et al. 2013). Though SVR rates were improved substantially, treatment duration remained long (as long as 48 weeks), and the side effect profile was similar to prior treatments.
In 2013, the blockbuster drug sofosbuvir was approved for the treatment of HCV (Gilead Sciences 2013). Sofosbuvir inhibits the HCV RNA-dependent RNA-polymerase, NS5B, which is highly conserved, and thus the drug is effective for all HCV genotypes (Lawitz et al. 2013). The first approved treatments with sofosbuvir included PEGIFN and ribavirin, and achieved SVR rates of over 90% with only 12 weeks of treatment for most HCV genotypes (Jacobson et al. 2013; Lawitz et al. 2013). Though the treatment success rate was excellent, the need for PEGIFN remained a problem. Shortly thereafter, it was discovered that all-oral, interferon-free regimens of sofosbuvir along with second-generation NS3/NS4A protease inhibitors (e.g. simepravir) and NS5A inhibitors, such as daclatasvir and ledipasvir, resulted in SVR rates up to 99% and
10 Current challenges and remaining questions with HCV
Modern DAA therapy is extremely effective and has completely changed the landscape of HCV treatment (Burstow et al. 2017). However, there are several remaining challenges and open questions with regards to HCV treatment. Perhaps first among them regards access to treatment. The list price for sofosbuvir, $1,000 per pill ($84,000 for a course of treatment) (University of Washington 2017), is prohibitively expensive for many people with HCV (Rosenthal & Graham 2016). Even though the price paid by insurers in the United States is typically heavily
discounted, with an average discount of 46% off of the list price (Rosenthal & Graham 2016), DAA treatment continues to be restricted by many Medicaid programs. As of October 2017, 30 states restrict DAAs to patients with at least moderate liver fibrosis (12 states restrict to those with severe fibrosis), and 40 states restrict access to patients based on substance use (Ooka et al. 2017), restrictions that are particularly problematic given the ‘treatment as prevention’ paradigm (Trooskin et al. 2015). As of September 2016, 5 states plus Washington, DC restrict treatment among people living with HIV and HCV to those who meet certain HIV treatment goals, such as achieving HIV suppression. These restrictions persist despite guidelines that suggest that nearly all people with HCV be treated (American Association for the Study of Liver Diseases & Infectious Diseases Society of America 2017). The treatment landscape is rapidly evolving, however, as more drugs come to market to increase competition and reduce costs (Nisen 2017), and as legal challenges force insurance companies to drop coverage restrictions (National AIDS Treatment Advocacy Project 2017). Nevertheless, it has been estimated that, even with current discounts, treating all patients with HCV in the US would comprise more than 50% of
11
regimens and whether or not current Medicaid restrictions are optimizing survival benefits is essential for maximizing access to those most in need.
There are many additional open questions with regards to HCV and its treatment, including the possibility of drug-drug interactions, the effectiveness of DAAs in key populations, and the effect of HCV on survival among people with certain common comorbidities. Some of these are discussed in detail in section 2C: HIV-HCV Coinfection.
1.2 Human immunodeficiency virus
Virology of the human immunodeficiency virus
Human immunodeficiency virus (HIV), the causative agent of acquired immunodeficiency syndrome (AIDS), is a retrovirus of the genus lentivirus (Turner & Summers 1999). After transmission via contact with infected bodily fluids, the virus binds to the CD4 receptor and either the CCR5 or CXCR4 coreceptors of host cells, which are primarily found on T cells, but also monocytes, macrophages, dendritic cells, astrocytes, and epithelial cells (Maartens et al. 2014).
The virion contains several elements necessary for replication, including reverse
12
The HIV genome codes for several structural, functional, and accessory proteins. The Gag polyprotein is cleaved by the viral protease into the four nucleocapsid proteins – MA, CA, NC, and p6. The Pol polyprotein is cleaved into the functional proteins – protease, reverse
transcriptase, RNase H, and integrase. Additionally, the HIV genome codes for Env, the envelope protein, and the accessory proteins Tat, Rev, Nef, Vif, Vpr, and Vpu (Turner & Summers 1999; Sierra et al. 2005).
The HIV virus has two subtypes – HIV-1 and HIV-2 (Maartens et al. 2014). HIV-2 is
predominantly found in West Africa, and is notable for being less transmissible, having a slower disease progression, and being less susceptible to certain classes of antiretroviral medications. HIV-1 is the type found in the vast majority of cases globally and will thus be the focus of the rest of this work. There are four HIV-1 subgroups, each corresponding to distinct zoonotic transmission events – M, N, O, and P. The majority of cases worldwide are group M; N, O, and P are only found in West Africa (Maartens et al. 2014). Each subgroup’s genome differs from the others’ by at least 30%, while subtypes within the subgroups differ by 15-20% (Levy 2009). Like HCV, HIV exhibits a very high rate of mutation, and many strains can coexist within an
individual. This is largely due to efficient replication - 109 virions are typically produced within a
person with HIV every day (Ho et al. 1995) - and the high error rate of HIV reverse transcriptase (Stebbing & Moyle 2003). The large degree of heterogeneity has important consequences for immune system evasion and treatment resistance (Turner & Summers 1999).
Pathogenesis of HIV
13
cells (Lucas & Nelson 2015). The CD4 cells of the gastrointestinal tract are the first to be
destroyed, and these usually do not recover even after successful HIV therapy (Levy 2009; Lucas & Nelson 2015). The progressive exhaustion of CD4 cells leaves the host vulnerable to
opportunistic infections, which ultimately lead to severe morbidity and death (Maartens et al. 2014). Besides CD4 cell destruction, the destruction of astrocytes and renal epithelial cells also directly lead to neurocognitive disorder and nephropathy (Maartens et al. 2014).
The host immune system mounts a potent response to HIV infection. The innate immune response is mediated by natural killer cells which identify and destroy cells that do not display major histocompatibility complex due to being infected by the virus (Levy 2009; Maartens et al. 2014). The cellular immune response, which begins within hours or days of infection, involves CD8 T-cells killing HIV-infected cells (Maartens et al. 2014). Lastly, the humoral immune response involving HIV neutralizing antibodies arises within weeks of infection (Maartens et al. 2014). Because of the high mutation rate of HIV, the immune response quickly selects for immune resistant strains, and is ultimately unable to completely clear the virus (Maartens et al. 2014).
14 Natural history of HIV infection
HIV is transmitted via exposure to infected bodily fluids such as blood or semen. Common routes of exposure are mother to child transmission, condomless sexual intercourse, injection drug use, blood transfusion, accidental inoculation, or organ transplants (Maartens et al. 2014; Lucas & Nelson 2015). The risk of infection after exposure is directly correlated with the viral load of the person with HIV (Maartens et al. 2014), which has important implications for treatment as prevention.
The initial, acute infection causes symptoms in approximately 50% of cases, and includes an illness characterized by fever, lymphadenopathy (swollen glands), pharyngitis (sore throat), GI upset, and other flu-like symptoms (Lucas & Nelson 2015) (the proportion of people with acute HIV experiencing symptoms is likely much higher, but only a fraction of such individuals seek care for their symptoms). This acute phase is characterized by an extremely high viral load, which increases the risk of transmission 20-fold (Hollingsworth et al. 2008). The immune response is able to slow down the viral replication, but is not able to eliminate the virus (Maartens et al. 2014). The next phase is characterized by a drop in viral load to a ‘setpoint,’ followed by a partial recovery of CD4 cells (Maartens et al. 2014; Lucas & Nelson 2015). At this stage, the virus can persist for years in a latent state in resting memory T-cells where the virus has been integrated into the host genome (Maartens et al. 2014), with a median incubation period of approximately 10 years without treatment (Bacchetti & Moss 1989). This ‘reservoir’ of
infected cells is a major impediment of HIV cure efforts.
15
200 cells per mm3 or the presence of an AIDS-defining illness, such as Pneumocystis pneumonia,
cytomegalovirus retinitis, or certain cancers (US Department of Health and Human Services 2017). Before effective treatments were available and early in the HIV epidemic, people living with HIV (PLWH) had a median survival time of 1 year after diagnosis with an AIDS-defining illness (Lee et al. 2001). Just prior to the discovery of combination antiretroviral therapy, this median survival time had improved to nearly 2 years (Lee et al. 2001).
Besides the gradual destruction of the immune system, HIV also causes chronic immune activation (see Pathogenesis of HIV). This chronic inflammatory state exists in many patients even after successful HIV treatment, and is associated with mortality and several chronic diseases, including cardiovascular disease, cancer, neurological disease, liver disease, chronic obstructive pulmonary disease, neurocognitive disorders, and osteopenia/osteoporosis (Lucas & Nelson 2015).
The most important prognostic factor for HIV infection is viral load (Mellors et al. 1996), and as such the goal of treatment is to reduce the viral load to undetectable levels (See Treatment of HIV). Other factors can also lead to a worse prognosis, including (but not limited to): older age, lower nadir CD4 cell count, higher viral setpoint, coinfection with herpesviruses or viral hepatitis, and increased immune activation (Lucas & Nelson 2015).
16
2007). Between 2002 and 2004, well into the ART era, the risk in that same cohort had decreased to 6.1% (Lima et al. 2007). Additionally, PLWH can now achieve lifespans beginning to
approach those of the general population (Samji et al. 2013; Nakagawa et al. 2013; Marcus et al. 2016). Between 1996 and 1997, in the early ART era, a 20-year-old with HIV was expected to live an additional 19 years; by 2011, that figure had increased to 53 years (Marcus et al. 2016). AIDS as a cause of death decreased substantially pre- and post- ART as well, from 78% of deaths in between 1988 and 1995 to 15% between 2005 and 2010 (Weber et al. 2013). This decrease in AIDS as a cause of death has corresponded to an increase in the proportion of non-AIDS causes of death, rising from 17% between 1988 and 1995 to 71% between 2005 and 2010 (Weber et al. 2013). Further implications of HIV treatment are discussed in the section Current challenges and remaining questions of HIV.
Epidemiology of HIV
The World Health Organization estimates that 36.7 million people across the world were living with HIV in 2015 (World Health Organization 2017). The majority of these people (25.5 million) are in Africa. That year, 2 million individuals became newly infected with HIV, of whom 1.4 million were in Africa. Finally, HIV caused 1.1 million deaths in 2015, including 800 thousand in Africa (World Health Organization 2017).
According to the Centers for Disease Control and Prevention, there were 1.2 million PLWH in the United States 2014, of whom 13% are unaware of their HIV status (Centers for Disease Control and Prevention 2017b). Most diagnosed PLWH in the US are middle-aged; individuals aged 40-59 years make up nearly 50% of people living with HIV. Non-Hispanic blacks
17
contains 44% of diagnosed HIV cases in the US, followed by the Northeast (25%), West (20%), and Midwest (12%) (Centers for Disease Control and Prevention 2015a).
In 2015, 40 thousand people in the US were newly infected with HIV (Centers for Disease Control and Prevention 2015a). The majority (67%) of new cases were men who have sex with men (MSM), and most of those were among non-Hispanic Blacks. Women made up 19% of new diagnoses. Among women, 86% of cases were acquired sexually, while 13% were attributed to injection drug use. Overall, 9% of new cases were at least partially attributed to injection drug use. Non-Hispanic Blacks accounted for 45% of all new diagnoses, while Hispanics accounted for 24%. Individuals aged 20-39 made up 61% of new diagnoses (Centers for Disease Control and Prevention 2015a). In 2014, 12 thousand PLWH died in the United States, with 7 thousand of those deaths attributed to HIV (Xu et al. 2016).
The HIV epidemic in the United States has been in rapid transition in the last decade as HIV prevention and treatment have improved. Between 2005 and 2014, there has been an 18% decline in HIV incidence among White MSM, a 40% decline among women, a 35% decline among heterosexuals, and a 63% decline among PWID. Unfortunately, not all groups shared in these improvements. Non-Hispanic Black and Hispanic MSM have experienced increases in incidence of over 20% in that time period. Overall, between 2005 and 2014, the incidence of HIV declined by 19% (Centers for Disease Control and Prevention 2015c).
HIV treatment: historical perspective
18
The last, and most recent, goal of treatment is to prevent HIV transmission (Panel on Antiretroviral Guidelines for Adults and Adolescents 2018).
For the first six years of the HIV epidemic, there were no approved or known effective treatments for the deadly disease (Vella et al. 2012). HIV care providers focused on managing crises, dealing with opportunistic infections, and providing palliative care (Chu & Selwyn 2011). In 1987, a major breakthrough occurred with the discovery of the first HIV antiretroviral therapy, a nucleoside reverse transcriptase inhibitor (NRTI) called azidothymidine (abbreviated AZT and later renamed zidovudine, ZDV) (Fischl et al. 1987). With treatment, 98% of patients survived for 24 weeks, and only 23% of these patients developed an opportunistic infection (Fischl et al. 1987). Unfortunately, the benefit appeared to be short-lived, as the virus quickly develops resistance to single-agent therapy and thus immune system functional improvements are lost (Fischl et al. 1987). Nevertheless, additional NRTIs were quickly developed, though all faced similar shortcomings (Vella et al. 2012).
It was soon discovered that, due to the high rate at which HIV mutates, monotherapy with any one antiretroviral selected for resistant strains of the virus (Shirasaka et al. 1995; Richman 2001). To combat this resistance, new classes of drugs were developed to be used in combination with NRTIs. The first new drugs developed were the protease inhibitors (PI), the first of which was saquinavir (Vella et al. 2012). Shortly thereafter, nevirapine, the first of the non-nucleoside reverse transcriptase inhibitors (NNRTI), was approved (Vella et al. 2012).
19
combination of three antiretroviral drugs is now referred to as combination antiretroviral therapy (ART). Future trials found that ART led to extremely durable HIV suppression, with one early trial demonstrating effectiveness beyond three years (Gulick et al. 2000).
ART caused a paradigm shift in HIV care. In 1995, just prior to the discovery of ART, the all-cause mortality rate among people with HIV was 29.4 per 100 person-years. In 1997, after ART was introduced, that rate declined to 8.8 per 100 person-years (Palella et al. 1998). Since then, major improvements have been made to ART, such as treatment regimens with easier dosing and better side effect profiles, including the introduction of multiple single tablet, fixed-dose, once-daily regimens (Vella et al. 2012). New drug classes have also been developed. The first entry inhibitor (EI), enfuvirtide, was approved in 2003 as a salvage therapy for patients who had developed resistance to other classes of antiretrovirals (Lalezari et al. 2003). In 2007, the first integrase inhibitor (II), raltegravir, was approved and was shown to have similar efficacy as existing drugs (Lennox et al. 2009).
20
CD4 cells per mm3 led to better treatment outcomes than further delaying treatment (When To
Start Consortium 2009). By 2015, the INSIGHT study showed that starting patients immediately after entry into care, regardless of CD4 count, provided the best patient outcomes (The INSIGHT START Study Group 2015), and this is the current guideline for treatment initiation in the United States (Panel on Antiretroviral Guidelines for Adults and Adolescents 2018).
In addition to providing benefit to the patients themselves, early ART initiation has been shown to prevent transmission to others, as viral suppression is the key determinant of infectivity (Panel on Antiretroviral Guidelines for Adults and Adolescents 2018). In 2011, the HPTN 052 trial was stopped three years early when it was found that immediate ART initiation led to a 93% reduction in HIV transmission in serodiscordant couples (Cohen et al. 2016). These results have led to the paradigm of ‘treatment as prevention,’ which is now a cornerstone of HIV control efforts and is being integrated into debates about treatment for other diseases.
HIV treatment: classes of drugs and current guidelines
21
The first class of ARVs is the nucleoside/nucleotide reverse transcriptase inhibitors (NRTI). NRTIs are analogues of naturally-occurring deoxynucleotides that are used in DNA synthesis (Moyle 2000). Reverse transcriptase cannot distinguish between the NRTIs and
deoxynucleotides, and as such the NRTIs compete for incorporation into the DNA strand (Moyle 2000). NRTIs are “chain-terminator” molecules that lack an important 3’-hydroxyl group
necessary for DNA elongation, so after they are integrated into the DNA strand, the next deoxynucleotide cannot bond to the DNA chain, halting DNA synthesis (Moyle 2000). Early NRTIs had severe side effect profiles, including neuropathy, myopathy, cardiomyopathy, pancreatitis, hepatitis, lactic acidosis, nephrological toxicity, bone marrow toxicity, and skin toxicity – all thought to be the effect of mitochondrial toxicity (Brinkman et al. 1998).
Fortunately modern NRTIs have far fewer side effects and are better tolerated by patients (Vella et al. 2012). Commonly used NRTIs include abacavir (ABC), lamivudine (3TC), tenofovir (TAF or TDF), and emtricitabine (FTC) (Panel on Antiretroviral Guidelines for Adults and
Adolescents 2018).
The second class of ARVs used in ART are the protease inhibitors (PI). PIs work by
22
used protease inhibitors are atazanavir and darunavir (Panel on Antiretroviral Guidelines for Adults and Adolescents 2018).
A third class of ARVs is the non-nucleoside reverse transcriptase inhibitors (NNRTIs). Like the NRTIs, these drugs target the reverse transcription step in the viral replication process. Their mechanism, however, is quite different. Rather than mimicking components of viral DNA, NNRTIs bind to the HIV reverse transcriptase and inhibit it from polymerizing DNA (Sluis-Cremer & Tachedjian 2008). NNRTIs tend to induce the CYP450 system, and thus may cause drug-drug interactions (Richman 2001). The most common adverse effects from NNRTIs are skin rashes (Panel on Antiretroviral Guidelines for Adults and Adolescents 2018) and, in the case of efavirenz, neuropsychiatric complications (Apostolova et al. 2015). Efavirenz is the only NNRTI currently recommended for first-line ART initiation, and it is only recommended as part of an ‘alternative’ regimen (Panel on Antiretroviral Guidelines for Adults and Adolescents 2018).
23 Current challenges and remaining questions of HIV
Perhaps the greatest current challenge with HIV is the lack of curative treatment or an effective vaccine. While there are many promising avenues being explored in that arena, it is important to tackle the challenges that are most pressing for PLWH and care providers today. The next greatest challenge is identifying PLWH and engaging them in care. In 2014, of the 1.1 million people with HIV over 13 years old in the US, 15% were not aware of their status
(Centers for Disease Control and Prevention 2017c), corresponding to 166,000 undiagnosed cases. Perhaps more strikingly, only 57% of PLWH in the US were engaged in continuous HIV medical care, and, 58% were virally suppressed (Centers for Disease Control and Prevention 2017c). Because viral suppression is key for patient survival and the prevention of HIV transmission, getting patients engaged in care should be one of the top priorities for this population.
24
infections), osteopenia and osteoporosis, liver disease, renal disease, and cognitive decline in this population (High et al. 2012), perhaps reflecting a closer alignment to the conditions impacting the general population. In fact, the most common causes of death among PLWH in the US are non-AIDS-related, and are instead primarily related to hepatic complications, cardiovascular disease, and non-AIDS-defining cancers (Smith et al. 2014).
HIV care providers are now faced with a complex problem. While they still must provide care and treatment for their patients’ HIV infection, they must also often guide and direct care for their patients’ multiple comorbid chronic conditions and manage their polypharmacy (Chu & Selwyn 2011). As such, it is important to elucidate the most severe conditions facing these patients and to identify what patient-level treatments and policy-level interventions may best reduce morbidity and mortality among people with HIV. Additional research is needed to determine how to properly prioritize the conditions to target for prevention and treatment interventions at both the patient and policy levels, and to aid providers in obtaining the best possible evidence to provide the best possible care for their patients.
1.3 HIV/HCV Coinfection
Diseases that travel together
25
transmission from accidental needle-stick injuries, HCV was ten times more likely to be transmitted than HIV (Kim et al. 2009).
Besides IDU, sexual transmission of HCV has had an increasing role in HIV/HCV coinfection (Danta et al. 2007; Taylor et al. 2012; Breskin et al. 2015). The reason for the
increase in sexual transmission is thought to be due to increases in the prevalence and frequency of condomless sex and ‘serosorting,’ or choosing perceived HIV sero-concordant sexual
partners, since the widespread adoption of effective ART (Taylor et al. 2012). This theory is consistent with reports of high rates of sexually transmitted infections in men who have sex with men with both HIV and HCV (Danta et al. 2007; Breskin et al. 2015). Though HCV does not usually transmit efficiently through sexual contact (Sulkowski 2008), individuals with HIV are more likely to shed the virus through semen. (Taylor et al. 2012), and thus those with sexual practices as a primary risk factor typically acquire HIV prior to HCV (Taylor et al. 2012). Epidemiology of HIV-HCV coinfection
Globally, 6.2% of PLWH are thought to be coinfected with HCV, corresponding to 2.3 million cases (Platt et al. 2016). The odds of HCV infection among PLWH are 6 times the odds among those without HIV (Platt et al. 2016). Among people who inject drugs (PWID), the picture is much different. The estimated prevalence of HCV among PWID with HIV worldwide is 82.4%, and injectors with HIV have 36 times the odds of HCV infection than PWID without HIV (Platt et al. 2016).
26
both diseases (Centers for Disease Control and Prevention 2017a). Similar to the picture globally, the prevalence of HCV is much higher among PWID with HIV, of whom 75% are thought to be coinfected (Centers for Disease Control and Prevention 2017a). Due to the high prevalence of HCV coinfection among PLWH in the United States, the CDC currently
recommends that all PLWH be tested for HCV upon entry into care, regardless of primary transmission risk factor (Centers for Disease Control and Prevention 2015b). Notably, the guidance is less clear regarding the screening of individuals already engaged in care (Freiman et al. 2014).
Coinfection and mortality
27
In particular, HCV has been shown to lead to substantial increases in death from liver-related causes among PLWH. In a study during the early ART era, it was estimated that HCV coinfection increased the rate of liver-related mortality by a factor of twelve in PLWH
(Rockstroh et al. 2005). Indeed, liver-related disease, including hepatocellular carcinoma, is the leading non AIDS-related cause of death among PLWH in the Western world, and much of it is attributed to viral hepatitides (Weber et al. 2013; Smith et al. 2014).
How HIV affects HCV
HIV has been shown to lead to a substantially worse prognosis for HCV infection. PLWH+HCV are much less likely to clear their acute HCV infection, and therefore are more likely to progress to chronic disease, compared with people with HCV only (Sulkowski 2008). PLWH+HCV also tend to carry a higher HCV viral load (Sulkowski 2008) and can shed virus through their semen, thus facilitating sexual transmission (Taylor et al. 2012).
PLWH+HCV often experience faster fibrosis progression compared with people with HCV only (Graham et al. 2001). In the early ART era, PLWH+HCV progressed by 0.18 fibrosis units per year, compared with 0.14 in people with HCV only, corresponding to a twelve-year faster progression to cirrhosis in these patients (Benhamou et al. 1999). Notably, PLWH+HCV have been found to have liver fibrosis measurements similar to those of people with HCV only who were nearly 10 years older, suggesting a substantially faster rate of fibrosis progression (Kirk et al. 2013). A meta-analysis conducted in 2001 found that PLWH+HCV had a risk of
28
The mechanism by which HIV accelerates the progression of HCV infection is not fully understood but is likely due to several distinct mechanisms. First, it is known that HIV directly promotes fibrosis through hepatocyte apoptosis and activation of hepatic stellate cells (Kim et al. 2009; Liberto et al. 2015). Second, HIV directly dysregulates the immune system through the depletion of CD4 cells, which may allow for higher HCV viral loads (Kim et al. 2009). Third, the chronic inflammatory state caused by HIV infection may accelerate fibrosis (Kim et al. 2009; Liberto et al. 2015). Fourth, the depletion of gastrointestinal lymphoid tissue by HIV may lead to disruption of the epithelium and microbial translocation (Kim et al. 2009). In particular,
lipopolysaccharides from gut bacteria may enter the bloodstream and promote inflammation. Fifth, certain adverse side effects of HIV therapy, including insulin resistance, dyslipidemia, and hepatic steatosis, are known risk factors for fibrosis (Kim et al. 2009).
29
infection may lead to an increased risk of hepatoxicity from ART, this increased risk is far outweighed by the benefit of HIV control and decreased fibrosis progression (Sulkowski 2008).
HIV has a major impact on the success rate of PEG-INF-based treatment for HCV. The success rate of these treatments were extremely low in PLWH+HCV, with only 14% success among patients with genotype 1 and 73% success among people with other genotypes (Chung et al. 2004). Notably, very few PLWH+HCV were considered eligible for treatment due to poor immune function and other comorbidities (Rauch et al. 2005). Fortunately, modern DAA based HCV treatment appears to be as effective in PLWH+HCV as in people with HCV only, with SVR rates over 90% across patient populations (Molina et al. 2015; Wyles et al. 2015; Naggie et al. 2015; Sogni et al. 2016; Montes et al. 2017).
How HCV affects HIV
The effect of HCV coinfection on the progression of HIV is less clear, and the evidence thus far is equivocal. While some studies have found no effect of HCV on HIV progression to AIDS or response to ART (Staples et al. 1999; Sulkowski et al. 2002; Rockstroh et al. 2005), others have found that HCV leads to double the risk of AIDS-related mortality and hospitalization (Greub et al. 2000; Klein et al. 2003).
30
CYP3A-inducing ARVs are efavirenz, etravirine, and nevirapine, while CYP3A-substrate DAAs include daclatasvir, elbasvir, grazoprevir, paritaprevir, and simepravir. An additional important drug-drug interaction is between ledipasvir, a substrate of p-glycoprotein, and tenofovir
disoproxil fumarate. Co-administration of these drugs may lead to renal injury, especially when used with a boosted PI (Panel on Antiretroviral Guidelines for Adults and Adolescents 2018). Despite the possibility of drug-drug interactions, the large number of ART and DAA choices provide HCV and HIV treatment options for nearly all coinfected patients, though ART regimens and dosing may need to be adjusted if HCV treatment is to be initiated, and monitoring for adverse interactions is warranted (Panel on Antiretroviral Guidelines for Adults and Adolescents 2018). Because of the more immediate effect of HIV on adverse outcomes, treating HIV is considered most urgent, and it is recommended that ART be initiated prior to HCV treatment (Panel on Antiretroviral Guidelines for Adults and Adolescents 2018).
Current challenges and remaining questions with HIV-HCV coinfection
31
2018). Additionally, only five studies restricted their samples to patients on ART (Backus et al. 2005; Greub et al. 2000; May et al. 2015; Rancinan et al. 2002; Weis et al. 2006), and none properly dealt with time-varying ART initiation or included ART as a potential effect measure modifier. Among the high-quality studies that appear most applicable to the population of people with HIV in the US, there is no clear consensus as to the effect of HCV on mortality. Five
studies found that people with HIV and HCV have 1.4 to 2.4 times the rate of mortality
compared with people with HIV only (Greub et al. 2000; May et al. 2015; Rockstroh et al. 2005; Weis et al. 2006; Thornton et al. 2017), while two studies found no effect of HCV on mortality among people with HIV (Sulkowski et al. 2002; Scherzer et al. 2017). A 2009 meta-analysis estimated that PLWH+HCV had 1.4 times the risk of mortality of PLWH alone (Chen et al. 2009). That study, however, combined estimates corresponding to varying lengths of follow-up, and therefore the results are difficult to interpret. Given the lack of consensus among studies, the scarcity of high-quality studies generalizable to the US population of PLWH, and the fact the no studies have been conducted under modern ART guidelines, there is a clear need for more research to determine the effect of HCV on mortality among PLWH.
32
enough to fully uncover the slowly progressing effects of HCV infection. Because those studies specifically excluded PLWH, they cannot be directly compared with our results, as risk factors for and causes of mortality differ between PLWH and the general population. Table 2 presents the results of a brief review of the literature investigating the effect of SVR on mortality in coinfected individuals from pre-DAA era studies. Using a broad search string, only 6 of 183 results were relevant. Of these six studies, three were conducted by the same research group using the same cohort (Berenguer et al. 2009; Berenguer et al. 2012; Berenguer et al. 2014), and five were conducted in Spain (Berenguer et al. 2009; Berenguer et al. 2012; Berenguer et al. 2014; Labarga et al. 2015; Mira et al. 2013). All six studies suffer from design and
methodological flaws. First, all of these studies compared coinfected individuals who had achieved SVR to those who did not respond to treatment or who were not treated. Because response to the older PEG-IFN-based treatments used in these studies is poor among people with HIV and HCV, factors related to general overall health and immune function are likely
33
further studies are needed in the DAA era in order to properly assess the effect DAA treatment will have on mortality among PLWH+HCV.
One other challenge with respect to HIV/HCV coinfection is that the effect of DAA therapy on SVR is not well-studied in real-world coinfected populations and cohorts. While many randomized trials have been conducted to evaluate the efficacy of DAAs in PLWH+HCV, their restrictive inclusion criteria make them non-generalizable to the actual population of coinfected individuals. A study of the representativeness of coinfected trial populations found that fewer than half of the members of a Canadian cohort of PLWH+HCV would have been eligible for even the least restricted trial, and in almost every other trial fewer than 10% of the cohort would have been eligible (Saeed et al. 2016). The most common reason for exclusion was due to subjects not following the specific ART regimens required by the trial, followed by exclusion due to active drug use (Saeed et al. 2016). Even if the exclusions for ART regimens were not in place, only 25% of the cohort members would have met the inclusion criteria for the majority of the trials (Saeed et al. 2016). The exclusion due to injection drug use is particularly troubling, as PWID are most likely to spread their infection to others and therefore, from a public health perspective, they may be a key population to target for HCV control efforts. Though evidence of the effectiveness of DAAs in real-world populations and cohorts of PLWH+HCV is beginning to accumulate and has shown SVR rates consistently greater than 90% (Hawkins et al. 2016; Sogni et al. 2016; Milazzo et al. 2017; Montes et al. 2017), further studies are needed to understand their effectiveness in other realistic coinfected populations, such as among PWID.
It is clear that additional research is needed to elucidate the role HCV plays among PLWH. Without an understanding of how HCV infection and treatment impact mortality in this
34
35
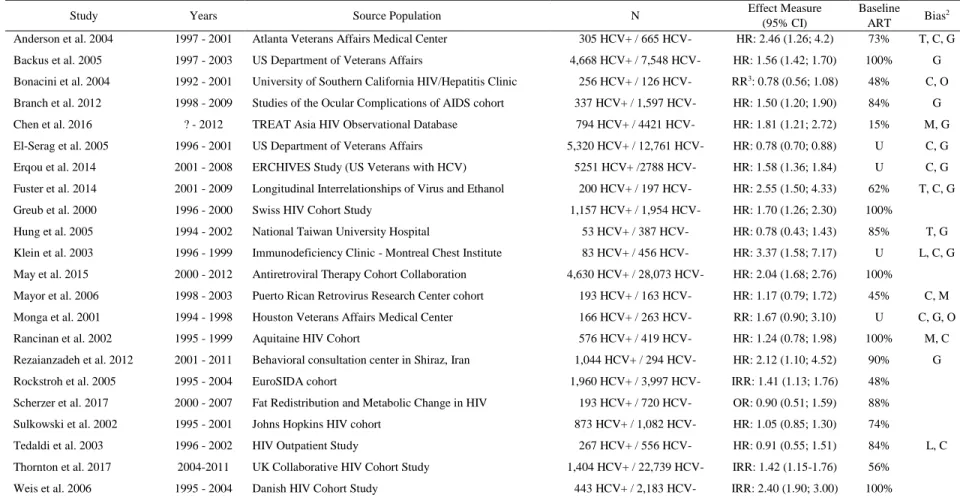
Table 1.1: Prior studies estimating the effect of HCV coinfection on mortality among people living with HIV in the ART era
Study Years Source Population N Effect Measure
(95% CI)
Baseline ART Bias
2 Anderson et al. 2004 1997 - 2001 Atlanta Veterans Affairs Medical Center 305 HCV+ / 665 HCV- HR: 2.46 (1.26; 4.2) 73% T, C, G Backus et al. 2005 1997 - 2003 US Department of Veterans Affairs 4,668 HCV+ / 7,548 HCV- HR: 1.56 (1.42; 1.70) 100% G Bonacini et al. 2004 1992 - 2001 University of Southern California HIV/Hepatitis Clinic 256 HCV+ / 126 HCV- RR3: 0.78 (0.56; 1.08) 48% C, O Branch et al. 2012 1998 - 2009 Studies of the Ocular Complications of AIDS cohort 337 HCV+ / 1,597 HCV- HR: 1.50 (1.20; 1.90) 84% G Chen et al. 2016 ? - 2012 TREAT Asia HIV Observational Database 794 HCV+ / 4421 HCV- HR: 1.81 (1.21; 2.72) 15% M, G El-Serag et al. 2005 1996 - 2001 US Department of Veterans Affairs 5,320 HCV+ / 12,761 HCV- HR: 0.78 (0.70; 0.88) U C, G Erqou et al. 2014 2001 - 2008 ERCHIVES Study (US Veterans with HCV) 5251 HCV+ /2788 HCV- HR: 1.58 (1.36; 1.84) U C, G Fuster et al. 2014 2001 - 2009 Longitudinal Interrelationships of Virus and Ethanol 200 HCV+ / 197 HCV- HR: 2.55 (1.50; 4.33) 62% T, C, G Greub et al. 2000 1996 - 2000 Swiss HIV Cohort Study 1,157 HCV+ / 1,954 HCV- HR: 1.70 (1.26; 2.30) 100%
Hung et al. 2005 1994 - 2002 National Taiwan University Hospital 53 HCV+ / 387 HCV- HR: 0.78 (0.43; 1.43) 85% T, G Klein et al. 2003 1996 - 1999 Immunodeficiency Clinic - Montreal Chest Institute 83 HCV+ / 456 HCV- HR: 3.37 (1.58; 7.17) U L, C, G May et al. 2015 2000 - 2012 Antiretroviral Therapy Cohort Collaboration 4,630 HCV+ / 28,073 HCV- HR: 2.04 (1.68; 2.76) 100%
Mayor et al. 2006 1998 - 2003 Puerto Rican Retrovirus Research Center cohort 193 HCV+ / 163 HCV- HR: 1.17 (0.79; 1.72) 45% C, M Monga et al. 2001 1994 - 1998 Houston Veterans Affairs Medical Center 166 HCV+ / 263 HCV- RR: 1.67 (0.90; 3.10) U C, G, O Rancinan et al. 2002 1995 - 1999 Aquitaine HIV Cohort 576 HCV+ / 419 HCV- HR: 1.24 (0.78; 1.98) 100% M, C Rezaianzadeh et al. 2012 2001 - 2011 Behavioral consultation center in Shiraz, Iran 1,044 HCV+ / 294 HCV- HR: 2.12 (1.10; 4.52) 90% G Rockstroh et al. 2005 1995 - 2004 EuroSIDA cohort 1,960 HCV+ / 3,997 HCV- IRR: 1.41 (1.13; 1.76) 48%
Scherzer et al. 2017 2000 - 2007 Fat Redistribution and Metabolic Change in HIV 193 HCV+ / 720 HCV- OR: 0.90 (0.51; 1.59) 88% Sulkowski et al. 2002 1995 - 2001 Johns Hopkins HIV cohort 873 HCV+ / 1,082 HCV- HR: 1.05 (0.85; 1.30) 74%
Tedaldi et al. 2003 1996 - 2002 HIV Outpatient Study 267 HCV+ / 556 HCV- HR: 0.91 (0.55; 1.51) 84% L, C Thornton et al. 2017 2004-2011 UK Collaborative HIV Cohort Study 1,404 HCV+ / 22,739 HCV- IRR: 1.42 (1.15-1.76) 56%
Weis et al. 2006 1995 - 2004 Danish HIV Cohort Study 443 HCV+ / 2,183 HCV- IRR: 2.40 (1.90; 3.00) 100%
PubMed search string: ((Hepatitis C) OR HCV) AND (HIV OR (Human Immunodeficiency Virus)) AND (Survival OR Mortality OR Death). HR: Hazard ratio; IRR: Incidence rate ratio; RR: Risk ratio; OR: Odds ratio; U: Unknown
1C: Regression control; R: Restriction; N: No control
2C: Uncontrolled confounding; G: Poor generalizability to US HIV-infected population; T: Improper methods for time-varying confounding; L: Loss to follow-up; M: Missing data; O: Other
36
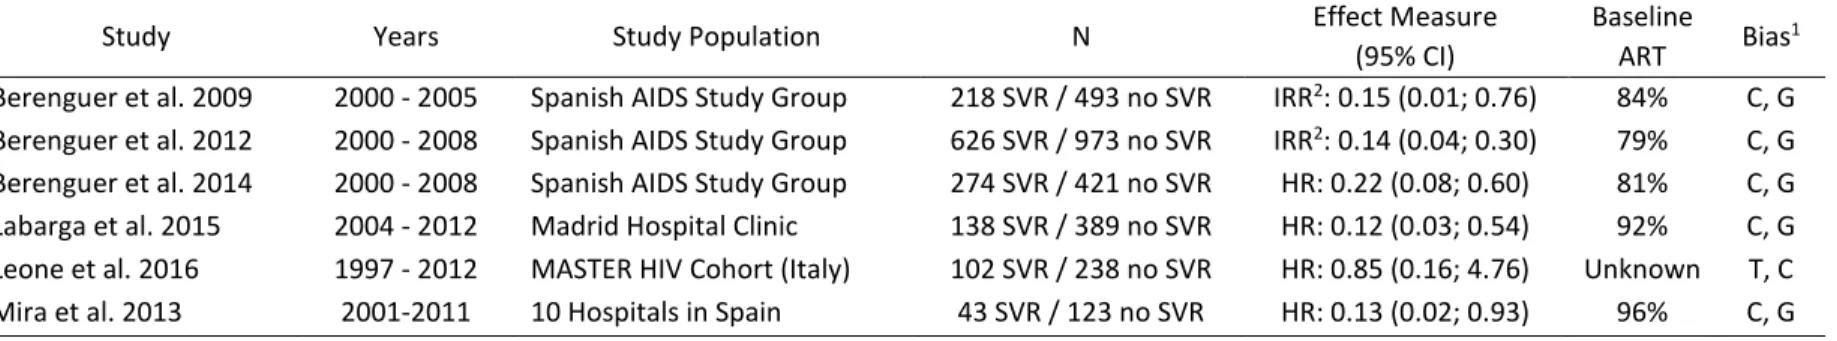
Table 1.2: Prior studies estimating the effect of HCV sustained virologic response on mortality among people living with HIV and HCV in the ART era
Study Years Study Population N Effect Measure
(95% CI)
Baseline
ART Bias
1 Berenguer et al. 2009 2000 - 2005 Spanish AIDS Study Group 218 SVR / 493 no SVR IRR2: 0.15 (0.01; 0.76) 84% C, G Berenguer et al. 2012 2000 - 2008 Spanish AIDS Study Group 626 SVR / 973 no SVR IRR2: 0.14 (0.04; 0.30) 79% C, G Berenguer et al. 2014 2000 - 2008 Spanish AIDS Study Group 274 SVR / 421 no SVR HR: 0.22 (0.08; 0.60) 81% C, G Labarga et al. 2015 2004 - 2012 Madrid Hospital Clinic 138 SVR / 389 no SVR HR: 0.12 (0.03; 0.54) 92% C, G Leone et al. 2016 1997 - 2012 MASTER HIV Cohort (Italy) 102 SVR / 238 no SVR HR: 0.85 (0.16; 4.76) Unknown T, C Mira et al. 2013 2001-2011 10 Hospitals in Spain 43 SVR / 123 no SVR HR: 0.13 (0.02; 0.93) 96% C, G PubMed search string: ((Hepatitis C) OR HCV) AND (HIV OR (Human Immunodeficiency Virus)) AND ((Sustained Virologic Response) OR SVR OR Cure) AND (Survival OR Mortality OR Death)
SVR: Sustained virologic response; IRR: Incidence rate ratio; H: Hazard ratio
37
CHAPTER 2: STATEMENT OF SPECIFIC AIMS 2.1 Specific Aims and Justification
To further elucidate the role of HCV infection and DAA treatment on mortality among PLWH, at both the individual and population levels, this work has the following aims:
Aim 1
Estimate the effect of chronic hepatitis C infection and its treatment on 10-year all-cause mortality among PLWH in the Multicenter AIDS Cohort Study and Women’s Interagency HIV Study had they initiated ART upon study entry.
Justification and approach: While HCV is known to substantially impact long-term all-cause mortality in the general population, its effect among PLWH remains unclear. Further, due to the fairly recent development of effective treatment for HCV, no studies have assessed the impact of treating HCV with DAA therapies on all-cause mortality in this population. Additionally, no studies of HCV or DAA treatment on mortality have been conducted in the era of modern HIV treatment guidelines. In this aim, we will use the parametric g-formula to assess the effect on 10-year all-cause mortality of a joint exposure consisting of HCV infection at baseline and ART initiation at study entry, compared with no HCV infection at baseline and ART initiation at study entry. Additionally, we will estimate the effect of treating HCV with DAAs among
38
policy decisions, as most patients not receiving treatment for their HIV would likely not receive treatment for HCV.
Aim 2
Estimate the effects on 10-year all-cause mortality among PLWH+HCV, as well as the population intervention effects among PLWH in general, of having all PLWH in the MACS and WIHS initiate ART at study entry and treating 1) all PLWH+HCV, 2) PLWH+HCV selected based on their hepatic fibrosis and viral suppression status, and 3) randomly selected proportions of PLWH+HCV, with proportions equal to the proportions treated under the policies in (2).
39 2.2 Rationale
Hepatitis C (HCV) is a common co-infection of HIV. Of the approximately 40 million PLWH worldwide, an estimated 4-5 million are also have HCV (Alter 2006). This proportion is even higher in the United States, where an estimated 25% of the population of PLWH is
coinfected with HCV (Centers for Disease Control and Prevention 2017a). Since the widespread adoption of combination antiretroviral therapy (ART) in the United States, the prognosis for PLWH has drastically improved, with life expectancies now approaching those of the people without HIV (Nakagawa et al. 2013).
Unfortunately, PLWH and HCV (PLWH+HCV) have experienced more modest gains. The rate of all-cause mortality among PLWH+HCV is estimated to be between 1.7 and 2.5 times the rate among PLWH only (Anderson et al. 2004; Greub et al. 2000), though other studies have found no effect of HCV on all-cause mortality among PLWH (Sulkowski et al. 2002; Scherzer et al. 2017). In addition, PLWH+HCV have increased morbidity due to both their HIV and HCV infections (Greub et al. 2000; Koziel & Peters 2007; Sulkowski & Thomas 2003; Graham et al. 2001; Bambha et al. 2012).
40
et al. 2013). The SVR rate with DAA therapy can be over 97% (Afdhal et al. 2014), with similar effectiveness among PLWH+HCV (Sogni et al. 2016; Hawkins et al. 2016; Milazzo et al. 2017).
DAAs come with a significant cost, however, with the current list price of Sofosbuvir being $84,000 (University of Washington 2017). These treatments are therefore well-suited for viewing through the lens of precision medicine, in which treatments are targeted to populations expected to achieve the greatest benefit. Currently, many state Medicaid programs limit DAA treatment to those who meet certain clinical criteria, such as those who abstained from illicit drugs and alcohol, who have achieved HIV suppression, or who have progressed to severe fibrosis or cirrhosis (Ooka et al. 2017), despite guidelines suggesting that nearly all people with HCV should be treated regardless of clinical factors (American Association for the Study of Liver Diseases & Infectious Diseases Society of America 2017). To date, no studies have been conducted to assess the effect of HCV infection and DAA treatment policies on all-cause mortality among PLWH who receive ART regardless of CD4 cell count, as is recommended by current HIV treatment guidelines (Panel on Antiretroviral Guidelines for Adults and Adolescents 2018).
Randomized controlled trials evaluating the effect of HCV interventions on mortality in this population are infeasible due to the long period between HCV infection and clinical
41
addition to average treatment effects, this work will also estimate population intervention effects (Westreich 2017) that contrast the observed mortality in the population of PLWH had all
individuals initiated ART immediately with that which would be observed if all PLWH initiated ART immediately and certain subgroups of PLWH+HCV were treated for their HCV.
By taking a ‘patients to policy’ approach (Westreich 2017), the results of this work will provide important evidence for both clinicians and policymakers. Given the many comorbidities that the aging population of PLWH experience, it is necessary to understand the conditions that have the greatest impact on patient and population health. By estimating standard exposure and treatment effects as well as population intervention effects, these results will aid in determining how to prioritize HCV treatment against treatments for other HIV comorbidities and will provide valuable evidence for guiding policies with regards to HCV treatment.
2.3 Quantities to be estimated
As both aims of this work involve the estimation of disease, treatment, and intervention effects, no statistical hypothesis tests will be conducted. The following quantities, in the form of risk differences and risk ratios, will be estimated in this work (each quantity will be estimated after first applying a hypothetical intervention to have all study participants initiate ART at baseline):
Aim 1
1) The effect of baseline chronic HCV on 10-year all-cause mortality among PLWH in the MACS and the WIHS.
42
3) The effect of DAA treatment at study entry on 10-year all-cause mortality among PLWH+HCV in the MACS and the WIHS.
Aim 2
1) The effect of treating all PLWH+HCV with DAAs at study entry on 10-year all-cause mortality in the MACS and the WIHS.
2) The effect of treating PLWH+HCV with DAAs after they progress to severe liver fibrosis or cirrhosis on 10-year all-cause mortality in the MACS and the WIHS.
3) The effect of treating PLWH+HCV with DAAs after they achieve HIV suppression on 10-year all-cause mortality in the MACS and the WIHS.
4) The effect of treating PLWH+HCV with DAAs after they progress to severe liver fibrosis or cirrhosis and achieve HIV suppression on 10-year all-cause mortality in the MACS and the WIHS.
5) The effect of treating randomly selected PLWH+HCV with DAAs at baseline, with proportions selected equal to the proportions treated in 2-4, on 10-year all-cause mortality in the MACS and the WIHS.
43
CHAPTER 3: METHODS 3.1 Description of data sources
The Multicenter AIDS Cohort Study
The Multicenter Aids Cohort Study (MACS) is an ongoing study of men who have sex with men (MSM) with and without HIV (Kaslow et al. 1987). The MACS began as in 1984 with the goals of describing the natural history of AIDS, determining the biological and behavioral factors that caused AIDS, and collecting biological specimens for further research (Kaslow et al. 1987). After HIV was discovered to be the causative agent of AIDS in 1983 (Barre-Sinoussi et al. 1983; Gallo et al. 1983), the goals of the MACS changed (Kaslow et al. 1987). First, the MACS seeks to identify and evaluate HIV seropositive men in the study, which included determining
correlates of seropositivity and describing the natural history of HIV. Second, the study aims to identify and evaluate HIV seroconverters, in particular by determining the factors associated with seroconversion, characterizing the early phases of HIV infection, and determining the relationship between clinical status, viremia, and host immune response. Third, the study seeks to characterize those who did not seroconvert to identify protective factors against infection and determine whether or not HIV infection was possible without seroconversion. Lastly, the MACS aims to design additional studies of HIV prevention and therapy. Since its inception, many additional aims and substudies have been added to the MACS protocols.
The MACS has study sites in four locations across the United States: Baltimore,