INFLUENZA VACCINE EFFECTIVENESS AMONG PATIENTS ON HEMODIALYSIS: METHODS TO CONTROL THE HEALTHY-USER BIAS
Leah Jill Sirkus McGrath, MHS
A dissertation submitted to the faculty of the University of North Carolina at Chapel Hill in partial fulfillment of the requirements for the degree of Doctor of Philosophy in the Department of Epidemiology.
Chapel Hill 2012
Approved by:
M. Alan Brookhart, PhD
Stephen Cole, PhD
Abhijit Kshirsagar, MD, MPH
Til Sturmer, MD, PhD, MPH
ii ABSTRACT
LEAH JILL SIRKUS MCGRATH: Influenza vaccine effectiveness among patients on hemodialysis: methods to control the healthy-user bias
(Under the direction of M. Alan Brookhart)
Background: Patients with end-stage renal disease (ESRD) are at
increased risk for several preventable infections. Although vaccines have been
recommended for people with ESRD for many years, little is known about the
level of vaccine effectiveness (VE) in preventing clinical health outcomes in this
population. Observational studies of VE are challenging, however, because
vaccinated persons may be healthier than unvaccinated persons. This
dissertation aims to estimate influenza vaccine effectiveness among patients on
hemodialysis using novel ways to control for bias.
Methods: Using Medicare claims from patients on hemodialysis, a natural
experiment was created by using year-to-year variation in the match of the
influenza vaccine to the circulating virus. VE for influenza-like illness,
influenza/pneumonia hospitalization, and mortality was estimated by comparing
matched (1998, 1999, 2001) and mismatched (1997) years among vaccinated
patients. An alternate method identified time-varying predictors of vaccination
status and used these variables to control for time-varying confounding using a
iii
Results: Conventional estimates comparing vaccinated patients with
unvaccinated patients suggested a large protective effect – influenza vaccine
reduced mortality by 30%. The pooled VE estimate from the natural experiment
of comparing matched seasons to a placebo was 0% (95% CI: -3,2%) for
influenzalike illness, 2% (95% CI: 2,5%) for hospitalization, and 0% (95% CI:
-3,3%) for death. Hospitalization and skilled nursing care were highly associated
with not being vaccinated, suggesting that these variables could be used to
control for the healthy-user bias. The marginal structural model remained biased
even after accounting for time-varying confounding, which likely resulted in
exaggeration of the protective effect of the vaccine.
Conclusions: Strong confounding bias is present when estimating
influenza vaccine effectiveness. Controlling for bias using a natural experiment
resulted in estimates of VE for all outcomes that were close to the null. This
suggests that the current influenza vaccine strategy may have a smaller effect on
morbidity and mortality in the ESRD population than previously thought. Alternate
strategies (high dose vaccine, intradermal vaccine, and adjuvanted vaccines)
iv
ACKNOWLEDGEMENTS
I am deeply grateful for the support of my dissertation chair – Alan
Brookhart. He arrived at UNC at the time when I was desperately trying to find an
advisor who was interested in vaccines. Since taking me under his wing, he has
provided invaluable technical and practice advice, without which I would not have
completed this dissertation. I would also like to thank my committee members,
Steve Cole, AbhiKshirsagar, Til Sturmer and David Weber for providing useful
comments and guidance as this project developed. Finally, I am indebted to Lily
Wang for teaching me so much about SAS programming and efficiency with
large datasets.
I am thankful for all of the support from my family and friends, particularly
my husband, Brian. His encouragement motivated me to keep going through this
long process. Also, the support of my parents who have always known I would
one day be finished with school. And to my friends at UNC who have truly been
wonderful to work and learn with, thank you.
Finally, I must mention something that Charlie Poole taught us on the first
day of our epidemiology methods class. He said that the dissertation process and
our epidemiology careers would forever become a road with peaks and valleys.
For all the times I was and will be in those valleys, I will think back to that class
v
TABLE OF CONTENTS
LIST OF TABLES ... viii
LIST OF FIGURES ... x
LIST OF ABBREVIATIONS ... xi
I. INTRODUCTION... 1
References ... 3
II. REVIEW OF THE LITERATURE... 5
Overview of end-stage renal disease ... 5
A. Vaccinations and the ESRD population ... 13
B. Measuring influenza vaccine effectiveness ... 17
C. References ... 26
III. STATEMENT OF SPECIFIC AIMS ... 33
IV. METHODS ... 36
Subject identification ... 36
A. Exposure and outcome definitions ... 39
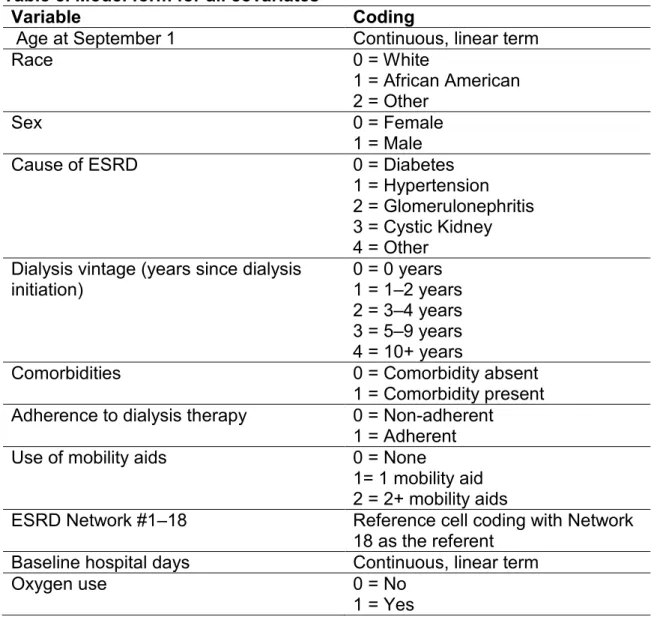
B. Covariate definitions ... 42
C. Statistical model ... 44
D. Methods pertaining to Specific Aim One ... 45
E. Methods pertaining to Specific Aim Two ... 47
vi
References ... 52
V. RESULTS: “EVALUATING INFLUENZA VACCINE EFFECTIVENESS
AMONG PATIENTS ON HEMODIALYSIS USING A NATURAL
EXPERIMENT” ... 55
Introduction ... 55 A.
Methods ... 57 B.
Results ... 62 C.
Discussion ... 63 D.
Tables and figures ... 68 E.
Additional subgroup results... 72 F.
References ... 75
VI. RESULTS: “ASSESSING HOSPITALIZATION AND SKILLED NURSING CARE AS TIME-VARYING PREDICTORS OF INFLUENZA VACCINATION: AN EXAMPLE OF THE
HEALTHY-USER EFFECT” ... 79
Introduction ... 79 A.
Methods ... 80 B.
Results ... 84 C.
Discussion ... 85 D.
Tables and figures ... 89 E.
References ... 96
VII. RESULTS: “ESTIMATING INFLUENZA VACCINE EFFECTIVENESS
USING A MARGINAL STRUCTURAL MODEL TO
CONTROL FOR THE HEALTHY USER BIAS” ... 98
Introduction ... 98 A.
Methods ... 99 B.
vii
Discussion ... 105 D.
Tables and figures ... 109 E.
References ... 112
VIII. CONCLUSIONS ... 116
Strengths ... 118 A.
Limitations ... 120 B.
Future directions ... 122 C.
viii
LIST OF TABLES
TABLE 1. NUMBER AND RATE OF CASES OF ESRD BY AGE,
RACE AND ETHNICITY IN 2009 ... 6
TABLE 2. NUMBER AND RATE OF ESRD CASES BY TOP CAUSES IN 2009 ... 9
TABLE 3. RECOMMENDED VACCINATIONS FOR ESRD PATIENTS ... 15
TABLE 4. COMPARISON OF VE ESTIMATES FOR TRADITIONAL VERSUS IMPROVED ANALYSES ... 24
TABLE 5. STUDY ELIGIBILITY REQUIREMENTS... 39
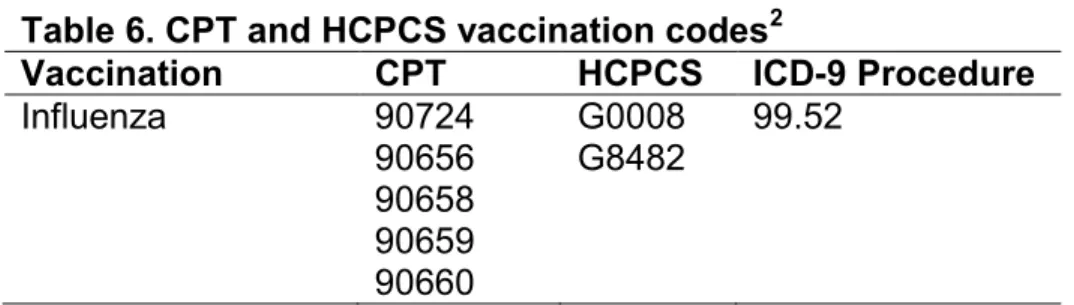
TABLE 6. CPT AND HCPCS VACCINATION CODES ... 40
TABLE 7. ICD-9-CM CODES USED TO DEFINE INFLUENZA-LIKE ILLNESS ... 41
TABLE 8. MODEL FORM FOR ALL COVARIATES ... 43
TABLE 9. CODES USED TO DEFINE THE USE OF MOBILITY AIDS AND OXYGEN USE ... 44
TABLE 10. DESCRIPTION OF SELECTED INFLUENZA SEASONS ... 46
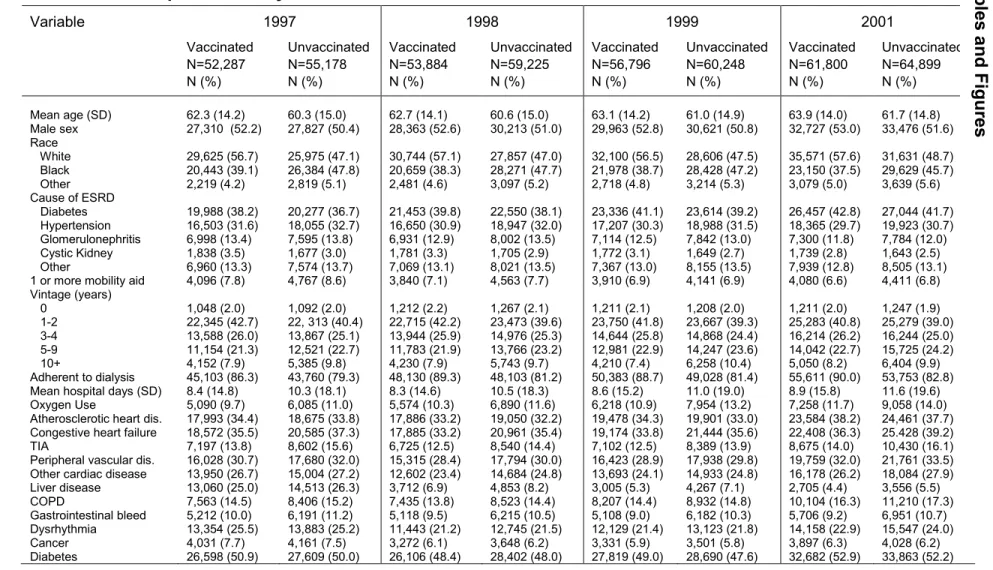
TABLE 11. DESCRIPTION OF STUDY COHORTS ... 68
TABLE 12. DESCRIPTION OF INFLUENZA SEASONS ... 69
TABLE 13. ESTIMATES OF VACCINE EFFECTIVENESS COMPARING VACCINATED VERSUS UNVACCINATED BY YEAR ... 69
TABLE 14. RATIO OF HAZARD RATIOS THAT ESTIMATE VE BY COMPARING MATCHED VERSUS MISMATCHED YEARS AMONG VACCINATED VERSUS UNVACCINATED ... 70
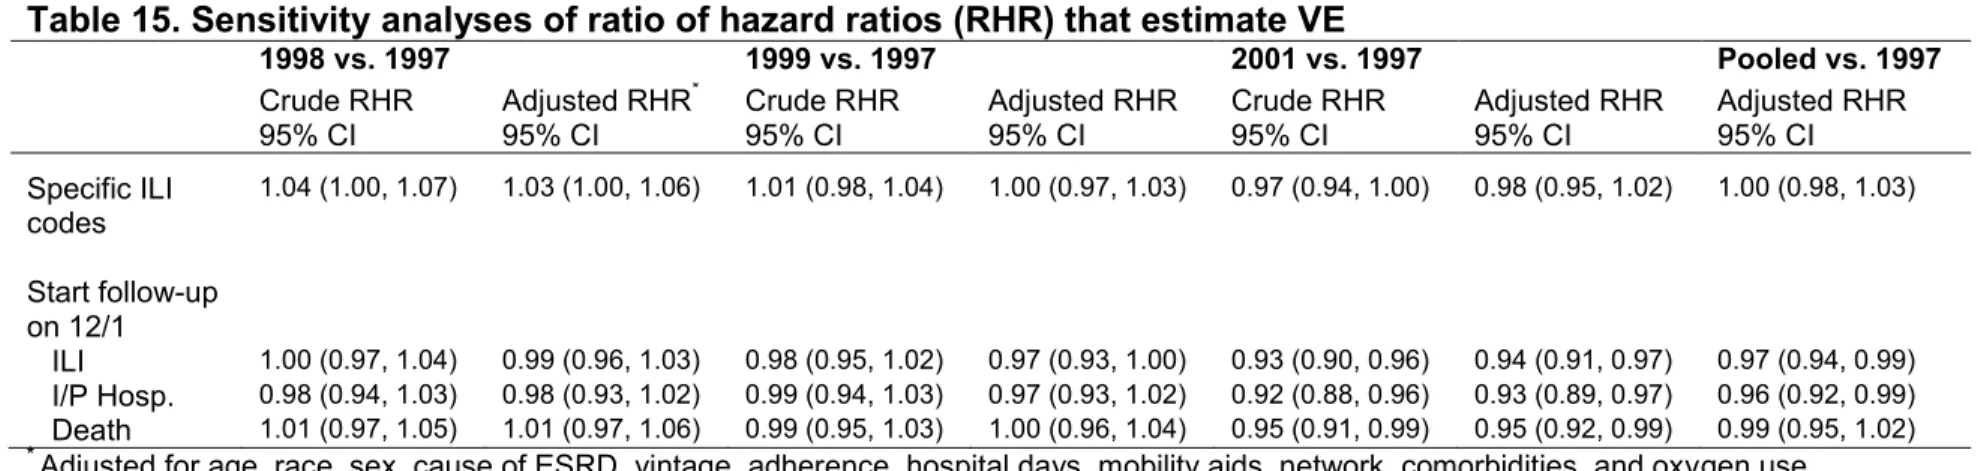
TABLE 15. SENSITIVITY ANALYSES OF RATIO OF HAZARD RATIOS THAT ESTIMATE VE... 70
TABLE 16. RATIO OF HRS BY AGE. ... 72
TABLE 17. RATIO OF HRS BY CAUSE OF ESRD ... 73
ix
TABLE 19. DESCRIPTION OF YEARLY COHORTS ... 89
TABLE 20. ADJUSTED HAZARD RATIOS FOR TIME FIXED VARIABLES AND VACCINATION STATUS BY YEAR ... 90
TABLE 21. ADJUSTED ASSOCIATION BETWEEN COMORBIDITIES AND VACCINATION STATUS BY YEAR ... 91
TABLE 22. ADJUSTED ASSESSMENT OF HOSPITALIZATION AND
SKILLED NURSING CARE AS TIME-VARYING PREDICTORS OF VACCINATION ... 92
TABLE 23. DESCRIPTION OF STUDY COHORTS ... 109
TABLE 24. ESTIMATES OF EFFECT OF VACCINATION ON MORTALITY USING STANDARD COX REGRESSION ... 110
TABLE 25. DISTRIBUTION OF WEIGHTS ... 110
x
LIST OF FIGURES
FIGURE 1. 2001-2002 INFLUENZA SEASON PERIODS ... 38
FIGURE 2. ANNUAL COHORT FOR THE 2000–2001 INFLUENZA SEASON DEFINED FOR STUDY AIM 3 ... 39
FIGURE 3. UNADJUSTED, POOLED SURVIVAL CURVES AMONG THE VACCINATED FOR A) ILI B) INFLUENZA/PNEUMONIA
HOSPITALIZATION C) DEATH ... 71
FIGURE 4. DISTRIBUTION OF VACCINATION ADMINISTRATION BY MONTH AND YEAR ... 93
FIGURE 5. CUMULATIVE INCIDENCE OF VACCINATION BY HOSPITAL DAYS AND YEAR ... 94
xi
LIST OF ABBREVIATIONS
ACIP Advisory Committee on Immunization Practices
APCs Antigen-presenting cells
CDC Centers for Disease Control and Prevention
CI Confidence interval
CMS Centers for Medicare and Medicaid Services
CPT Current Procedural Terminology
ESRD End-stage renal disease
HCPCS Health Care Financing Administration Common Procedural Coding System
HMO Health maintenance organization
HR Hazard ratio
ICD-9-CM International Classification of Diseases, 9th Revision, Clinical Modification
ILI Influenza-like illness
I/P Influenza/pneumonia
IPTW Inverse probability of treatment weights
RCT Randomized control trial
TIV Trivalent, inactivated influenza vaccine
USRDS United States Renal Data System
I. INTRODUCTION
End-stage renal disease (ESRD) is the final stage of kidney disease
where kidney function has decreased to less than 15% of normal and patients
require a kidney transplant or dialysis to survive. Patients with ESRD are likely to
have comorbidities, such as diabetes and hypertension, and are prone to
contracting infections. Infection is one of the main causes of morbidity and
mortality among patients with ESRD. It is the third leading cause of death, and
infection-related hospitalizations have increased 43% since 1993.1 Vaccinations
provide a simple, inexpensive way to protect these high-risk patients from
infections such as influenza, pneumococcal pneumonia, and Hepatitis B.
Although vaccines have been recommended for people with chronic renal
disease for many years,2 little is known about the characteristics of patients who
are vaccinated and the level of vaccine effectiveness in this population. One
recent study investigating usage of influenza vaccine among ESRD patients
reported less than 50% vaccination rates for both seasons between 1997-99.3
Influenza vaccines are recommended by the Advisory Committee on
Immunization Practices (ACIP) for people with chronic renal disease; however,
there are few studies in this population that investigate the effects of this vaccine
in relation to health outcomes. Most vaccine effectiveness studies have
2
among the elderly population, which showed that the vaccine reduced
lab-confirmed influenza by 50%.4 It has proven difficult to accurately estimate the
effectiveness of flu vaccine among the elderly population in non-experimental
studies due to severe confounding by functional status5 and the “healthy-user
effect”6 that is associated with receiving the vaccine. Although several
high-profile studies have suggested that the influenza vaccine may reduce all-cause
mortality by as much as 50%,7-9 more recent studies have suggested that these
estimates are due to confounding and the true effect may be small to
negligible.5,10-13 Studies to better elucidate the effects of selection bias as well as
the effectiveness of vaccines among the ESRD population are needed.
The United States Renal Data System (USRDS) is a population-based,
national system that collects information on all patients with ESRD in the United
States. Because all ESRD patients are eligible for Medicare coverage, this
system captures a substantial number of ESRD patient encounters, including
medication usage, vaccinations, hospitalizations and deaths. Data have been
collected from 1989-2007, thus the USRDS is an optimal data source for
investigating trends in vaccine use over time, as well as how effective vaccines
are in protecting against various health outcomes, such as hospitalization from
pneumonia. The number of people with ESRD is expected to continue to grow,
especially because of the growth of diabetes, which is a common cause of renal
failure. Therefore, it is imperative to understand the current state of vaccine
3
References
1. U.S. Renal Data System. USRDS 2011 Annual Data Report: Atlas of Chronic Kidney Disease and End-Stage Renal Disease in the United States. Bethesda, MD: National Institutes of Health, National Institute of Diabetes and Digestive and Kidney Diseases; 2011.
2. Centers for Disease Control and Prevention. Guidelines for Vaccinating Kidney Dialysis Patients and Patients with Chronic Kidney Disease. 2006; http://www.cdc.gov/vaccines/pubs/downloads/b_dialysis_guide-508.pdf. Accessed July 27, 2010.
3. Gilbertson DT, Unruh M, McBean AM, Kausz AT, Snyder JJ, Collins AJ. Influenza vaccine delivery and effectiveness in end-stage renal disease. Kidney Int. 2003;63(2):738-743.
4. Govaert TME, Thijs CTMCN, Masurel N, Sprenger MJW, Dinant GJ, Knottnerus JA. The Efficacy of Influenza Vaccination in Elderly Individuals. JAMA. 1994;272(21):1661-1665.
5. Jackson LA, Nelson JC, Benson P, et al. Functional status is a confounder of the association of influenza vaccine and risk of all cause mortality in seniors. Int J Epidemiol. 2006;35(2):345-352.
6. Brookhart MA, Patrick AR, Dormuth C, et al. Adherence to Lipid-lowering Therapy and the Use of Preventive Health Services: An Investigation of the Healthy User Effect. Am J Epidemiol. 2007;166(3):348-354.
7. Nichol KL, Nordin JD, Nelson DB, Mullooly JP, Hak E. Effectiveness of Influenza Vaccine in the Community-Dwelling Elderly. N Engl J Med. 2007;357(14):1373-1381.
8. Nichol KL, Baken L, Nelson A. Relation between influenza vaccination and outpatient visits, hospitalization, and mortality in elderly persons with chronic lung disease. Ann Intern Med. 1999;130(5):397-403.
4
10. Jackson LA, Jackson ML, Nelson JC, Neuzil KM, Weiss NS. Evidence of bias in estimates of influenza vaccine effectiveness in seniors. Int J Epidemiol. 2006;35(2):337-344.
11. Jackson ML, Nelson JC, Weiss NS, Neuzil KM, Barlow W, Jackson LA. Influenza vaccination and risk of community-acquired pneumonia in immunocompetent elderly people: a population-based, nested case-control study. Lancet. 2008;372(9636):398-405.
12. Simonsen L, Taylor RJ, Viboud C, Miller MA, Jackson LA. Mortality
benefits of influenza vaccination in elderly people: an ongoing controversy. Lancet Infect Dis. 2007;7(10):658-666.
II. REVIEW OF THE LITERATURE
Overview of End-Stage Renal Disease A.
Description and epidemiology of ESRD
End-stage renal disease (ESRD) is the final stage of kidney disease
where kidney function has decreased to less than 15% of normal and patients
require a kidney transplant or dialysis to survive. The kidneys can no longer
adequately eliminate nitrogenous waste or fluid and fail to perform other
biological processes including regulating pH.
In 2009, there were more than 570,000 patients with ESRD in the U.S.1
With the rising prevalence of diabetes and hypertension, this number is expected
to increase to 774,386 by 2020. The prevalent population has been steadily
increasing by ~2% each year since 2003. The incidence of ESRD has been rising
since the 1980s, and although the rate dropped slightly in 2007 and 2008, it
increased to 355 cases per million population (adjusted for age, gender, and
race).1 Table 1 shows that elderly people aged 75 years and older, and African
Americans have the highest rates of ESRD. In fact, the incidence rate of ESRD
among African Americans was 3.5 times the rate among Whites. In addition,
ESRD affects people with Hispanic ethnicity disproportionally – 13% of all new
cases of ESRD were among Hispanics, and the rate of ESRD among Hispanics
6
Table 1. Number and rate of cases of ESRD by age, race and ethnicity in 20091
Incidence Prevalence
Number Rate* per
million Number Rate* per million
Overall 113,908 355 571,414 1,738
Age
20-44 13,894 131 100,031 924
45-64 43,646 610 256,803 3,433
65-74 26,459 1,407 116,607 6,066
75+ 28,595 1,762 90,233 5,545
Race
White 75,077 277 347,268 1,279
African American 32,116 976 180,685 5,284
Native American 1,404 522 7,682 2,735
Ethnicity
Hispanic 14,766 501 87,866 2,538
Non-Hispanic 99,142 345 483,548 1,685
*Adjusted to 2005 population cohort.
Rates of ESRD vary substantially by geography. Generally, both incident
and prevalent rates of ESRD are highest in the south and southwestern regions
of the U.S. However, the oldest patients with incident ESRD are found in the
upper Midwest, the Northeast and Florida. In addition, the highest rate for Whites
and African Americans is in Pittsburg, Pennsylvania and for Hispanics is in
Cincinnati, Ohio.2
Patients with ESRD are very ill and mortality is high among this
population. In 2009, the mortality rate for all ESRD patients was 148.3 per 1,000
patient years and approximately 16% of prevalent cases of ESRD died. Mortality
rates for patients on dialysis who are 65 years or older are ~6.5 times higher than
the general population.1 The five-year survival for patients on dialysis is 34%;
7
patients aged 65 to 74 years is 26% and 13% for those aged 75 and older.1
Mortality is high during the first year of dialysis; specifically, months two and
three after initiation of dialysis have the highest mortality rates.3
The cost of care of the ESRD patient population is substantial. In 2009,
the cost of those covered through Medicare (~83% of all ESRD patients) was $29
billion, which was 6.7% of the total Medicare budget (not including Part D). This
cost increased 3.1% from 2008. Hemodialysis accounted for ~86% of the cost of
ESRD care. The per person per year cost of care for ESRD was $82,000.1 Costs
tend to be highest in the first year after initiating dialysis – due to high rates of
hospitalization during initiation – and averaged $113,000 among older ESRD
initiators.4
Causes of ESRD
The three most common causes of ESRD are diabetes, hypertension and
glomerulonephritis. The mechanisms of kidney damage between these three
causes frequently overlap, and often a patient will have both diabetes and
hypertension, which can accelerate the process.
Diabetes is the most common cause of ESRD. Approximately 30% of
people with Type 1 diabetes and 25 to 40% of Type 2 diabetics develop ESRD,5
although the disease generally does not appear until decades after the initial
diabetes diagnosis. It is thought that hyperfiltration and a simultaneous increase
in the glomerular filtration rate causes the initial damage to kidney capillaries,
which eventually leads to loss of nephrons.5 In addition, complexes called
8
damage. AGEs occur when excess glucose is bonded to red blood cells.6 These
complexes can be deposited within the capillaries in the kidney, contributing to
increased pressure and subsequent increase in glomerular filtration rate.
Hypertension can also induce damage to the kidneys. High blood pressure
is one of the leading predictors of development of ESRD.7 Hypertension can lead
to higher pressure in the kidneys, which results in changes to the structure of the
kidney capillaries and an ultimate loss in nephrons in similar ways as described
earlier. It is thought that the renin-angiotensin system is also disrupted, further
causing changes to blood pressure.8,9
Glomerulonephritis is the third leading cause of ESRD, and is a term that
encompasses many diseases that are characterized by inflammation of
glomerular capillaries, and development of subsequent signs of nephritic
syndrome including hematuria and proteinuria.10 In some cases, infection is the
causative agent that triggers an auto-immune response, leading to renal
damage. Other diseases, such as lupus, are chronic autoimmune diseases,
which can cause similar damage over time. These generally have an acute
phase of glomerular damage, characterized by deposits of immune-complexes in
the glomerular capillaries, leading to an eventual loss of nephrons.10
Diabetes has been increasing as the primary cause of ESRD. In 2007,
44% of new cases listed diabetes as the cause, whereas 28% were due to
hypertension (Table 2). Incidence of ESRD due to diabetes has been increasing
among younger minorities, although it seems to be stable among older
9
Table 2. Number and rate of ESRD cases by top causes in 20091
Incident ESRD Prevalent ESRD
Cause of ESRD Number Rate* per million Number Rate* per million
Diabetes 50,970 154 215,245 647
Hypertension 32,688 101 140,498 429
Glomerulonephritis 7,612 24 84,883 263
*Adjusted for age, gender, and race
Dialysis
Dialysis is the mechanical process by which the blood of an ESRD patient
is cleaned of excess water, minerals and other products of metabolism. There
are two types of dialysis: hemodialysis and peritoneal dialysis. Here we restrict
our discussion to hemodialysis. The process of hemodialysis begins with a
patient’s blood flowing through tubes into a cylindrical structure called the
dialyzer while a premixed solution called the dialysate flows into the dialyzer in
the opposite or countercurrent direction. A semi-permeable membrane
composed of synthetic material separates the blood and dialysate compartments,
but allows for the diffusion of solutes and the movement of water. After the blood
has passed through the dialyzer, it is returned to the patient through a separate
tube. Patients undergoing hemodialysis generally must attend dialysis clinics
three times a week. A small fraction of patients will attend only twice a week, if
they have a higher level of kidney function. Hemodialysis sessions last
approximately three to four hours.
There are several types of facilities that administer hemodialysis to ESRD
patients. The facilities are generally divided into for-profit and non-profit
10
more than 200,000 patients combined. In addition, there are a variety of smaller
dialysis organizations and hospital-based dialysis units that are other options for
patients; however these facilities generally operate on a regional basis.
Infectious complications
Infection is the third leading cause of death (behind cardiovascular and
“other” causes) and the second leading cause of hospitalization among ESRD
patients. Infection-related hospitalizations have increased 43% since 1993.1
Infection-related hospitalization is especially high within the first year of starting
dialysis, and has increased nearly 100% since 1993.3 During 1996–2001, the
one-year incidence proportion of infection-related hospitalization was 32%
among adults initiating hemodialysis, and the three-year incidence was 53%.11
The most common causes of infection-related hospitalization reported by the
Hemodialysis Study – a randomized trial investigating the effects of dialysis dose
- were infection from an unknown source including sepsis and bacteremia (35%),
vascular access infection (23%) and respiratory infection (22%).12
Impaired immune response in ESRD patients
ESRD patients have impaired immune systems, which may complicate the
response to vaccinations. It is thought that immune dysfunction is a result of two
processes: (a) immune deficiency of both the adaptive and innate immune
systems caused by uremic toxins and (b) immune activation resulting in chronic
inflammation caused by the dialysis procedure.13 Although many pathways of the
innate immune system are affected, here we will concentrate on the adaptive
11
attaining an adequate response to vaccinations, particularly B-cell production of
antibodies. The predominant cells of the adaptive immune system that are
directly depressed in ESRD patients are T-cells, although B-cells and
antigen-presenting cells (APCs) are also affected. T-cells control immunity by either
directly attacking pathogens (killer T-cells) or by indirectly stimulating cells to
produce antibodies (helper T-cells) and must be activated prior to differentiation.
It is thought that overall T-cell activation is reduced in patients with ESRD.13 In
addition, uremic toxins in the blood causes the function of APCs to decline, which
thus impairs the ability of T-cells to differentiate.14 Patients with ESRD have
fewer B-cells due to the indirect effect of having fewer helper T-cells and the
direct effect of having a higher likelihood of B-cell apoptosis or cell-death.15
Furthermore, the frequent, invasive process of hemodialysis has been shown to
produce chronic inflammation. Inflammatory cytokines are upregulated and push
differentiation toward the Th1 pathway (leading to more killer T-cells), which
results in even fewer B-cells.16 Finally, inflammation has been shown to be linked
to atherosclerosis,17 which can lead to development of cardiovascular events and
further impaired renal function, leading to further uremia and immune system
dysfunction.
Preventive Services
Patients with ESRD generally have multiple health problems, some of
which can be addressed with preventive care. There are several preventive care
services that are recommended for patients with ESRD, including erythropoietin
12
intravenous vitamin D for common bone mineral metabolism disorders, diabetes
and blood pressure management, and vaccinations.
Anemia is a common problem in patients with ESRD. The National Kidney
Foundation recommends that any person on dialysis achieve a hemoglobin level
between 11.0-12.0 g/dl and no greater than 13.0 g/dl.18 In 2009, only 40% of
patients were within this target.1 Anemia can be caused by iron deficiency, low
levels of erythropoietin, or both.19 In patients with severe anemia, using
erythropoietin-stimulating agents and intravenous iron supplementation raises
hemoglobin levels, which has shown beneficial effects for health outcomes.20
However, controversy persists about optimal hemoglobin targets as RCTs have
demonstrated that full correction of anemia may increase mortality risk.
Diabetes and hypertension are common causes of ESRD and
management of these diseases can help to slow the progression of kidney
failure. Patients with diabetes can slow kidney damage with glycemic control
through insulin or oral hypoglycemic medications.5 It is recommended that
diabetic patients receive A1c tests, lipid tests, and eye exams periodically.
However, only 17% of ESRD patients received all three tests in 2009.1 In
addition, it has been shown that treatment with blood pressure medications that
affect glomerular pressure, such as angiotensin-converting enzyme inhibitors
decrease the rate of renal failure among chronic kidney disease patients,
although multiple medications may be needed.7,9
Vaccinations are another preventive service that can have significant
13
patients with ESRD. Although this population has a weakened immune system,
vaccinations generally produce an adequate immune response to protect against
future infection21 and have been found to be cost-effective, especially in older
adults with chronic illness.22,23
The health status of patients with ESRD is complicated by multiple factors.
These patients are usually taking many medications to manage their multiple
disease conditions as well as undergoing dialysis. However; because these
patients are in contact with the health care system several times per week, there
are multiple opportunities to administer these additional preventive services. The
combination of a high annual mortality rate and the nearly $24 billion in annual
healthcare costs incurred by these patients represent a clinical and public health
priority for the optimal management, including preventive care, of ESRD.
Vaccinations and the ESRD population B.
Vaccinations indicated for ESRD patients
The ACIP24 recommends that all ESRD patients and patients with chronic
kidney disease receive influenza, Hepatitis B, and pneumococcal vaccines. Other
vaccines, such as Hepatitis A and tetanus/diphtheria/pertussis, can be
administered on an as-needed basis.
Trivalent, inactivated influenza vaccine (TIV) is indicated for yearly
administration among ESRD patients. TIV is made by growing the virus in
chicken eggs. Subsequently, the virus is inactivated and purified into the vaccine
form.25 TIV contains three strains of influenza: Type A (H1N1), Type A (H3N2),
14
process called antigenic drift. Therefore, the strains included in the vaccine are
updated on a yearly basis to better match the strains that are circulating in the
community. The vaccine is most effective when administered at least 2 weeks
prior, but no more than 4 months before exposure to influenza in the community.
Because influenza peaks between December and March, the optimal time for
vaccination is October and November.25 Vaccine is generally available as early
as September. ESRD patients should not receive the live attenuated influenza
vaccine due to their potential immunocompromised state.24 Although patients on
dialysis have lower response rates to influenza vaccine compared with healthy
adults, it has been shown that 46–87% of dialysis patients developed protective
antibody titers after vaccination.21,26
Hepatitis B vaccine is a recombinant vaccine, where the gene for
Hepatitis B surface antigen is inserted into yeast cells. The surface antigen gene
is expressed by the yeast cells, and the resulting protein is purified to form the
vaccine.25 It is recommended that all patients currently undergoing dialysis
treatment receive a higher vaccine dose than is normally administered, as the
immune response may not result in adequate antibody titers.24 Thus, the
recommended schedule is 3 doses of 40 micrograms each, given at 0, 1, and 6
months. In addition, antibody titers may wane faster among this population.
Generally, patients with an initial immune response will lose adequate protection
after one year following immunization.27 Antibody titers can be checked
15
doses. Booster doses should be provided when antibody levels drop below 10
mIU/mL.25
It is recommended that people who are at increased risk of pneumococcal
infection, including patients with ESRD, receive the 23-valent pneumococcal
polysaccharide vaccine. The vaccine contains 23 different strains of
Streptococcus pneumoniae, including the six serotypes that cause the majority of
invasive disease.28 Capsular polysaccharide antigens from each bacterial
serotype are purified to make the vaccine.25 Pneumococcal vaccine is typically
administered only once, but one booster dose can be given to ESRD patients
after 5 years. People with chronic kidney disease generally produce an adequate
response to immunization, however, the antibody level wanes faster than in
healthy subjects. One study showed that 71% of hemodialysis patients produced
a protective antibody level, but only 43% maintained that level at one year
post-vaccination.29 Generally, patients on dialysis have lower antibody titers than
those with chronic kidney disease who are not on dialysis.30
Table 3. Recommended vaccinations for ESRD patients
Vaccine Dosage
schedule
Amount Route
Influenza Yearly 0.50 mL Intramuscular
Hepatitis B 0, 1, 6 months + booster if needed
40 μg Intramuscular
Pneumococcal Once + 1 booster at >5 years
16
Utilization of vaccines among the ESRD population
The utilization of vaccines by patients with ESRD is low, even though
Medicare covers the entire cost of the vaccines. Reported Medicare coverage
rates are expected to be lower than the true utilization rate in the population
because people who are covered with private insurance or who pay out of pocket
(~17% of ESRD patients1) are not captured in coverage rates. However,
estimation of relative trends over time should remain unbiased. Examination of
these trends shows an increase in uptake for influenza, pneumococcal and
Hepatitis B vaccines over the last ten years.1
Influenza vaccination rates remain much lower than the Healthy People
2010 goal of 90% coverage, even after increased educational campaigns. In
2009, only 64.3% of ESRD patients were reported to be vaccinated for influenza.
Hemodialysis patients had a slightly higher vaccination rate of 69.3%1, which is
a 42% increase compared to the epidemic year of 1998–1999 where the
immunization rate among hemodialysis patients was 48.8%.31
Overall pneumococcal vaccination rates remain low. Among patients with
ESRD, revaccination is recommended once after 5 years.28 Because patients
could have been vaccinated prior to initiating dialysis, it is difficult to measure the
absolute vaccination rate. However, trends over time suggest that rates of
vaccination remained stable at approximately 13% until 2001, when the rates
began increasing dramatically.3 Although rates began to plateau in 2005, by
2009 the vaccination rate had doubled to 26%.1 Hemodialysis patients have a
17
Hepatitis B vaccine has historically been an underused vaccine in the
ESRD population and continues to be underutilized even though ESRD patients
are at high risk of contracting Hepatitis B. In 2009, only 22.1% of patients
received one Hepatitis B vaccine, meaning the percentage of patients receiving
the required three doses was even lower.1 Although the usage rate is low, not all
prevalent ESRD patients may currently need a vaccine as evidenced by antibody
testing. The rate among new dialysis initiators is unknown and may be a better
indicator of coverage. Regardless of the method of calculation, the rates are
lower than they should be. The low usage rates of Hepatitis B vaccine are most
likely due to the sub-optimal antibody response rates that are achieved with this
vaccine in this population. Investigations are currently ongoing into using different
routes of administration of vaccine32 and various adjuvants that may increase
response rates and duration of protection.33
Measuring influenza vaccine effectiveness C.
Methodological considerations in measuring influenza vaccine effectiveness
Vaccine effectiveness (VE) is generally measured by comparing outcomes
in people who are vaccinated versus those who are not vaccinated. Effectiveness
is expressed as a percentage and is calculated as: VE = 1 - a measure of relative
risk (i.e., risk ratio, odds ratio, hazard ratio).34 Past studies of influenza vaccine
effectiveness have focused on seniors older than 65 years, as this population is
at higher risk of death from influenza, and the true effect of the vaccine is
uncertain and likely lower than in healthy adults due to immune senescence.
18
control trials would be unethical to implement. Because vaccination is a
preventive service, those that are vaccinated may constitute a much different
population then those that are unvaccinated, leading to substantial confounding.
Thus, there is significant controversy on the role of biases in influenza VE
studies.
The bias that occurs when users of a preventive medication are a different
population than nonusers is called the healthy-user bias. This bias is apparent
when the users also undertake other healthy behaviors. This confounds the
drug-disease relationship, making the drug or vaccine under study look better than it
actually is.35 The healthy-user bias has been illustrated in studies of hormone
replacement therapy and cardiovascular disease36 and with statin therapy and
several disease outcomes.37,38 Conversely, it has been suggested in studies of
influenza vaccine effectiveness in the elderly–that patients who are not
vaccinated have a lower functional status.39 Often it is difficult to identify what
these “healthy behaviors” are and even more difficult to measure them in
administrative claims data. However, to obtain unbiased effect estimates it is
critical to adjust for this bias in the analysis.
There are several other factors to consider when estimating influenza VE.
First is the seasonality of influenza. Although influenza generally peaks between
December and March, the virus can begin circulating as early as November and
can last until May. Studies use different methods to delineate the start and end of
the flu season, as well as the start of the “pre-flu” season – the period after
19
maintenance organization (HMO)-based studies often obtain a clearer picture of
these dates by using laboratory results from testing isolates in their own patient
population. Studies using national data sources, including administrative claims
databases, usually use CDC estimates of national or regional estimates of
influenza circulation. Although this method may induce some exposure
misclassification, several studies have compared national estimates to local
estimates and found little difference in dates.40,41 Regional CDC estimates of
start and end dates generally do not vary substantially from national estimates.
The degree to which the vaccine matches the circulating strain is another
factor to consider. Each year, influenza vaccine includes three influenza strains
(A/H1N1, A/H3N2, B), which are chosen months in advance of the beginning of
the season and are based on the strains circulating in the southern hemisphere.
Sometimes the virus that predominates in a season undergoes significant drift,
and thus the vaccine does not provide immunity to that strain. Only seasons with
a well-matched vaccine are expected to be effective in preventing
influenza-related outcomes.
Some influenza seasons are more severe than others (i.e. there are more
deaths/hospitalizations due to pneumonia/influenza). It has been shown that
seasons that are predominated by A/H3N2 are generally more severe than
seasons with circulating A/H1N1 or B strains (this excludes the recent situation of
influenza shift, where an H1N1 strain re-assorted to produce a completely new
20
seasons because it is thought that the vaccine has the most effect on preventing
severe disease.
Finally, the specificity of the outcome studied will have an impact on the
estimate of VE. Studies vary in the outcome that is used: outcomes include
all-cause mortality, influenza/pneumonia (I/P)-specific mortality, all-all-cause
hospitalization, I/P hospitalization, cardiac hospitalization, and influenza-like
illness. One would expect that as the specificity of the outcome decreases, the
vaccine effectiveness would also decrease (for example, VE for all-cause
mortality should be expected to be lower than VE for I/P hospitalization),43
however this is not the case with traditional observational methods, due to
suspected selection bias.
Traditional methods to measure influenza vaccine effectiveness produce biased results
Many studies have reported large vaccine effectiveness estimates for
clinical health outcomes – some studies report up to a 50% reduction in all-cause
mortality.44-52 These estimates seem to be effected by substantial bias, as only
~5% of all wintertime, senior deaths are attributed to influenza.53 Furthermore,
traditional studies generally report a larger effect for all-cause mortality than more
specific outcomes such as I/P hospitalization, which is difficult to logically
interpret, as one would expect smaller estimates for less specific outcomes.
Nichol et al. used propensity score methods with logistic regression models to
adjust for several suspected confounders, but reported a 48% VE for all-cause
death, and a 27% VE for I/P hospitalization.54 Hak et al. used simple logistic
21
death, and 48% for hospitalizations.55 Nordin et al. used similar methods and
reported a reduction in all-cause death of between 35–61% and a reduction in
hospitalizations of 18–24% depending on the season.49
Methodological improvements in measuring influenza vaccine effectiveness
Using the pre-influenza period as a negative control
It is expected that VE during the “pre-influenza” period would be nearly
zero, as influenza is rarely circulating (i.e., only sporadic cases may be seen),
and thus the vaccine should not have any effect on health outcomes. Therefore,
estimates during the pre-influenza period that are greater than zero, must be
biased in some way. Several studies have used the pre-influenza period as a
negative control, by implementing a model-building strategy using this time
period to determine which variables adequately control the selection bias. These
variables are subsequently included in their final VE model, which is calculated
for the period during the influenza season.41,56,57
Including variables to account for confounding by frailty and the healthy-user bias
Jackson et al. have ascertained that functional status is a significant
confounder in the relationship between influenza vaccine and all-cause mortality
in seniors.39 The ability of elderly people to travel to a place to receive a vaccine
may be severely diminished if the person has limited mobility. Functional status is
generally assessed using medical record review and may include variables such
as presence of dementia, ability to walk without assistance (cane, walker, etc.),
requiring assistance to bathe, and living in a non-home setting such as an
22
50% less likely to receive influenza vaccine and 2 to 5 times more likely to die
than those with adequate functional status.39 Another cohort study using the
General Practice Research Database used the number of repeat prescriptions in
the preceding 12 months as a proxy for health status, which resulted in similar
estimates of VE for respiratory disease hospitalization and death.58 This study,
however, did not compare the estimates to the pre-influenza period to determine
the amount of residual bias.
It is uncertain whether functional status or frailty may act as a confounder
in the ESRD population. Because ESRD patients come into contact with health
care facilities 2 to 3 times per week, the issue of functionally being able to go out
to receive the vaccine may not an issue. However, patients who are very near
death (i.e., severely functionally limited) may be less likely to be vaccinated.
Thus, the association between functional status and vaccination may be different
in the ESRD population as compared with the general, elderly population.
Utilizing specific influenza seasons to determine effects of bias
Influenza seasons have varying levels of vaccine match. Using this
external information can also function to provide a negative control for
determining bias in estimating VE. To investigate the effects of bias on VE
estimates, using a season with poor vaccine match to the circulating strain,
should result in no effect, or at best a very small effect. Thus, if the estimate of
VE is large, it is most likely biased in some way. The 1997–1998 and 2003–2004
seasons had very low levels of vaccine match. Therefore, utilizing these seasons
23
season is another issue to consider when pooling seasons to measure the effect
of bias. One would expect more severe seasons to have higher levels of VE (i.e.,
if there is more virus circulating or a more virulent virus, the vaccine will have a
higher likelihood of preventing serious illness). When trying to estimate the upper
bound of VE, one should use severe seasons with high vaccine match.
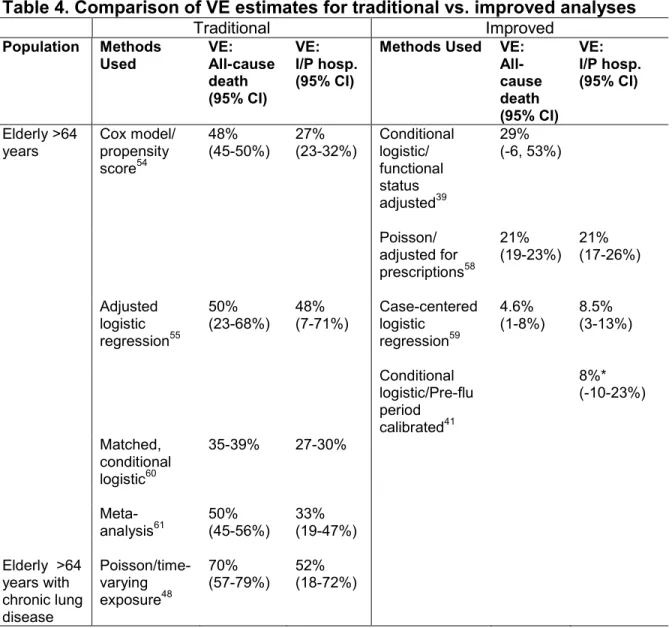
Summary of vaccine effectiveness estimates using improved methods
Several studies have implemented the previously mentioned
methodological improvements in elderly populations. Table 4 compares
estimates of VE using traditional methods with studies that incorporated
improvements to study design. Studies that use traditional adjustment methods
result in larger estimates of VE than methods used to control selection bias.
Thus, additional methods are needed to adequately control the healthy-user bias
24
Table 4. Comparison of VE estimates for traditional vs. improved analyses
Traditional Improved
Population Methods
Used VE: All-cause death (95% CI)
VE: I/P hosp. (95% CI)
Methods Used VE: All-cause death (95% CI) VE: I/P hosp. (95% CI) Elderly >64 years Cox model/ propensity score54 48% (45-50%) 27% (23-32%) Conditional logistic/ functional status adjusted39 29% (-6, 53%) Poisson/ adjusted for prescriptions58 21%
(19-23%) 21% (17-26%)
Adjusted logistic
regression55
50%
(23-68%) 48% (7-71%) Case-centered logistic
regression59
4.6%
(1-8%) 8.5% (3-13%)
Conditional logistic/Pre-flu period calibrated41 8%* (-10-23%) Matched, conditional logistic60
35-39% 27-30%
Meta-analysis61 50% (45-56%) 33% (19-47%)
Elderly >64 years with chronic lung disease Poisson/time-varying exposure48 70%
(57-79%) 52% (18-72%)
*VE estimate for community-acquired pneumonia
Using the ESRD population to measure vaccine effectiveness
There are many advantages to investigating methods for assessing
influenza VE among ESRD patients. First, all patients with ESRD are eligible for
Medicare and are captured in the USRDS. Although some patients do not have
Medicare as a primary payer (and thus more detailed information is not
captured), this proportion is small. Therefore, using the USRDS population
25
come into contact with health care facilities often, up to 2 to 3 times per week.
Thus, there are ample opportunities for vaccination. Although patients could
receive influenza vaccine from outside facilities (and thus not be reported through
Medicare), we think that this situation is most likely infrequent. Third, claims data
are reported monthly, thus we have ample time points to assess vaccination
status, hospitalizations, and other variables that may be useful in assessing
proximity to death/functional status such as administration of preventive
medications. Finally, there are many parallels between patients with ESRD and
the general elderly population. Both have impaired immune systems and the true
effectiveness of influenza vaccine is controversial in both populations. Methods
developed using data on ESRD patients may be transferable to investigation of
26
References
1. U.S. Renal Data System. USRDS 2011 Annual Data Report: Atlas of Chronic Kidney Disease and End-Stage Renal Disease in the United States. Bethesda, MD: National Institutes of Health, National Institute of Diabetes and Digestive and Kidney Diseases; 2011.
2. U.S. Renal Data System. USRDS 2009 Annual Data Report: Atlas of Chronic Kidney Disease and End-Stage Renal Disease in the United States. Bethesda, MD: National Institutes of Health, National Institute of Diabetes and Digestive and Kidney Diseases; 2009.
3. Collins AJ, Foley RN, Gilbertson DT, Chen S-C. The State of Chronic Kidney Disease, ESRD, and Morbidity and Mortality in the First Year of Dialysis. Clin J Am Soc Nephrol. 2009;4(Supplement_1):S5-11.
4. Mau LW LJ, Qiu Y, Guo H, Ishani A, Arneson TJ, Gilbertson DT, Dunning SC, Collins AJ. Trends in patient characteristics and first-year medical costs of older incident hemodialysis patients, 1995-2005. Am J Kidney Dis. 2010;55(3):549-557.
5. Hall PM. Prevention of progression in diabetic nephropathy. Diabetes Spectr. 2006;19(1):18-24.
6. Sego S. Pathophysiology of diabetic nephropathy. Nephrol Nurs J. 2007;34(6):631-633.
7. Ljutic D, Kes P. The role of arterial hypertension in the progression of non-diabetic glomerular diseases. Nephrol Dial Transplant.
2003;18(suppl_5):v28-v30.
8. Kobori H, Nangaku M, Navar LG, Nishiyama A. The Intrarenal Renin-Angiotensin System: From Physiology to the Pathobiology of Hypertension and Kidney Disease. Pharmacol Rev. 2007;59(3):251-287.
9. Martinez-Maldonado M. Role of hypertension in the progression of chronic renal disease. Nephrol Dial Transplant. 2001;16(suppl_1):63-66.
27
11. Chavers BM, Solid CA, Gilbertson DT, Collins AJ. Infection-Related Hospitalization Rates in Pediatric versus Adult Patients with End-Stage Renal Disease in the United States. J Am Soc Nephrol. 2007;18(3):952-959.
12. Allon M, Depner TA, Radeva M, et al. Impact of Dialysis Dose and
Membrane on Infection-Related Hospitalization and Death: Results of the HEMO Study. J Am Soc Nephrol. 2003;14(7):1863-1870.
13. Eleftheriadis T, Antoniadi G, Liakopoulos V, Kartsios C, Stefanidis I. Basic Science and Dialysis: Disturbances of Acquired Immunity in Hemodialysis Patients. Semin Dial. 2007;20(5):440-451.
14. Kato S, Chmielewski M, Honda H, et al. Aspects of Immune Dysfunction in End-stage Renal Disease. Clin J Am Soc Nephrol. 2008;3(5):1526-1533.
15. Fernández-Fresnedo G, Ramos MA, González-Pardo MC, de Francisco ALM, López-Hoyos M, Arias M. B lymphopenia in uraemia is related to an accelerated in vitro apoptosis and dysregulation of Bcl-2. Nephrol Dial Transplant. 2000;15(4):502-510.
16. Girndt M, Sester M, Sester U, Kaul H, KÖhler H. Molecular aspects of T- and B-cell function in uremia. Kidney Int Suppl. 2001(78):S-206.
17. Libby P. Inflammation in atherosclerosis. Nature. 2002;420(6917):868-874.
18. Macdougall IC, Eckardt K-U, Locatelli F. Latest US KDOQI Anaemia Guidelines update what are the implications for Europe? Nephrol Dial Transplant. 2007;22(10):2738-2742.
19. Mehdi U TR. Anemia, Diabetes, and Chronic Kidney Disease. Diabetes Care. 2009;32(7):1320-1326.
28
21. Vogtländer NPJ, Brown A, Valentijn RM, Rimmelzwaan GF, Osterhaus ADME. Impaired response rates, but satisfying protection rates to
influenza vaccination in dialysis patients. Vaccine. 2004;22(17-18):2199-2201.
22. Postma MJ, Baltussen RMPM, Heijnen MLA, de Jong - van den Berg LTW, Jager JC. Pharmacoeconomics of Influenza Vaccination in the Elderly: Reviewing the Available Evidence. Drugs Aging. 2000;17(3):217-227.
23. Saab S, Weston SR, Ly D, et al. Comparison of the cost and effectiveness of two strategies for maintaining hepatitis B immunity in hemodialysis patients. Vaccine. 2002;20(25-26):3230-3235.
24. Centers for Disease Control and Prevention. Guidelines for Vaccinating Kidney Dialysis Patients and Patients with Chronic Kidney Disease. 2006; http://www.cdc.gov/vaccines/pubs/downloads/b_dialysis_guide-508.pdf. Accessed July 27, 2010.
25. Centers for Disease Control and Prevention. Epidemiology and Prevention of Vaccine-Preventable Diseases. Atkinson W WS, Hamborsky J,
McIntyre L, ed. 11 ed. Washington DC: Public Health Foundation; 2009.
26. Brydak LB, Roszkowska-Blaim M, Machala M, Leszczynska B, Sieniawska M. Antibody response to influenza immunization in two consecutive epidemic seasons in patients with renal diseases. Vaccine. 2000;18(28):3280-3286.
27. Buti M, Viladomiu L, Jardi R, Olmos A, Rodriguez JA, Bartolome J,
Esteban R, Guardia J. Long-term immunogenicity and efficacy of hepatitis B vaccine in hemodialysis patients. Am J Nephrol. 1992;12(3):144-147.
28. Centers for Disease Control and Prevention. Prevention of pneumococcal disease: recommendations of the Advisory Committee on Immunization Practices (ACIP). MMWR. 1997;46(No. RR-8):1-24.
29
30. Nikoskelainen J, Koskela M, Forsstrom J, Kasanen A, Leinonen M. Persistence of antibodies to pneumococcal vaccine in patients with chronic renal failure. Kidney Int. 1985;28(4):672-677.
31. Gilbertson DT, Unruh M, McBean AM, Kausz AT, Snyder JJ, Collins AJ. Influenza vaccine delivery and effectiveness in end-stage renal disease. Kidney Int. 2003;63(2):738-743.
32. Barraclough K, Wiggins K, Hawley C, van Eps C, Mudge D, Johnson D, Whitby M, Carpenter S, Playford G. . Intradermal Versus Intramuscular Hepatitis B Vaccination in Hemodialysis Patients: A Prospective Open-Label Randomized Controlled Trial in Nonresponders to Primary Vaccination. Am J Kidney Dis. 2009;54(1):95-103.
33. Surquin M, Tielemans CL, Kulcsar I, et al. Rapid, enhanced, and persistent protection of patients with renal insufficiency by AS02V-adjuvanted hepatitis B vaccine. Kidney Int. 2009;77(3):247-255.
34. Halloran ME, Struchiner CJ, Longini IM. Study Designs for Evaluating Different Efficacy and Effectiveness Aspects of Vaccines. Am J Epidemiol. 1997;146(10):789-803.
35. Shrank W, Patrick A, Alan Brookhart M. Healthy User and Related Biases in Observational Studies of Preventive Interventions: A Primer for
Physicians. J Gen Intern Med. 2011;26(5):546-550.
36. Matthews KA, Kuller LH, Wing RR, Meilahn EN, Plantinga P. Prior to Use of Estrogen Replacement Therapy, Are Users Healthier than Nonusers? Am J Epidemiol. 1996;143(10):971-978.
37. Brookhart MA, Patrick AR, Dormuth C, et al. Adherence to Lipid-lowering Therapy and the Use of Preventive Health Services: An Investigation of the Healthy User Effect. Am J Epidemiol. 2007;166(3):348-354.
38. Ray WA, Daugherty JR, Griffin MR. Lipid-lowering agents and the risk of hip fracture in a Medicaid population. Inj Prev. 2002;8(4):276-279.
30
40. Jackson LA, Jackson ML, Nelson JC, Neuzil KM, Weiss NS. Evidence of bias in estimates of influenza vaccine effectiveness in seniors. Int J Epidemiol. 2006;35(2):337-344.
41. Jackson ML, Nelson JC, Weiss NS, Neuzil KM, Barlow W, Jackson LA. Influenza vaccination and risk of community-acquired pneumonia in immunocompetent elderly people: a population-based, nested case-control study. Lancet. 2008;372(9636):398-405.
42. Simonsen L, Clarke MJ, Williamson GD, Stroup DF, Arden NH, Schonberger LB. The impact of influenza epidemics on mortality:
introducing a severity index. Am J Public Health. 1997;87(12):1944-1950.
43. Simonsen L, Taylor RJ, Viboud C, Miller MA, Jackson LA. Mortality
benefits of influenza vaccination in elderly people: an ongoing controversy. Lancet Infect Dis. 2007;7(10):658-666.
44. Campitelli MA, Rosella LC, Stukel TA, Kwong JC. Influenza vaccination and all-cause mortality in community-dwelling elderly in Ontario, Canada, a cohort study. Vaccine. 2010;29:240-246.
45. Armstrong BG. Effect of influenza vaccination on excess deaths occurring during periods of high circulation of influenza: cohort study in elderly people. BMJ. 2004;329(7467):660-660.
46. Ohmit S, Monto A. Influenza Vaccine Effectiveness in Preventing Hospitalization among the Elderly during Influenza Type A and Type B Seasons. Int J Epidemiol. 1995;24(6):1240-1248.
47. Puig-Barberà J, Márquez-Calderón S, Masoliver-Fores A, et al. Reduction in hospital admissions for pneumonia in non-institutionalised elderly people as a result of influenza vaccination: a case-control study in Spain. J Epidemiol Community Health. 1997;51(5):526-530.
48. Nichol KL, Baken L, Nelson A. Relation between influenza vaccination and outpatient visits, hospitalization, and mortality in elderly persons with chronic lung disease. Ann Intern Med. 1999;130(5):397-403.
31
Minnesota, New York, and Oregon: Data. J Infect Dis. 2001;184(6):665-670.
50. Jefferson T, Rivetti D, Rivetti A, Rudin M, Di Pietrantonj C, Demicheli V. Efficacy and effectiveness of influenza vaccines in elderly people: a systematic review. Lancet. 2005;366(9492):1165-1174.
51. Voordouw BCG, van der Linden PD, Simonian S, van der Lei J,
Sturkenboom MCJM, Stricker BHC. Influenza Vaccination in Community-Dwelling Elderly: Impact on Mortality and Influenza-Associated Morbidity. Arch Intern Med. 2003;163(9):1089-1094.
52. Nichol KL, Nordin J, Mullooly J, Lask R, Fillbrandt K, Iwane M. Influenza Vaccination and Reduction in Hospitalizations for Cardiac Disease and Stroke among the Elderly. N Engl J Med. 2003;348(14):1322-1332.
53. Simonsen L, Viboud C, Taylor RJ, Miller MA, Jackson L. Influenza vaccination and mortality benefits: New insights, new opportunities. Vaccine. 2009;27(45):6300-6304.
54. Nichol KL, Nordin JD, Nelson DB, Mullooly JP, Hak E. Effectiveness of Influenza Vaccine in the Community-Dwelling Elderly. N Engl J Med. 2007;357(14):1373-1381.
55. Hak E, Buskens E, van Essen GA, et al. Clinical Effectiveness of Influenza Vaccination in Persons Younger Than 65 Years With High-Risk Medical Conditions: The PRISMA Study. Arch Intern Med. 2005;165(3):274-280.
56. Jackson ML, Weiss NS, Nelson JC, Jackson LA. To Rule Out
Confounding, Observational Studies of Influenza Vaccine Need to Include Analyses During the "Preinfluenza Period". Arch Intern Med.
2007;167(14):1553-1554.
57. Nelson JC, Jackson ML, Weiss NS, Jackson LA. New strategies are needed to improve the accuracy of influenza vaccine effectiveness estimates among seniors. J Clin Epidemiol. 2009;62(7):687-694.
32
Performed Using the United Kingdom General Practice Research Database. J Infect Dis. 2004;190(1):1-10.
59. Fireman B, Lee J, Lewis N, Bembom O, van der Laan M, Baxter R. Influenza Vaccination and Mortality: Differentiating Vaccine Effects From Bias. Am J Epidemiol. 2009;170(5):650-656.
60. Fedson DS, Wajda A, Nicol JP, Hammond GW, Kaiser DL, Roos LL. Clinical Effectiveness of Influenza Vaccination in Manitoba. JAMA. 1993;270(16):1956-1961.
III. STATEMENT OF SPECIFIC AIMS
Specific Aim One
Aim: Assessing influenza vaccine effectiveness among patients on
hemodialysis by comparing vaccinated patients in a “high-match” year to
vaccinated patients in a “low-match” year.
Hypothesis: Patients undergoing hemodialysis who receive the influenza
vaccine in a high-match year will have a lower hazard of influenza-like illness and
hospitalization due to influenza/pneumonia and a lower hazard of all-cause death
than patients who receive the influenza vaccine in a low–match year, in seasons
with comparable severity.
Rationale: We expect that there will be large differences in health status
between patients who are vaccinated and those who are not. Therefore,
comparing vaccinated with unvaccinated people may lead to a biased estimate of
vaccine effectiveness. Thus, comparing only those who are vaccinated in
different seasons with similar severity should reduce the healthy-user selection
bias and allow for a better estimate of vaccine effectiveness.
Specific Aim Two
Aim: Assessing the relation of time-fixed and time-varying predictors, such as
hospitalization and skilled nursing care, with the receipt of influenza vaccine to
34
Hypothesis: Patients undergoing hemodialysis and who have been recently
hospitalized or received skilled nursing care are less likely to be vaccinated.
Vaccinated patients are more likely to be healthier, younger, more adherent to
their dialysis schedule, and more likely to take other preventive medications than
those who are not vaccinated.
Rationale: Patients on hemodialysis who are hospitalized are likely to be
sicker than those who have not been hospitalized, and physicians may be less
likely to vaccinate if a patient has serious health problems. In the elderly
population, it has been shown that those who are healthier are more likely to be
vaccinated. It is not known whether this association will also be observed in the
population undergoing hemodialysis. Because these patients have frequent
contact (2–3 times per week) with health care facilities, it would be expected that
they would have higher vaccination rates than the general elderly population.
Knowledge of current vaccination patterns can also inform the development of
healthcare quality improvement interventions designed to increase the utilization
of preventive healthcare services.
Specific Aim Three
Aim: Assessing influenza vaccine effectiveness on mortality among patients
on hemodialysis by developing a marginal-structural model to account for
time-varying confounding by health status.
Hypothesis: It is anticipated that unadjusted analyses will attribute an
35
measures of health status such as hospitalizations are adjusted for, we
hypothesize that attenuated estimates of vaccine effectiveness will result.
Rationale: Vaccination status is a time-varying exposure, and any variable
that vaccination affects and is also a confounder of subsequent vaccination and
death cannot be modeled using traditional regression. This is because the
time-varying confounders – such as hospitalization and skilled nursing care – are also
intermediate variables, and adjustment for these variables using regression will
produce a biased estimate. Marginal structural models use
inverse-probability-of-treatment weights to create a pseudo-population where vaccination and death
are unconfounded by time- varying confounders. Under certain assumptions,
IV. METHODS
Subject Identification A.
Study Population
This study utilizes data on hemodialysis patients from the USRDS. The
USRDS is a population-based, national system that collects information on all
patients with ESRD in the United States. All persons that are diagnosed with
ESRD and started on dialysis therapy are entered into the USRDS. The
diagnosing physician is required to complete the End Stage Renal Disease
Medical Evidence Report (CMS-2728), regardless of the insurance status of the
patient. Basic information such as demographics, cause of kidney failure, and
categories of comorbidity are included on this form. Although all patients with
ESRD are eligible for Medicare coverage regardless of their age, some patients
remain on private or HMO insurance or have a combination of insurance
coverage. More detailed information such as physician services,
hospitalizations, and cause of death is captured through administrative claims
submitted through Medicare. Non-hospitalization-related claims, including routine
dialysis care and medication use (including vaccinations) are generally submitted
on a monthly basis. Vaccinations are identified using Current Procedural
Terminology (CPT) and Health Care Financing Administration Common
37
is collected only for those patients who are enrolled in Medicare as a primary
payer, and those that are not enrolled in Medicare can be considered as missing
data. In 2009, approximately 83% of ESRD patients were covered by Medicare
as a primary payer.1 This study will be limited to Medicare patients who have
been receiving dialysis for at least three months. This is the amount of time that
is generally required to process the Medicare eligibility and enrollment forms.
Collection of data
The USRDS collects data primarily from the Centers for Medicare and
Medicaid Services (CMS) Renal Beneficiary and Utilization System, which is
supplemented from the Renal Networks’ Standard Information Management
System.1 Claims data are sent from each ESRD network to CMS on a monthly
basis. Almost all patients diagnosed with ESRD are captured in the system, as all
providers are required to submit a Medical Evidence Report, regardless of
insurance status. Each patient is assigned a unique patient identification number
upon receipt of the form. The first service date is generally considered to be
complete for all patients, while other data fields (such as comorbidities) on the
form may not be of similar quality.
Study Setting and Design
This study incorporates a cohort study design. Eligible patients were
enrolled prior to the start of influenza season each year, and the outcome –
ILI/hospitalization/mortality status for Aim 1, vaccination for Aim 2 and death for
Aim 3 – was subsequently assessed. For Study Aims 1 and 3, each influenza
38
the time between the start of vaccine distribution (assumed to be September 1)
and the start of the influenza season. The “influenza period” was defined using
Centers for Disease Control and Prevention’s (CDC) national laboratory data on
positive influenza isolates. The start date was defined as the midpoint of the first
week with >10% of isolates submitted positive for influenza. We conducted a
sensitivity analysis where the influenza season started when >5% of isolates
were positive. The influenza season ends at distinct points, also characterized by
CDC surveillance. However, we continued to follow patients for outcomes
through August 31st of the following year. Figure 1 displays how the influenza
season was broken into periods for analysis.
Figure 1. 2001-2002 influenza season periods
Identification of cohorts
For each influenza season, a cohort of ESRD patients was identified. All
adult patients (>17 years at first date of dialysis) on continuous hemodialysis with
Medicare as their primary payer who initiated therapy prior to October 1 of the
previous year and remained alive until September 1 of the current year (i.e., start
of vaccine distribution) were eligible for that yearly cohort. Exposure was
assessed starting on September 1 of each year and follow-up ended on the
earliest date of outcome, death, transplant, or end of study (December 31 for Aim
September 1, 2001
January 12, 2002
April 27, 2002
August 31, 2002 Influenza Season
Follow-up Pre-flu period
39
2, August 31 for Aim 1 and 3). Claims from the USRDS that occurred between
1997 to 2005 were utilized. There were approximately 900,000 patient years
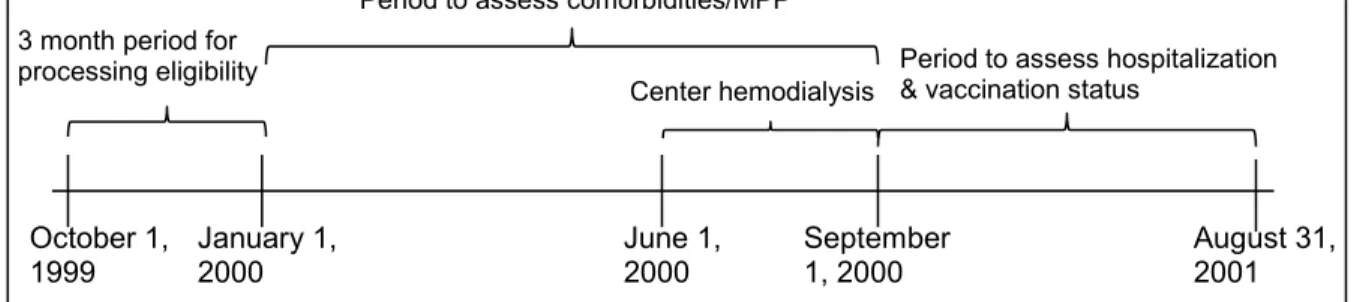
available (~100,000 patient years per year). Figure 2 depicts the time periods
used to construct the 2000–2001 influenza season annual cohort.
Table 5. Study eligibility requirements
Variable Requirement
Age 18 years and older
Insurance status Medicare as primary payer Dialysis status Continuous hemodialysis Date of ESRD Prior to October 1
Figure 2. Annual cohort for the 2000–2001 influenza season defined for Study Aim 3
Exposure and Outcome Definitions B.
Hospitalization and skilled nursing care exposures
Study Aim 2 investigates hospitalization due to any cause and skilled
nursing care as the exposures of interest. Inpatient hospitalization and skilled
nursing facility admission and discharge dates were assessed using the Part A –
Hospitalization Medicare claims. Both variables were coded as a count of the
number of hospital or skilled nursing days the patient had in the prior 30 days.
October 1,
1999 January 1, 2000 June 1, 2000 August 31, 2001
Center hemodialysis Period to assess comorbidities/MPP 3 month period for
processing eligibility
September 1, 2000