The Journal of Infectious Diseases
The Journal of Infectious Diseases® 2017;215:1132–40
Blood-Brain Barrier Disruption Is Initiated During
Primary HIV Infection and Not Rapidly Altered by
Antiretroviral Therapy
Elham Rahimy,1 Fang-Yong Li,2 Lars Hagberg,6 Dietmar Fuchs,9 Kevin Robertson,3 Dieter J. Meyerhoff,4 Henrik Zetterberg,7,8,10 Richard W. Price,5 Magnus Gisslén,6 and Serena Spudich1
1Department of Neurology and 2Yale Center for Analytical Sciences, Yale University, New Haven, Connecticut; 3Department of Neurology, University of North Carolina, Chapel Hill; 4Department of Radiology and Biomedical Imaging and 5Department of Neurology, University of California, San Francisco; 6Department of Infectious Diseases and 7Institute of Neuroscience and Physiology, Department of Psychiatry and Neurochemistry, University of Gothenburg, Gothenburg, and 8Clinical Neurochemistry Laboratory, Sahlgrenska University Hospital, Mölndal, Sweden; 9Division of Biological Chemistry, Innsbruck Medical University, Austria; and 10Department of Molecular Neuroscience, University College London Institute of Neurology, United Kingdom
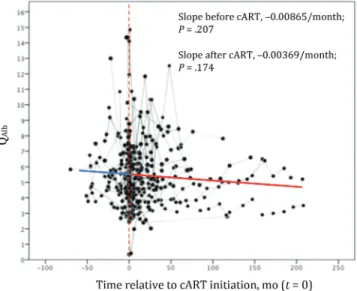
Background. We explored the establishment of abnormal blood-brain barrier (BBB) permeability and its relationship to neuro-pathogenesis during primary human immunodeficiency virus (HIV) infection by evaluating the cerebrospinal fluid (CSF) to serum albumin quotient (QAlb) in patients with primary HIV infection. We also analyzed effects of initiating combination antiretroviral therapy (cART).
Methods. The QAlb was measured in longitudinal observational studies of primary HIV infection. We analyzed trajectories of the QAlb before and after cART initiation, using mixed-effects models, and associations between the QAlb and the CSF level of neuro-filament light chain (NFL), the ratio of N-acetylaspartate to creatinine levels (a magnetic resonance spectroscopy neuronal integrity biomarker), and neuropsychological performance.
Results. The baseline age-adjusted QAlb was elevated in 106 patients with primary HIV infection (median time of measurement, 91 days after infection), compared with that in 64 controls (P = .02). Before cART initiation, the QAlb increased over time in 84 par-ticipants with a normal baseline QAlb (P = .006) and decreased in 22 with a high baseline QAlb (P = .011). The QAlb did not change after a median cART duration of 398 days, initiated at a median interval of 225 days after infection (P = .174). The QAlb correlated with the NFL level at baseline (r = 0.497 and P < .001) and longitudinally (r = 0.555 and P < .001) and with the ratio of N-acetylaspartate to creatinine levels in parietal gray matter (r = −0.352 and P < .001 at baseline and r = −0.387 and P = .008 longitudinally) but not with neuropsychological performance.
Conclusion. The QAlb rises during primary HIV infection, associates with neuronal injury, and does not significantly improve over a year of treatment. BBB-associated neuropathogenesis in HIV-infected patients may initiate during primary infection.
Keywords. HIV/AIDS; PHI; primary HIV infection; BBB; Blood brain barrier; neuropathogenesis.
Chronic exposure to human immunodeficiency virus (HIV) can lead to neurological complications, with one third of untreated individuals with advanced AIDS developing HIV-associated dementia [1, 2], a syndrome of severe cognitive, motor, and behavioral disturbances primarily associated with subcortical atrophy [3]. Although the incidence of HIV-associated demen-tia has significantly decreased with the advent of combination antiretroviral therapy (cART), a milder spectrum of neurocog-nitive deficits persists despite treatment [1, 2, 4]. As this per-sisting impairment may at least in part represent irreversible
alterations of central nervous system (CNS) integrity accrued before the initiation of cART, investigative efforts have been drawn toward elucidating neuropathogenesis during the early stages of HIV neuroinvasion and examining the effects of early cART on these processes.
Primary HIV infection (PHI) refers to the first phase of infection, from the time of transmission up to 12 months after transmission [5]. HIV infiltrates the CNS during PHI [6–8], as indicated by the presence of HIV RNA in the cerebrospinal fluid (CSF) compartment, even in the absence of neurological symptoms [1, 8–11]. CNS immune activation accompanies this viral invasion, as reflected by elevations in the CSF white blood cell count and the soluble CSF biomarkers neopterin (reflecting macrophage activation) and CXCL-10/IP-10 (a lym-phocyte chemokine) and by T-lymlym-phocyte activation in CSF [1, 12–15]. Furthermore, markers of immune activation may reflect the degree of viral load and neurocognitive impairment [16]. Magnetic resonance spectroscopy (MRS), a noninvasive quantitative MR technique that measures alterations in cerebral
M A J O R A R T I C L E
© The Author 2017. Published by Oxford University Press for the Infectious Diseases Society of America. All rights reserved. For permissions, e-mail: [email protected]. DOI: 10.1093/infdis/jix013
Received 17 September 2016; editorial decision 2 January 2017; accepted 13 March 2017; published online March 29, 2017.
Presented in part: Conference on Retroviruses and Opportunistic Infections Annual Meeting, Seattle Washington, February 2015.
metabolite levels, demonstrates that inflammatory cerebral metabolites are elevated in acute HIV infection (ie, the period before antibody seroconversion) and longitudinally increased over time in PHI before cART initiation [1, 17, 18]. Thus, cru-cial processes during the primary phase of viral infection may underlie the initiation of HIV-associated CNS injury.
It is speculated that increased blood-brain barrier (BBB) per-meability is a critical contributor to HIV neuropathogenesis because disruption of this regulatory interface facilitates CNS infiltration of potentially harmful substances from the periph-ery, resulting in compounding viral entry and susceptibility to the inflammatory assault of immune cells [19, 20]. To exert its neurological effects, HIV-1 and/or its viral products must first traverse the BBB. Although data suggest that, at this initial stage, HIV is transported to the CNS via trafficking of infected immune cells across a largely intact BBB, increased permeability of the BBB has been implicated in the progression of HIV neu-rological dysfunction [19, 21–24]. The ratio of the albumin level in the CSF to that in serum (also known as the CSF to serum albumin concentration quotient [QAlb]) is the best established fluid marker for BBB permeability [25]. Albumin is synthesized exclusively in the liver and is largely excluded from the CSF. Upon deregulation of the neurovascular unit and sequential loss of tight junctions, BBB permeability to albumin increases, resulting in an increased QAlb.
In this study, we aimed to elucidate the natural history of BBB permeability during PHI and to determine whether changes in permeability, if present, were associated with biomarkers of neuropathogenesis. Additionally, we sought to determine whether BBB permeability was responsive to cART initiated during PHI. These results provide novel understanding of the changes to the brain microenvironment that begin during ini-tial HIV infection and the persistence of these alterations in the setting of early, virologically suppressive cART.
MATERIALS AND METHODS
Study Design
Individuals with PHI were recruited into prospective longi-tudinal studies of CNS HIV in Gothenburg, Sweden, and San Francisco, California, between 1986 and 2014, as previously described [9]. Participants were enrolled within the first year after HIV transmission, as confirmed by the standard serologic testing algorithm for recent HIV seroconversion (STAHRS) [26], and all but 3 were ART naive. A subset began cART at variable times during follow-up for reasons outside of the study. None of the participants had a prior neurological disease his-tory. A history of substance abuse was not an exclusion crite-rion, but no participants reported same-day substance abuse, which would have led to censoring of data. The date of HIV transmission was approximated as 14 days before the onset of seroconversion symptoms, when present [27]; otherwise, it was
approximated as midway between the dates of the last negative and first positive result of an enzyme immunoassay [28]. HIV-uninfected volunteers were recruited from the San Francisco community and had no history of neurological conditions or active systemic diseases.
Ethics
The study protocol was approved by the institutional review board of each institution involved. All study participants gave written consent.
Data Collection and Laboratory Analysis
CSF and blood specimens were obtained and neuropsycholog-ical testing and MRS were performed at each visit as previously described [23, 29]. Study visits were scheduled at baseline, 6 weeks, and every 6 months thereafter, although there was par-ticipant variation in the timing and duration of follow-up.
CSF neurofilament light chain (NFL) levels were measured with the NF-light enzyme-linked immunosorbent assay kit (UmanDiagnostics, Umeå, Sweden), a sensitive immunoassay [21], with reference values for the upper limit of normal (ULN) of 380 ng/L (for individuals aged 18–29 years), 560 ng/L (for those aged 30–39 years), 890 ng/L (for those aged 40–59 years), and 1850 ng/L (for those aged >59 years) [21]. CSF and plasma albumin levels were measured by nephelometry (Behring Nephelometer Analyzer; Behringwerke, Marburg, Germany). QAlb was calculated as the ratio of the CSF level of albumin, in milligrams/liter, to the plasma level of albumin, in grams/liter [22]. Upper limits of normal were based on previously established values of <6.8 for ages <45 years and <10.2 for ages >45 years [30]. CSF WBCs, lymphocytes, total protein, and HIV RNA were mea-sured as previously described [9]. Viral loads of <50 copies/mL were assigned a value of 49 copies/mL (1.69 on log10 scale).
Neuropsychological performance was determined through the appraisal of gross and fine motor skills, processing speed, executive function, learning, and verbal memory, using a bat-tery of 11 tests. Performance was summarized as an aggregate total z score and a brief NPZ-4 score (including grooved peg-board, digit symbol, finger tapping, and timed gait).
Statistical Analysis
Baseline characteristics were summarized as frequencies for categorical variables and median values and interquartile ranges for continuous variables. Nonparametric, χ2, and Fisher
exact tests were used for group comparisons. The mixed-ef-fects model was used to analyze longitudinal change of QAlb after transmission. This model includes both fixed and ran-dom effects in the same analysis, allowing for variation in the number and interval of participant follow-up visits. Baseline age was included as a fixed-effect covariate in the model. To account for a possible nonlinear trajectory of QAlb over time, a quadratic term (t2) was included as a fixed-effect covariate.
The model included a personal intercept for each participant as a random effect, allowing the baseline QAlb to vary for each participant. As log-transformed results were comparable to non–log-transformed analysis, the latter results are reported. The plot of fitted group mean QAlb trend was superposed on observed individual data. Between-subject and within-sub-ject correlation were evaluated using the Bland and Altman method [31, 32].
Statistical analyses were performed using the SPSS 23.0 sta-tistical package (IBM, Armonk, NY). The significance level was set as a P value of < .05 (2 sided).
RESULTS
Study Participant Characteristics
A total of 106 participants with PHI fulfilled the inclusion criteria and had available QAlb values. Nine participants
experienced clinically overt neurological disorders during seroconversion: there were 2 cases of meningitis, 5 of head-ache with photophobia, 2 of brachial neuritis, and 1 each of Guillain-Barre syndrome, facial palsy, and encephalitis. Total visits ranged from 1 to 13, with a median of 2, and the max-imum follow-up duration was 3572 days, with a median of 50 days. The majority of participants were infected with HIV subtype B [9].
The baseline characteristics of participants with PHI and uninfected controls are presented in Table 1. The median dura-tion of HIV infecdura-tion in participants with PHI was 91 days; the plasma viral load during PHI was 1.8 log10 greater relative to that in the CSF compartment. As compared to the HIV-uninfected participants, the PHI cohort had a higher percent-age of males and was younger. As expected, participants with PHI had a lower CD4+ T-cell count, an elevated CD8+ T-cell
count, and a decreased ratio of CD4+ T cells to CD8+ T cells.
As previously reported, CSF white blood cell counts were ele-vated in the PHI group, as well as CSF levels of neopterin, a marker of macrophage activation. Despite the younger age, participants with PHI had levels of NFL and equivalent CSF total protein—2 parameters that increase in level with normal aging—that were greater than those for the uninfected group, [21, 33, 34].
BBB Permeability at Baseline
At baseline, the mean age-adjusted QAlb was elevated in the PHI cohort (5.9; 95% confidence interval [CI], 5.5–6.3) as
Table 1. Baseline Demographic and Clinical Characteristics of Study Participants, by Human Immunodeficiency Virus (HIV) Status
Characteristic
Primary HIV Infection (n = 106)
No HIV Infection
(n = 64) P
Male sex, % (no.) 94 (100) 82 (52) .001
Age, y 36 (29–46) 43 (34–50) .003
Study site
San Francisco, CA 82 64
Gothenburg, Sweden 24 0
Time after HIV transmission, d 91 (53–149) …
CD4+ T-cell count, cells/μL 567 (402–709) 808 (678–1009) <.001
CD8+ T-cell count, cells/μL 954 (714–1358) 487 (343–733) <.001
CD4+ to CD8+ T-cell ratio 0.528 (0.391–0.791) 1.76 (1.32–2.18) <.001
HIV RNA load, log10 copies/mL
In plasma, log10 copies/mL 4.69 (4.08–5.34) …
In CSF, log10 copies/mL 2.83 (2.14–3.51) …
Plasma to CSF ratio 1.81 (1.33–2.28) …
CSF WBC count, cells/mm3 6 (2–11) 2 (0–3) <.001
CSF total protein level, mg/dL 41 (31–51) 41 (31–54) .611
NFL level, pg/mL 518 (391–819) 411 (320–550) <.001
CSF neopterin level, nmol/L 9.6 (6.8–20.4) 5.0 (4.1–6.8) <.001
Neurosymptomatic ARS, % (no.) 8.5 (9) …
Study visits, no. 2 (1–3) …
Follow-up duration, d 50 (0–450) …
Data are median value (interquartile range), unless otherwise indicated.
compared to that for controls (5.0; 95% CI, 4.4–5.6; P = .02). On the basis of previously published reference values [30], the baseline QAlb was above the age-specific ULN in 22 participants with PHI (21%), hereafter referred to as the “high baseline QAlb subgroup.” The remaining 84 participants with PHI with base-line QAlb values below the ULN are referred to hereafter as the “normal baseline QAlb subgroup.” The baseline clinical charac-teristics of these 2 subgroups are summarized in Table 2. Four of seventeen participants (24%) in the high baseline QAlb sub-group had neurosymptomatic seroconversion, compared with 8 of 64 (13%) in the normal baseline QAlb subgroup, although the difference was statistically insignificant. An elevated NFL level, CSF total protein level, CSF neopterin (but not blood neopterin) level, and CD8+ T-cell count and a decreased ratio
of plasma to CSF levels of HIV RNA were found in the high baseline QAlb subgroup as compared to the normal baseline QAlb subgroup.
Longitudinal BBB Permeability in PHI Before cART Initiation
The individual QAlb trajectories for all participants in the PHI group over the duration of the study before cART initiation are plotted in Figure 1. A mixed-model analysis to evaluate the natural history of BBB integrity in the overall PHI group before cART initiation did not reveal a significant change in QAlb over time (–0.000436/day; P = .092). Figure 2 compares
the trajectories of the high and normal baseline QAlb groups. The high baseline QAlb subgroup showed a declining trend (–0.00305/day; P = .011), while the QAlb in the normal base-line QAlb subgroup initially increased (0.00144/day; P = .006)
Table 2. Baseline Clinical Characteristics of Participants With Primary Human Immunodeficiency Virus (HIV) Infection, by Baseline Cerebrospinal Fluid (CSF) to Serum Albumin Concentration Quotient (QAlb) Subgroup
Characteristic
High Baseline QAlb
(n = 22)
Normal Baseline QAlb
(n = 84) Pa
Age, y 36 (29–45) 37 (28–46) .797
Time after HIV transmission, d 85 (60–125) 92 (51–150) .785
CD4+ T-cell count, cells/μL 596 (484–681) 550 (389–730) .469
CD8+ T-cell count, cells/μL 1294 (792–1620) 915 (706–1200) .023
CD4+ to CD8+ T-cell ratio 0.463 (0.321–0.791) 0.530 (0.391–0.803) .376
HIV RNA load, log10 copies/mL
In plasma, log10 copies/mL 4.60 (3.91–5.39) 4.69 (4.09–5.32) .629
In CSF, log10 copies/mL 3.23 (1.77–3.87) 2.73 (2.14–3.43) .340
Plasma to CSF ratio 1.27 (0.464–2.16) 1.84 (1.50–2.29) .020
CSF WBC count, cells/mm3 7 (4–13) 5 (2–11) .087
CSF total protein level, mg/dL 59 (52–74) 37 (28–42) <.001
NFL level, pg/mL 857 (468–1474) 498 (360–729) .008
Neopterin level, nmol/L
In blood 18.0 (10.8–28.9) 14 (9.4–21.3) .183
In CSF 14.3 (8.4–32.0) 9.0 (6.5–17.4) .035
Baseline QAlb 9.18 (7.5–11.3) 4.66 (3.57–5.75) <.001
Neurosymptomatic ARS, % (no.) 24 (4) 13 (8) .169b
Study visits, no. 2 (1–3) 2 (1–3) .617
Follow-up duration, d 48 (0–398) 51 (0–455) .715
Data are median value (interquartile range), unless otherwise indicated.
Abbreviations: ARS, acute retroviral syndrome; CSF, cerebrospinal fluid; NFL, neurofilament light chain; WBC, white blood cell. aValues <.05 were considered statistically significant.
bComparison involved 17 participants in the high baseline Q
Alb subgroup and 64 in the normal baseline QAlb subgroup and was performed using the Fisher exact test.
and reached a plateau quickly (quadratic time effect P = .004). These results indicated the heterogeneous time effect in the 2 subgroups.
Correlation of BBB Integrity With Markers of Neuropathogenesis
To further evaluate the implications of elevated QAlb, correla-tions between QAlb and markers of neuronal health were evalu-ated in pre-cART study intervals (Figure 3). Partial correlation coefficients were calculated to correct for the confounding effects of age, as the QAlb and NFL level both directly correlate with age. The QAlb demonstrated a strong positive correlation with the NFL level, a marker of active neuronal injury, upon cross-sectional analysis at baseline (r = 0.497; P < .001) and longitudinally, with both between-participant (r = 0.555;
P < .001) and within-participant (r = 0.523; P = .001) analysis. QAlb inversely correlated with NAA:Cr, a cerebral metabolite biomarker of neuronal health, upon cross-sectional analy-sis at baseline (r = –0.352; P = .015) and longitudinally, with between-participant analysis (r = –0.387; P = .008) but not within-participant analysis (r = 0.218; P = .125). MRS was per-formed at a median interval of 114 days after infection. QAlb did not correlate with composite z scores (total z or NPZ4) of neuropsychological testing at baseline or in longitudinal anal-ysis (data not shown).
Characteristics of cART Recipients
Fifty-eight participants with PHI initiated a cART regimen during study follow-up, although 1 participant was excluded because of virologic failure (defined as 2 consecutive plasma samples with an HIV RNA load of >50 copies/mL after 6 months of ART). Treatment regimens were heterogeneous,
consisting of 10 integrase-based, 25 protease-based, and 22 nonnucleoside reverse transcriptase inhibitor–based regimens with 19 distinct combinations. cART was initiated at a median interval of 225 days after infection, with a median duration of follow-up during cART of 402 days. Table 3 compares the cross-sectional laboratory parameters before (ie, during the last visit before treatment initiation) and after (ie, during the last visit of the study) cART initiation in those who initi-ated cART. There was improvement in most parameters after approximately a year of cART, with suppression of plasma and CSF HIV RNA levels to the lower limit of detection by polymerase chain reaction (P < .001), increased CD4+ T-cell
counts (P < .001), decreased WBC counts (P < .001), and decreased blood and CSF neopterin levels (P < .001). In this comparison, the NFL level and albumin ratio did not signifi-cantly change with cART (640 vs 670 ng/L [P = .911] and 5.18 vs 5.09 [P = .851], respectively).
Longitudinal History of BBB Integrity Following cART Initiation
A mixed-model analysis was performed to assess the longi-tudinal trajectory of QAlb over 13 months of cART (Figure 4). Three participants were recruited into the cohort after already having initiated cART (for 29, 27, and 19 days) and thus were included in the linear mixed model (n = 60) but are excluded from the group described in Table 3. As cART was initiated at a median interval of 225 days after infection (t = 0 in Figure 4), this time point corresponded with the linear portion shown in Figure 2, in which the quadratic changes of the normal baseline subgroup are resolving and reaching a set point. Thus, the initial analysis was performed with the total group of cART recipients,
rather than separating cART recipients into the high and nor-mal baseline QAlb subgroups. There was no significant change detected in QAlb over the median duration (ie, >1 year) of cART (slope, −0.00369/month; P = .174). With group stratification, the high baseline QAlb subgroup (n = 7) demonstrated no significant change in QAlb over time (P = .783). The low baseline subgroup (n = 53) demonstrated a slope of effectively 0 (slope, 0.00008/ month; P = .004), similar to the pre-cART plateau.
DISCUSSION
In this study, we analyzed the natural history of BBB perme-ability and the influence of early cART during primary HIV infection. We show that albumin ratio is mildly elevated in par-ticipants with PHI, compared with that for uninfected controls, when correcting for age. This correction is relevant given that BBB permeability increases with normal aging [35] and may explain why previous studies have not reported abnormalities in BBB permeability during PHI when compared to controls,
given that most studies of PHI enroll young patients. That being said, we have previously identified moderate elevation of the albumin ratio during PHI [9, 36] and in participants with chronic HIV infection who are cART naive and neuroasymp-tomatic [9]. Similarly, Li et al have reported a strong associa-tion between matrix metalloproteinases—enzymatic surrogate markers of BBB permeability—and neurocognitive status in PHI [37].
The novelty of this study is our finding that BBB perme-ability undergoes dynamic changes during PHI, even within days of transmission. Two distinct trajectories were noted for the PHI cohort when analysis was stratified by baseline albu-min ratio. Those with a normal baseline albualbu-min ratio (ie, a ratio below the ULN) showed a mild initial increase that pla-teaued within the first 1000 days of infection. Despite the ini-tial rise, the QAlb remained well below the ULN. As will be discussed below, it may be that there is an element of subclin-ical injury associated with this mild rise. The subgroup with a
high baseline albumin ratio demonstrated a marked decline in the albumin ratio within the first 1000 days of infection. Presumably an early rise in albumin ratio occurred immedi-ately following infection, before participant recruitment, and began to resolve during the follow up. Notably, the subgroup with a higher baseline albumin ratio was characterized by a higher percentage of neurosymptomatic seroconversion, ele-vated levels of CSF markers of axonal injury and immune acti-vation, and a higher ratio of CSF to plasma levels of HIV RNA. These findings suggest that a subgroup of participants with PHI is susceptible to marked BBB disruption, which persists even beyond 1000 days after infection, and is associated with signs of increased CNS involvement. Factors that predispose individuals to one trajectory versus the other warrant further investigation.
Previous studies have expounded on the association of the albumin ratio with biomarkers of CNS inflammation and injury [20]. We confirm that, during PHI, the albumin ratio correlates strongly with the level of the axonal injury
marker, NFL [23], and are the first to demonstrate that it inversely correlates with the metabolic marker of neuronal health, NAA:Cr. NFL is a sensitive marker of active neuronal damage, and its levels correlate with the severity of this dam-age [38–40]. We have previously shown NFL to be the most sensitive neuronal biomarker for assessing HIV neurodegen-eration, as it can detect subclinical injury in neuroasymp-tomatic individuals, even during PHI [36, 41]. As disease progresses, it is also associated with overt clinical neurolog-ical disease, thus reflecting not only structural changes, but also functional changes [38]. Although NFL is not specific for HIV neurodegeneration [36, 39], comorbid neurologi-cal conditions were excluded from the study onset. Similar to QAlb, the NFL level was elevated during PHI, although it was below the ULN (<560 ng/L), possibly indicating subclin-ical damage, which may explain the lack of correlation with NPZ-4 test results. In line with this conclusion, we have pre-viously shown a lack of correlation between NFL levels and NPZ-4 results during PHI, despite showing moderate eleva-tions when compared to findings for uninfected controls [23, 36]. Similar to the utility of the NFL level as a biomarker of early subclinical injury, MRS has been shown to detect early HIV-associated neuropathogenesis before detection of conventional MRI changes [42]. In a recent study, subjects with chronic HIV infection who have cognitive deficits were shown to have reduced glutamate and NAA levels in several brain regions, most pronounced in the parietal gray matter [43]. Here, we extend that finding to PHI.
Once we demonstrated that BBB permeability was altered in PHI and associated with markers of neuronal pathology, we
Table 3. Characteristics of Participants with Primary Human Immunodeficiency Virus (HIV) Infection Before and After Initiating Combination Antiretroviral Therapy (cART)
Characteristic Before Initiation (n = 57)
After Initiation (n = 57) Pa
Age, y 41 (29–46) …
Time after HIV
transmission, d 225 (96–760) … Time before ART
initiation, d 19 (3–85) …
Follow-up visits, no. … 2 (1–6) cART duration, d … 402 (192–1060) CD4+ T-cell count,
cells/μL 431 (282–588) 643 (483–787) <.001 HIV RNA load, log10 copies/mL
In plasma, log10 4.9 (4.4–5.3) 1.69 (1.69–1.69) <.001
In CSF, log10 3.4 (2.6–4.0) 1.69 (1.69–1.69) <.001
Plasma to CSF
ratio 1.49 (0.71–2.08) 0.00 (0.00–0.20) <.001 CSF WBC count,
cells/mm3 4 (6–14) 2 (1–3) <.001
CSF total protein level, mg/dL
40 (33–50) 35 (29–42) .001b
NFL level, pg/mL 640 (515–965) 670 (453–1072) .911c
QAlb 5.18 (3.92–6.40) 5.09 (3.87–6.21) .832
Neopterin level, nmol/L
In blood 18.4 (8.4–24.9) 7.6 (5.2–12.9) <.001 In CSF 13.9 (7.8–21.6) 5.2 (4.7–7.7) <.001
Data are median value (interquartile range). Data before cART initiation were obtained during the last visit before treatment initiation, and data after cART initiation were obtained during the last visit of the study.
Abbreviations: CSF, cerebrospinal fluid; NFL, neurofilament light chain; QAlb, cerebrospinal fluid to serum albumin concentration quotient; WBC, white blood cell.
aGroup comparisons were performed using nonparametric analysis for related samples. Values <.05 were considered statistically significant.
bComparison is for 21 paired values.
cComparison is for 42 paired values.
assessed whether early cART could remediate these changes. Surprisingly, the effect of cART on BBB permeability has not been intensely evaluated. In an unpublished study, Crozier et al observed the gradual diminishment of the median albumin ratio (from 6.48 to 6.09) in 16 neuroasymptomatic participants with chronic HIV infection after 200 days of cART [44]; thus, although BBB integrity improved over time with cART, a return to baseline or near baseline function may take years. In contrast, Abdulle et al reported no significant reduction in BBB perme-ability after 2 years of cART in 38 neuroasymptomatic partic-ipants [45]. Importantly, the median baseline albumin ratio among participants in the study by Crozier et al was greater than that of participants in the study by Abdulle et al (6.48 vs 4.45), potentially contributing to the discrepancy in the cohort response to cART.
In our study, cART, initiated at a median interval of 225 days after infection, was effective in suppressing CSF and plasma HIV RNA, suggesting medication compliance and effective-ness. Notably, the inflammatory marker neopterin improved to the upper level of normal limits both in the plasma and CSF. Despite this systemic (including CNS) suppression of viral rep-lication and inflammation, the NFL level and albumin ratio were unchanged. The pre-cART measurement of the albumin ratio was comparable to that of the age-matched uninfected controls and thus may indicate that the acute changes of the albumin ratio in the high baseline QAlb subgroup had largely resolved and reached a level near baseline once cART was ini-tiated at a median interval of 225 days after infection. On the other hand, although the NFL level was below the age-specific ULN (<840 pg/mL), it was significantly elevated as compared to that for uninfected controls and the baseline PHI cohort, given only a marginal age difference. There is a gradual normalization of the NFL level following axonal injury, which is unlikely to persist for over a year [46]. Thus, this persistently elevated level of NFL may reflect continued subclinical injury despite cART and what appears to be a largely normal albumin ratio.
We hypothesize that perhaps (1) the initially altered BBB per-meability initiated CNS injury, which persists despite resolution of BBB integrity; (2) the mechanism of injury is independent of BBB integrity; or (3) BBB permeability is mildly elevated and has not fully returned to baseline, resulting in persisting neuro-nal injury. Alternatively, it is possible that, despite the large sam-ple size, we still have insufficient power to detect a significant change in the NFL level and QAlb after cART initiation. Further studies are necessary to elucidate the possible explanation. Notably, a previous study showed normalization of the ratio of CD4+ to CD8+ T cells during PHI only when cART was
initi-ated within 6 months after transmission [47]. Furthermore, in a cohort of individuals who started treatment during acute HIV infection, the CSF NFL level was not elevated at baseline nor after 6 and 24 months of cART [48]. The effects of earlier cART
intervention on normalization of the albumin ratio should be investigated.
This study has several limitations. QAlb is affected by many factors not accounted for in this study, including body weight and smoking [35]. Although cholesterol and other cardio-vascular risk factors were not routinely screened, none of the participants had a known history of clinically apparent cardio-vascular disease, such as coronary artery disease, peripheral vascular disease, or stroke. One participant, in the low baseline group, had a known diagnosis of diabetes mellitus type 2. Abuse of substances such as cocaine has been shown to at least tran-siently increase BBB permeability [49]; thus, misreporting of ongoing drug use or long-term effects of previous drug use can-not be discounted as confounding factors. Furthermore, given the observational nature of this study, cART regimens were het-erogeneous, which may result in distinct effects on the BBB.
BBB permeability undergoes a dynamic process during PHI, demonstrating acute changes within days. We identified 2 sub-groups of participants with PHI with different albumin ratio trajectories: one with a presumed acute increase and gradual improvement over the course of infection and a second with a mild initial increase. BBB permeability correlated with mark-ers of neuropathogenesis. Initiation of cART in the first year of infection did not significantly alter BBB permeability in our study. Further investigations should test the effects of earlier cART initiation, especially in individuals with signs of early BBB disruption.
Notes
Acknowledgments. We thank the study volunteers and the staff at the
collaborating institutions.
Financial support. This work was supported by the National Institutes
of Health (grants R01 MH081772, K23 MH074466, P01 AI071713, and M01 RR0008336) and the Yale School of Medicine (summer research fellowship).
Potential conflicts of interest. All authors: No reported conflicts.
All authors have submitted the ICMJE Form for Disclosure of Potential Conflicts of Interest. Conflicts that the editors consider relevant to the con-tent of the manuscript have been disclosed.
References
1. Valcour V, Chalermchai T, Sailasuta N, et al.; RV254/SEARCH 010 Study Group. Central nervous system viral invasion and inflammation during acute HIV infec-tion. J Infect Dis 2012; 206:275–82.
2. Saylor D, Dickens AM, Sacktor N, et al. HIV-associated neurocognitive disorder— pathogenesis and prospects for treatment. Nat Rev Neurol 2016; 12:309. 3. Dal Pan GJ, McArthur JH, Aylward E, et al. Patterns of cerebral atrophy in
HIV-1-infected individuals: results of a quantitative MRI analysis. Neurology 1992; 42:2125–30.
4. Heaton RK, Clifford DB, Franklin DR Jr, et al.; CHARTER Group. HIV-associated neurocognitive disorders persist in the era of potent antiretroviral therapy: CHARTER study. Neurology 2010; 75:2087–96.
5. Kassutto S, Rosenberg ES. Primary HIV type 1 infection. Clin Infect Dis 2004; 38:1447–53.
7. Davis LE, Hjelle BL, Miller VE, et al. Early viral brain invasion in iatrogenic human immunodeficiency virus infection. Neurology 1992; 42:1736–9. 8. Resnick L, Berger JR, Shapshak P, Tourtellotte WW. Early penetration of the
blood-brain-barrier by HIV. Neurology 1988; 38:9–14.
9. Spudich S, Gisslen M, Hagberg L, et al. Central nervous system immune activation characterizes primary human immunodeficiency virus 1 infection even in partici-pants with minimal cerebrospinal fluid viral burden. J Infect Dis 2011; 204:753–60. 10. Spudich S. HIV and neurocognitive dysfunction. Curr HIV/AIDS Rep 2013;
10:235–43.
11. Gallo P, Frei K, Rordorf C, Lazdins J, Tavolato B, Fontana A. Human immunodefi-ciency virus type 1 (HIV-1) infection of the central nervous system: an evaluation of cytokines in cerebrospinal fluid. J Neuroimmunol 1989; 23:109–16.
12. Suh J, Sinclair E, Peterson J, et al. Progressive increase in central nervous system immune activation in untreated primary HIV-1 infection. J Neuroinflammation
2014; 11:199.
13. Wang SX, Ho EL, Grill M, et al. Peripheral neuropathy in primary HIV infection associates with systemic and central nervous system immune activation. J Acquir Immune Defic Syndr 2014; 66:303–10.
14. Wright PW, Vaida FF, Fernández RJ, et al. Cerebral white matter integrity during primary HIV infection. AIDS 2015; 29:433–42.
15. Grauer OM, Reichelt D, Grüneberg U, et al. Neurocognitive decline in HIV patients is associated with ongoing T-cell activation in the cerebrospinal fluid. Ann Clin Transl Neurol 2015; 2:906–19.
16. Cinque P, Vago L, Mengozzi M, et al. Elevated cerebrospinal fluid levels of mono-cyte chemotactic protein-1 correlate with HIV-1 encephalitis and local viral repli-cation. AIDS 1998; 12:1327–32.
17. Young AC, Yiannoutsos CT, Hegde M, et al. Cerebral metabolite changes prior to and after antiretroviral therapy in primary HIV infection. Neurology 2014; 83:1592–600.
18. Sailasuta N, Ross W, Ananworanich J, et al.; RV254/SEARCH 010 Protocol Teams. Change in brain magnetic resonance spectroscopy after treatment during acute HIV infection. PLoS One 2012; 7:e49272.
19. Gendelman HE. The neurology of AIDS. 2nd ed. Oxford; New York: Oxford University Press, 2005.
20. Ivey NS, MacLean AG, Lackner AA. Acquired immunodeficiency syndrome and the blood-brain barrier. J Neurovirol 2009; 15:111–22.
21. Jessen Krut J, Mellberg T, Price RW, et al. Biomarker evidence of axonal injury in neuroasymptomatic HIV-1 patients. PLoS One 2014; 9:e88591.
22. Andersson LM, Hagberg L, Fuchs D, Svennerholm B, Gisslén M. Increased blood-brain barrier permeability in neuro-asymptomatic HIV-1-infected individuals– correlation with cerebrospinal fluid HIV-1 RNA and neopterin levels. J Neurovirol
2001; 7:542–7.
23. Peluso MJ, Meyerhoff DJ, Price RW, et al. Cerebrospinal fluid and neuroimaging biomarker abnormalities suggest early neurological injury in a subset of individu-als during primary HIV infection. J Infect Dis 2013; 207:1703–12.
24. Power C, Kong PA, Crawford TO, et al. Cerebral white matter changes in acquired immunodeficiency syndrome dementia: alterations of the blood-brain barrier. Ann Neurol 1993; 34:339–50.
25. Tibbling G, Link H, Ohman S. Principles of albumin and IgG analyses in neu-rological disorders. I. Establishment of reference values. Scand J Clin Lab Invest
1977; 37:385–90.
26. Zetola NM, Pilcher CD. Diagnosis and management of acute HIV infection. Infect Dis Clin North Am 2007; 21:19–48, vii.
27. Lindbäck S, Thorstensson R, Karlsson AC, et al. Diagnosis of primary HIV-1 infection and duration of follow-up after HIV exposure. Karolinska Institute Primary HIV Infection Study Group. AIDS 2000; 14:2333–9.
28. Little SJ, Frost SD, Wong JK, et al. Persistence of transmitted drug resistance among subjects with primary human immunodeficiency virus infection. J Virol
2008; 82:5510–8.
29. Gold JA, Grill M, Peterson J, et al. Longitudinal characterization of depres-sion and mood states beginning in primary HIV infection. AIDS Behav 2014; 18:1124–32.
30. Blennow K, Fredman P, Wallin A, Gottfries CG, Långström G, Svennerholm L. Protein analyses in cerebrospinal fluid. I. Influence of concentration gradients for proteins on cerebrospinal fluid/serum albumin ratio. Eur Neurol 1993; 33:126–8. 31. Bland JM, Altman DG. Calculating correlation coefficients with repeated
observa-tions: part 1–correlation within subjects. BMJ 1995; 310:446.
32. Bland JM, Altman DG. Calculating correlation coefficients with repeated observa-tions: part 2–correlation between subjects. BMJ 1995; 310:633.
33. Handbook of Neurochemistry. In: Lajtha A, ed. Chemical and cellular architec-ture. 2nd ed. Vol 1. New York: Plenum Publishing Corporation, 1982:422–6. 34. Thompson EJ. Proteins of the cerebrospinal fluid: analysis and interpretation in the
diagnosis and treatment of neurological disease. 2nd ed. San Diego, CA:Elsevier Academic Press, 2005:129.
35. Deisenhammer F, Bartos A, Egg R, et al. Routine cerebrospinal fluid (CSF) anal-ysis. European handbook of neurological management. Malden, MA: Blackwell Publishing, Inc., 2011:5–17.
36. Peterson J, Gisslen M, Zetterberg H, et al. Cerebrospinal fluid (CSF) neuronal bio-markers across the spectrum of HIV infection: hierarchy of injury and detection. PLoS One 2014; 9:e116081.
37. Li S, Wu Y, Keating SM, et al. Matrix metalloproteinase levels in early HIV infec-tion and relainfec-tion to in vivo brain status. J Neurovirol 2013; 19:452–60. 38. Mellgren A, Price RW, Hagberg L, Rosengren L, Brew BJ, Gisslén M. Antiretroviral
treatment reduces increased CSF neurofilament protein (NFL) in HIV-1 infection. Neurology 2007; 69:1536–41.
39. Scherling CS, Hall T, Berisha F, et al. Cerebrospinal fluid neurofilament concen-tration reflects disease severity in frontotemporal degeneration. Ann Neurol 2014; 75:116–26.
40. Kuhle J, Barro C, Disanto G, et al. Serum neurofilament light chain in early relaps-ing remittrelaps-ing MS is increased and correlates with CSF levels and with MRI mea-sures of disease severity. Mult Scler 2016; 22:1550–9.
41. Abdulle S, Mellgren A, Brew BJ, et al. CSF neurofilament protein (NFL)—a marker of active HIV-related neurodegeneration. J Neurol 2007; 254:1026–32. 42. Tate DF, Khedraki R, McCaffrey D, Branson D, Dewey J. The role of medical
imag-ing in definimag-ing CNS abnormalities associated with HIV-infection and opportunis-tic infections. Neurotherapeuopportunis-tics 2011; 8:103–16.
43. Ernst T, Jiang CS, Nakama H, Buchthal S, Chang L. Lower brain glutamate is associated with cognitive deficits in HIV patients: a new mechanism for HIV-associated neurocognitive disorder. J Magn Reson Imaging 2010; 32:1045–53. 44. Crozier K SM, Lee E, Price RW, Spudich S. Initiation of antiretroviral therapy
reduces cerebrospinal fluid protein levels in non-demented HIV-1 infected patients. Poster presented at American Academy of Neurology 61st Annual Meeting; 2009 April 25-May 2; Seattle, WA.
45. Abdulle S, Hagberg L, Gisslén M. Effects of antiretroviral treatment on blood-brain barrier integrity and intrathecal immunoglobulin production in neuroas-ymptomatic HIV-1-infected patients. HIV Med 2005; 6:164–9.
46. Gisslén M, Rosengren L, Hagberg L, Deeks SG, Price RW. Cerebrospinal fluid signs of neuronal damage after antiretroviral treatment interruption in HIV-1 infection. AIDS Res Ther 2005; 2:6.
47. Thornhill J, Inshaw J, Oomeer S, et al. Enhanced normalisation of CD4/CD8 ratio with early antiretroviral therapy in primary HIV infection. J Int AIDS Soc 2014; 17:19480.
48. Peluso MJ, Valcour V, Ananworanich J, et al.; RV254/SEARCH 010 and SEARCH 011 Study Teams. Absence of cerebrospinal fluid signs of neuronal injury before and after immediate antiretroviral therapy in acute HIV infection. J Infect Dis
2015; 212:1759–67.