NOVEL GOLD MONOLAYER PROTECTED CLUSTERS: SYNTHESIS, CHARACTERIZATION, SEPARATION, AND FUNCTIONALIZATION
Rebecca L. Wolfe
A dissertation submitted to the faculty of the University of North Carolina at Chapel Hill in partial fulfillment of the requirements for the degree of Doctor of Philosophy in the
Department of Chemistry (Analytical Chemistry).
Chapel Hill 2007
Approved by
Advisor: Dr. Royce W. Murray
Reader: Dr. R. Mark Wightman Reader: Dr. James W. Jorgenson Committee Member: Dr. Michel R. Gagné Committee Member: Dr. Edward T. Samulski
ABSTRACT
Rebecca L. Wolfe: Novel Gold Monolayer Protected Clusters: Synthesis, Characterization, Separation, and Functionalization
(Under the Direction of Dr. Royce W. Murray)
Chapter One is an introduction to monolayer protected clusters (MPCs) and their unique size-dependent properties. This chapter also serves as an introduction to the methods of synthesis, characterization, functionalization, and separation of MPCs that have been explored in the literature.
Chapter Two demonstrates how the Brust synthesis of thiolate-protected gold clusters has been modified to produce identifiable proportions of a hexanethiolate-protected Au225 core nanoparticle that display quantized double layer charging voltammetry consistent with a Au225 core dimension. Transmission electron microscopy (TEM) and thermogravimetric results indicate an average nanoparticle formula of Au225[(S(CH2)5CH3)]75. A simulated pulse voltammogram that accounts for the TEM nanoparticle dispersity matches reasonably well with that of the polydisperse synthetic sample containing the Au225 component. In confirmation of the size determination, an HPLC analysis using ratiometric absorbance and electrochemical detectors gives a core radius of 1.0 nm for the Au225 nanoparticle.
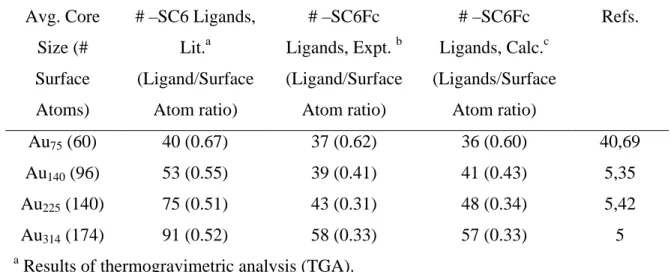
The gold nanoparticles have average core diameters of 1.4, 1.6, 2.0, and 2.2 nm with estimated average atom counts of 55, 140, 225, and 314 Au atoms and average monolayer coverages of 37, 39, 43, and 58 ferrocenated ligands, respectively. The data show unequivocally that the number of ferrocene hexanethiolate ligands bound to each core size is constrained by the steric requirements of the ferrocene head group; the ligand numbers are significantly smaller than those for hexanethiolate ligands bonded to analogoussized Au cores. Voltammetry of dilute solutions of these nanoparticles shows a large ferrocene oxidation wave and, at more negative potentials, smaller one-electron waves for the quantized double-layer charging of the Au cores. Together, the ferrocenes and core of the ferrocenated Au314 nanoparticle deliver 60 electrons at the ferrocene oxidation potential, which amounts to a very large volume charge capacity, 7 x 10⁹ C/m3, for an undiluted nanoparticle sample.
and by high concentrations of Bu4N+X− electrolyte (X− = ClO4−, PF6−) in the CH2Cl2 solvent; there is no adsorption if X− = p-toluenesulfonate or if the electrode is coated with an alkanethiolate monolayer. The electrode double layer capacity is unchanged in the presence of the ferrocenated layers, and the adsorbed nanoparticles can be gradually desorbed by scanning to potentials more negative than the electrode’s potential of zero charge. The full-width-half-maxima of the symmetrical voltammetric peaks of an adsorbed monolayer of ferrocenated nanoparticles are considerably narrower (typical 35 mV) than expected (90.6 mV, at 298 K) for a one electron transfer or for reactions of multiple, independent redox centers with identical formal potentials. The peak narrowing is explicable by a surface activity effect involving large, attractive lateral interactions between nanoparticles and by a proposed series of reactions of ferrocene sites whose formal potential values become successively altered as ion-pair bridges are formed.
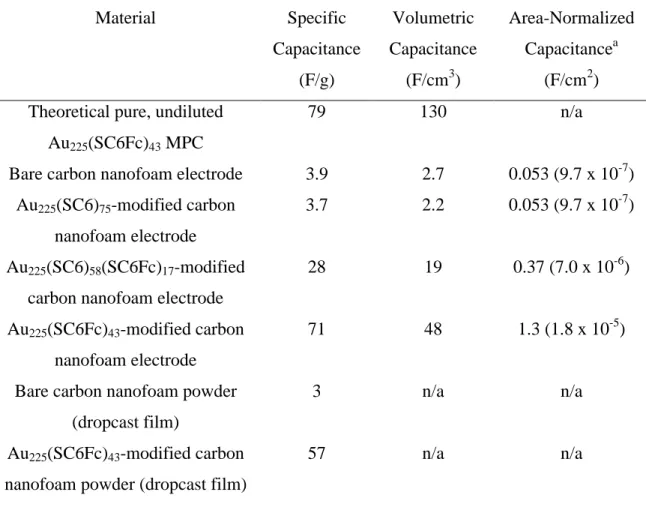
Chapter Five presents the use of anion-induced adsorbed Au225(ω-ferrocenyl hexanethiolate)43 on carbon-paper-supported carbon aerogel (nanofoam) electrodes as novel materials for supercapacitors. The specific capacitance (in F/g) of the carbon nanofoam electrode increases by more than 8000% upon adsorption of the ferrocenyl functionalized gold MPCs. This remarkable increase in capacitance can be attributed to the pseudocapacitance derived from the redox charging of the monolayer as well as the double-layer capacitance arising from the charging of the gold core. The carbon nanofoam
quite polydisperse in size and shape, and the dropcast method to analyze the powder electrochemically leads to nonuniform distrubition of the powder onto surfaces.
Chapter Six investigates the catalytic properties of Pd, Au, Ag, and bimetallic AgAu MPCs. A polar protecting monolayer shell consisting of N-(2-mercaptopropionyl)glycine ligands (also known as tiopronin) is used to allow for solubility in water. The reaction that is catalyzed by all four MPCs is the reduction of 4-nitrophenol in the presence of sodium borohydride, which on its own does not reduce the substrate. The four MPCs all
ACKNOWLEDGEMENTS
I would like to thank my advisor, Dr. Royce W. Murray, for his outstanding guidance and support. He has been an invaluable mentor to me over the past four years. His scientific knowledge is incomparable, and his many ideas have helped stimulate my own scientific thinking. I also very much appreciate the present and former members of the Murray group who have played the roles of mentors, collaborators, and good friends. It was a pleasure working with the many talented and intellectual group members who passed through the lab during my time at UNC. I would also like to thank Dr. Stephen Feldberg of Brookhaven National Lab for all of his stimulating discussions and intriguing ideas as well as the UNC chemistry department’s brilliant faculty and amazing staff for all of their help and encouragement over the past four years.
I would also like to thank my family and my fiance, Dr. Paul Stiles, for their unwavering support and encouragement. Paul’s hard work and dedication to his own doctoral research set an excellent example for me to follow, and his passion for science is clearly contagious. Without the life-long encouragement and support from my parents, I never would have made it this far. My two sisters have also been instrumental in
TABLE OF CONTENTS
Page
List of Tables ... xi
List of Figures ... xii
List of Abbreviations and Symbols... xvii
Chapter 1. Introduction to Monolayer Protected Metal Clusters ………...1
1.1. Introduction...1
1.2. MPC Synthesis...2
1.3. MPC Size Dispersion and Separation...3
1.4. Core Size Dependent Properties of Gold MPCs ...4
1.5. Determination of Number of Gold Core Atoms ...6
1.6. References...13
Chapter 2. Analytical Evidence for the Monolayer Protectec Cluster Au225[(S(CH2)5CH3]75………...20
2.1. Introduction...20
2.2. Experimental Section...22
2.3. Results and Discussion ...25
2.4. Conclusions...39
2.5. Acknowledgements...43
Chapter 3. Fully Ferrocenated Hexanethiolate Monolayer-Protected Gold
Clusters……….………47
3.1. Introduction...47
3.2. Experimental Section...51
3.3. Results and Discussion ...54
3.4. Conclusions...78
3.5. Acknowledgements...82
3.6. References...83
Chapter 4. Anion Induced Adsorption of Ferrocenated Nanoparticles………...87
4.1. Introduction...87
4.2. Experimental Section ...89
4.3. Results and Discussion ...93
4.4. Acknowledgements...133
4.5. References...135
Chapter 5. Redox Functionalized Monolayer Protected Gold Clusters as Electrochemical Capacitors………..139
5.1. Introduction...139
5.2. Experimental Section ...141
5.3. Results and Discussion ...145
5.4. Conclusions...174
5.5. Acknowledgements...175
5.6. References...176
Chapter 6. Catalysis with Monolayer Protected Metal Clusters………..183
6.1. Introduction...183
6.2. Experimental Section ...185
6.3. Results and Discussion ...187
6.4 Conclusions...197
6.5 Acknowledgements...197
LIST OF TABLES
Table 2.1 Estimation of Core Size of Au225[(S(CH2)5CH3)]75 MPCs Using HPLC and Ratio of Optical Absorbance Detector Signal and One-Electron Charging Currents of MPCs in Two Separate Experiments……….42 Table 3.1 Voltammetric Quantized Double Layer Charging Results for
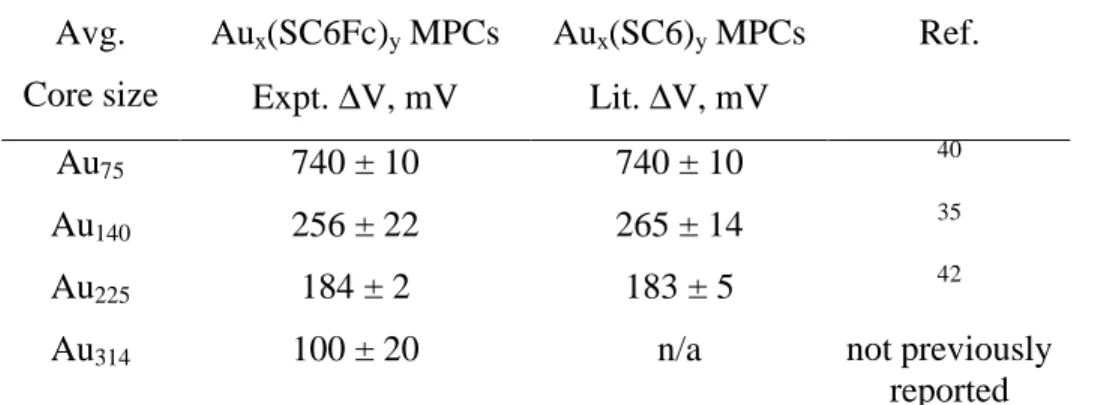
Ferrocene-hexanethiolate Protected Au Clusters (Figure 3.1) and Literature Values for Hexanethiolate Protected Au Clusters…..………59 Table 3.2 Ligand Counts and Ligand/Surface Atom Coverages for Hexanethiolate and
Fully Ferrocenated Hexanethiolate Monolayers, for Au MPCs of Varying Core Size………...76 Table 4.1 Effect of type and concentration of supporting electrolyte on coverage ΓMPC
of ferrocenated MPCs adsorbed on Pt electrode from a 0.05 mM MPC solution, during survey potential scanning (between 0.2 and 1.0 V at 0.50 V/s)………. 100 Table 4.2 Effect of potential scanning (between 0.2 and 1.0 V at 0.50 V/s) on
adsorption of ferrocenated MPCs from Bu4NClO4/CH2Cl2 solution in survey experiment.………..101 Table 4.3 Rate constants for MPC adsorption derived from fixed-time and no-scan
experimental protocols. GMPC was measured as a function of MPC
concentration in fixed-time experiments and as a function of time in no-scan protocol. (All scans were taken between 0 and 0.8 V/s.).………...119 Table 5.1 Specific capacitances of bare and MPC-modified carbon nanofoam
electrodes and powder..………...155 Table 5.1A RC time constant and capacitance values for different carbon nanofoam
electrode materials……...………...182 Table 6.1 Apparent rate constants for the reduction of 4-nitrophenol in the presence of NaBH4 and tiopronin-protected metal clusters………...198
LIST OF FIGURES
Figure 1.1 Cyclic voltammogram of 0.2 mM Au140(SC6)53 in CH2Cl2 with 0.1 M Bu4NClO4 at 283 K with scan rate of 0.1 V/s…………..………7 Figure 1.2 Concentric sphere capacitor model for a monolayer protected gold
cluster………...9 Figure 2.1 (a) TEM image of Au225[(S(CH2)5CH3)]75 in CH2Cl2; (b) Size-distribution
histogram for several TEM images of Au225[(S(CH2)5CH3)]75 in CH2Cl2 (118 MPCs in total from three different batches synthesized separately); (c) TGA analysis of organic mass lost for a sample of Au225[(S(CH2)5CH3)]75; (d) UV/Vis absorbance spectrum for
Au225[(S(CH2)5CH3)]75.……….27 Figure 2.2 (a) Model of Au225 core with vertex, terrace, and edge atoms labeled; (b) Osteryoung square wave voltammogram (OSWV) of 0.2 mM Au225[(S(CH2)5CH3)]75 in CH2Cl2 with 0.1 M tetrabutylammonium perchlorate. OSWV measured with step potential of 4 mV, square wave amplitude of 25 mV, square wave frequency of 15 s-1, quiet time of 2 s, sensitivity of 1 µA/V, and sampling rate of 256 samples per point; (c) Oxidation scan only of OSWV of polydisperse Au225[(S(CH2)5CH3)]75; the solid line represents the same experimental data as in part (b) of this figure. The shaded line represents a simulation which includes currents weighted according to proportions of various sizes from TEM histogram (Figure 2.1b), as shown in Ref. 32.………30 Figure 2.3 HPLC chromatograms for a solution of a mixture of Au225[(S(CH2)5CH3)]75
and Au140[(S(CH2)5CH3)]57 (solid line), Au225[(S(CH2)5CH3)]75 alone (dotted line), and Au140[(S(CH2)5CH3)]57 alone (dashed line) from (a) the PDA absorbance detector and (b) the electrochemical detector taken at a potential of 350 mV. The corresponding absorbance spectra are shown for the (c) Au225[(S(CH2)5CH3)]75 and (d) Au140[(S(CH2)5CH3)]57 peaks obtained from the absorbance chromatogram of the mixture.………..37 Figure 2.4 Current vs. potential curves for the single electron charging event of the 0 to
+1 state of the eluted bands of (a) Au225[(S(CH2)5CH3)]75 and (b)
Au140[(S(CH2)5CH3)]57 with limiting current shown (ilim).………...40 Figure 3.1 (A) Cyclic voltammogram of 0.2 mM Au75(SC6Fc)37 in 0.1 M
OSWV was performed on 0.2 mM MPC in 0.1 M Bu4NClO4/CH2Cl2 with step potential of 4 mV, square wave amplitude of 25 mV, and square wave
frequency of 15 s-1………56
Figure 3.2 UV/Vis absorbance spectra for the four separately synthesized ferrocene hexanethiolate protected Au clusters in CH2Cl2.………...61 Figure 3.3 TEM images of (a) Au314(SC6Fc)58, (b) Au225(SC6Fc)43, (c) Au140(SC6Fc)39,
and (d) Au75(SC6Fc)37. Corresponding core diameter histograms with average core diamteters labeled, each from 100 sampled MPC cores, are inset in the bottom right corner of each image. Inset in the top left corner of (b) is a high-resolution image of a Au225(SC6Fc)43 core clearly showing lattice planes………..63 Figure 3.4 TEM images of (a) Au314(SC6)91, (b) Au225(SC6)75, (c) Au140(SC6)53, and
(d) Au75(SC6)40. Corresponding core diameter histograms with average core diameters labeled, each from 100 sampled MPC cores, are inset in the bottom right corner of each image…...………66 Figure 3.5 First derivative of the CV of (A) Au314(SC6Fc)68, (B) Au225(SC6Fc)43, and
(C) Au140(SC6Fc)39 done under Ar atmosphere at 284 K with potential scan rate of 100 mV/s and sample interval of 1 mV. First derivative of the CV of (D) 0.1 mM Bu4NClO4 in CH2Cl2 (no MPC) under identical conditions (blue, upper line, corresponding to left y-axis) and under identical conditions except with a sample interval of 4 mV (red, lower line,
corresponding to right y-axis). The difference in sample interval is shown to demonstrate the dependence of peak spacing with sample interval and to show that 100 mV spacing can be achieved as in other references which attribute this spacing as QDL peaks.46,47………..68 Figure 3.6 Thermogravimetric analysis (TGA) traces of (A) HSC6Fc, (B)
Au225(SC6Fc)43, and (C) Au225(SC6)75, for comparison.………...71 Figure 3.7 Bulk electrolysis charge vs. time curves for Au75(SC6Fc), Au140(SC6Fc)39,
Au225(SC6Fc)43, and Au314(SC6Fc)58 at concentrations of 0.05 mM, 0.11 mM, 0.10 mM, and 0.04 mM, respectively, and over potential differences of 462 mV, 447 mV, 260 mV, and 230 mV, respectively. All measurements were performed in 50 mM Bu4NClO4 in CH2Cl2 using a Pt mesh working electrode, a Pt wire counter electrode (in a separate cell compartment), and a Ag/AgCl (aqueous) reference electrode………73 Figure 3.8 (A) Cyclic voltammogram of solution of 0.1 mM Au225(SC6Fc)43 in 1 M
Figure 4.1 Cyclic voltammetry of: Curves A-C, 0.1 mM Au225(SC6Fc)43 (MPC) in 1.0 M Bu4NPF6/CH2Cl2 solution at potential scan rates 0.025, 0.20, and 2.0 V/s, respectively, and of Curves D-F, an adsorbed Au225(SC6Fc)43 film on electrode (ΓMPC = 7.1 x 10⁻¹² mol/cm2) formed by potential scanning in 0.1 mM MPC in 1.0 M Bu4NPF6/CH2Cl2 solution and transferred to an MPC-free 1.0 M Bu4NPF6/CH2Cl2 solution, at potential scan rates of 0.025, 0.20, and 2.0 V/s, respectively………...………94 Figure 4.2 First 10 cyclic voltammograms (1.0 V/s) of an adsorbed MPC layer formed
in a 0.1 mM MPC, 1.0 M Bu4NPF6/CH2Cl2 solution after transfer to an MPC-free 1.0 M Bu4NPF6/CH2Cl2 solution. Inset: blow-up of oxidation current peak, showing slight initial change. Thereafter, peak currents are stable and reproducible.………97 Figure 4.3 Oxidation peak (solid blue line) from cyclic voltammetry (2.0 V/s) of partly
ferrocenated, Au225(SC6)58(SC6Fc)17, adsorbed MPCs in 1.0 M Bu4NClO4. The dashed pink line is a simulated waveshape for a reversible one-electron transfer with no lateral interactions and with Eo’ the same for all ferrocenes (Equation 4). ΓMPC = 2 x 10-13 mol/cm2……….103 Figure 4.4 (A) Cyclic voltammetry (blue curve, 0.20 V/s) of an adsorbed
Au225(SC6Fc)43 film formed on a clean Pt electrode from a 0.1 mM MPC, 1.0 M Bu4NPF6/CH2Cl2 solution and transferred to an MPC-free 1.0 M Bu4NPF6/CH2Cl2 solution. (B) Cyclic voltammetry (red curve, 0.20 V/s) of an identically treated Pt electrode, except that the Pt electrode had been first coated with a dodecanethiolate self-assembled monolayer (SAM……….106 Figure 4.5 Cyclic voltammograms of an MPC-free 1.0 M Bu4NClO4/CH2Cl2 solution at
(A) a bare Pt electrode and (B) a Pt electrode with an adsorbed film of Au225(SC6Fc)43 (made in 0.1 mM MPC solution). The cyclic
voltammograms were collected at 0.20 V/s.………...108 Figure 4.6 Potential cycling on 1 M Bu4NClO4/CH2Cl2 of a Pt electrode with an
adsorbed film of Au225(SC6Fc)43 (made in 0.1 mM MPC/1.0 M
Bu4NClO4/CH2Cl2 solution). A 90 % loss in coverage was observed over the course of 280 scans that included the negative potential region. The cycling was performed at 0.2 V/s with a Pt wire auxilary electrode and a Ag/AgCl (aq) reference electrode.………..110 Figure 4.7 Cartoon of ion-induced adsorption, where ferrocenium cations on the MPC
form ion-pair bridges with electrolyte anions specifically adsorbed to the Pt electrode. It can be imagined that the ligand shell may become deformed to form ion-pair bridges of similar dimensions. Formation of ion-pair bridges shown stabilizes successive ion-pair bridges and can cause a successive shift in Fc/Fc+ formal potentials (
max j
Figure 4.8 Panel A: Fractional coverages (θ) of MPCs measured in fixed-time
experiments at different MPC concentrations (lower horizontal axis) in 1.0 M Bu4NClO4 (open black circles, ΓMONO = 0.7 x 10⁻¹¹ mol/cm2) and 1.0 M Bu4NPF6 (filled black circles, ΓMONO = 1.3 x 10⁻¹¹ mol/cm2) electrolytes. The upper horizontal axis is normalized MPC concentration*time (tc), where t = 80 s for all data points. Panel B: Coverage of MPCs (ΓMPC) measured as a function of log(tc) in no-scan (open red circles), scanning (filled red circles), and fixed-time (ClO4- open black circles, PF6- filled black circles) protocol experiments. No-scan and scanning experimental
protocols used a fixed (0.05 mM) MPC concentration in 1.0 M
Bu4NClO4/CH2Cl2. The solid lines in both Panels are fits to the first-order rate expression, Equation 3, for the rate constants displayed in Table 4.3. No fit was performed on the scanning protocol as it leads to multilayers and does not appear to attain a saturation coverage.………116 Figure 4.9 Simulations of
max j
E scheme voltammetry for sequential electron transfer reactions of 10 ferrocene ligands per adsorbed MPC, where each
successively reacting ferrocene’s formal potential is incrementally shifted by ∆Eo’ = -4 mV. The numbers by the curves are values of j; i.e., j = 3 is the voltammetry predicted for reaction of the first three ferrocenes only and j = 10 for overall current after the tenth ferrocene has reacted………....123 Figure 4.10 Simulations of a 10 e- transfer with 10 successive Eo’ values, each less
positive (by ∆Eo’)than the previous one (
max j
E scheme); each simulation has a different ∆Eo’, with the numbers by the curve representing the values of
∆Eo’ ranging from -1 mV (the sharpest peak) to -11 mV (the broadest
peak).………...126 Figure 4.11 Simulations of the oxidative peak of a one electron transfer of an ideal
adsorbed ferrocene monolayer (blue dashed line) and
max j
E scheme with j = 10 and varied ∆Eo’ (pink dashed line), compared to experimental
voltammetry (green solid line, 0.025 V/s) of ferrocenated MPCs adsorbed from a 0.1 mM MPC solution in 1.0 M Bu4NPF6/CH2Cl2 (Curves A – C) and 1.0 M Bu4NClO4/CH2Cl2 (Curve D). Varied ∆Eo’ fits (blue dashed line) for Curve A has ∆Eo’ = -1 mV (FWHM = 23 mV), for Curve B and D ∆Eo’ = -4 mV (FWHM = 35 mV), and for Curve C ∆Eo’ = -6 mV (FWHM = 53 mV); the best fit for both electrolytes is at ∆Eo’ = -4 mV. To compare the curves, all are normalized to the experimental Eo’ and peak
-1
cm2). Experimental data collected from 1.0 M Bu4PF6/CH2Cl2 (not shown) gave a similarly good fit to Equation 5, using rOx = rRed = 6 x 10¹¹ mol-1cm2. Predicted curves are normalized to the experimental Eo’ and peak
current……….132 Figure 5.1 (A) Cyclic voltammogram (0.025 V/s) of an adsorbed Au225(SC6Fc)43 film
formed on a clean glassy carbon electrode from a 0.1 mM MPC, 1.0 M Bu4NClO4/CH2Cl2 solution and transferred to an MPC-free 1.0 M
Bu4NClO4/CH2Cl2 solution. (B) Comparison of cyclic voltammograms of two electrodes treated identically to (A) except that the blue curve is for a Au225(SC6Fc)43 film formed on a clean glassy carbon electrode (same as (A)) and the maroon curve is for a Au225(SC6Fc)43 film formed on a clean platinum electrode.………...148 Figure 5.2 Cartoon schematic of the carbon nanofoam electrode used. A
plastic-protected wire with exposed metal ends is connected to a square cut-out from a carbon-paper-supported carbon nanofoam sheet through one metal end with silver paint (cured overnight) and sealed with epoxy (cured
overnight).………...151 Figure 5.3 Pseudo-first-order rate plots for exchange of phenylethanethiolate (PhC2S-)
by p-toluenethiol (4-CH3-PhSH) onto (Panel a) Au38(SC2Ph)24 and (Panel b) Au140(SC2Ph)53 at mole ratio of 4-CH3-PhSH/ PhC2S- = 4.3 :1 and 3.3 :1, respectively……….153 Figure 5.4 Fifty cyclic voltammograms of Au225(SC6Fc)43-modified carbon nanofoam
electrode in 1.0 M NaSO4/H2O taken at scan rate 0.025 V/s. After fifty cycles, there is ca. 34% loss in current. Counter electrode was vitreous carbon...………...158 Figure 5.5 Cyclic voltammograms of (A) bare and (B) Au225(SC6Fc)43-modified
carbon nanofoam electrodes in 1.0 M NaSO4/H2O at 0.010 V/s with vitreous carbon counter electrode. The larger blue curves are for a carbon nanofoam electrode with area 9.5 cm2, and the smaller marron curves are for a carbon nanofoam electrode with area 2.3 cm2. (C) Cyclic voltammograms of the same Au225(SC6Fc)43-modified carbon nanofoam electrode (A = 9.5 cm2) in 1.0 M NaSO4/H2O at 0.002 V/s with (maroon curve) and without (blue curve) the drying at 70 oC for one hour step between cycling in 0.1 mM MPC/1.0 M Bu4NClO4/CH2Cl2 (for MPC adsorption) and cycling in 1.0 M NaSO4/H2O (for capacitance measurements). The counter electrode used for both was vitreous
carbon………...160 Figure 5.6 Scanning electron micrographs of (a and c) bare carbon-paper-supported
Figure 5.7 Cyclic voltammogram of bare carbon nanofoam powder dropcast on a glassy carbon disk electrode (maroon line) and Au225(SC6Fc)43-modified carbon nanofoam powder dropcast on the same glassy carbon disk electrode (blue line) in 1.0 M NaSO4/H2O. Scan rate was 0.002 V/s and counter electrode was platinum wire.………..166 Figure 5.8 Mass normalized cyclic voltammograms of Au225(SC6Fc)43-modified
carbon nanofoam electrode (red line) and Au225(SC6Fc)43-modified carbon nanofoam powder dropcast on a glassy carbon disk electrode (black line) in 1.0 M NaSO4/H2O. Scan rate was 0.005 V/s. Counter electrode was vitreous carbon for the MPC-modified nanofoam electrode and platinum wire for the MPC-modified nanofoam powder film.…………...………...168 Figure 5.9 Rotated disk voltammetry of bare carbon nanofoam powder sonicated in 1.0
M NaSO4/H2O at 0.010 V/s and rotation rates of (A) 400 (teal curve), 625 (purple curve), 900 (black curve), 1600 (blue curve), and 2500 (maroon curve) rpm and (B) 1600 (maroon curve), 2500 (blue curve), and 3600 (teal curve) rpm. Counter electrode for all scans was a platinum
wire.………...……….172 Figure 5.1A Plots of natural log of current (ln(I)) vs. time (t) for the small (physical area
= 2.3 cm2) bare carbon nanofoam electrode (A), large (physical area = 9.5 cm2) bare (B) and Au225(SC6Fc)43-modified (C) carbon nanofoam
electrodes, and Au225(SC6Fc)43-modified carbon nanofoam powder (D). The insets in each plot are of the first five points of the larger plot in which the RC values were derived from the slopes using Equation 1A…………181 Figure 6.1 UV/visible absorbance spectra of tiopronin-protected clusters with metal
cores of (a) Pd, (b) Au, (c) Ag, and (d) AgAu..……….…….188 Figure 6.2 UV-Vis absorbance spectra of 0.1 mM 4-nitrophenol in H2O (pH = 12) with
1 x 10⁻² M NaBH4 and 2.0 x 10⁻⁴ M tiopronin-protected AgAu clusters over a time period of one to 125 minutes with spectra taken every one
minute……….190 Figure 6.3 Absorbance at 400 nm vs. time plot of the reduction of 4-nitrophenol using
the tiopronin-protected clusters with metal cores comprised of (a) Pd, (b) AgAu, (c) Ag, and (d) Au. Absorbance was monitored in H2O (pH = 12) with 1.0 x 10⁻² M NaBH4, and 2.0 x 10⁻⁴ M MPC………..193 Figure 6.4 Plot of ln(Abs) vs. time, where Abs is absorbance monitored at 400 nm, of
LIST OF ABBREVIATIONS AND SYMBOLS
2-D Two-Dimensional
3-D Three-Dimensional
A Absorbance
Amperes Electrode area
abbr. abbreviation
ACLU MPC surface area
Ag Silver
AgQRE Silver quasi-reference electrode
Ag/Ag+ Silver-silver ion non-aqueous reference electrode Ag/AgCl (aq) Siliver-silver chloride aqueous reference electrode
Au Gold
AuCl4– Tetrachloroaurate
Au(I)-SR Au(I) thiolate
a Atto-
aF AttoFarad
BAS Bioanalytical Systems
BH4– Borohydride
Bu4NClO4 Tetrabutylammonium perchlorate
Bu4NPF6 Tetrabutylammonium hexafluorophosphate
C Carbon
Concentration Coulombs 13
C NMR 13C Nuclear Magnetic Resonance Spectroscopy
°C Degrees Celsius
CCl4 Carbon tetrachloride
CMPC MPC double-layer capacitance CD2Cl2 Deuterated methylene chloride
CE Capillary electrophoresis
CH2 Methylene group
CH2Cl2 Methylene chloride (or dichloromethane)
CH3 Methyl group
CH3CN Acetonitrile
Cn Alkanethiol with n carbon atoms
COOH Carboxylic acid group
CV Cyclic voltammetry
ca. About
cm Centimeter
D Diffusion coefficient
DMPC MPC diffusion coefficient
DCM Methylene chloride
DL Double-layer
DPV Differential Pulse Voltammetry
DR Diffusion coefficient of reduced species
d Diameter
Length of MPC monolayer
E Potential
∆E Potential difference
Potential step Pulse amplitude
Eº Formal potential
EºZ,Z-1 Formal potential of the Z/(Z-1) charge state couple E1/2 Electrochemical half-wave potential
ECLC Liquid chromatography with electrochemical detector
EPZC Potential-of-zero charge
EQCM Electrochemical Quartz Crystal Microbalance
e Electronic charge
e– Electron
eV Electron volts
exp Exponential
F Farad
Faraday constant
µF MicroFarad
Fc ferrocene
FT-IR Fourier Transform Infrared Spectroscopy
fd Fast delivery
g Gram
H Hydrogen
1
H NMR Proton Nuclear Magnetic Resonance Spectroscopy
H2O Water
H2SO4 Sulfuric acid
HAuCl4•xH2O Tetrachloroauric acid hydrate
HO Alcohol group
HOOC Carboxylic acid group
HOMO Highest occupied molecular orbital HSC6OH 6-mercapto-1-hexanol thiol
HPLC High performance liquid chromatography
HRTEM High-Resolution Transmission Electron Microscopy
HSC6 Hexanethiol
HSC6Fc ω-Functionalized ferrocene hexanethiol
Hz Hertz
h Hour
I Intercept
I2 Iodine
IEC Ion exchange chromatography
IR Infrared
i Current
∆i Current difference
i.e. That is
J Joule
K Degrees Kelvin
KBr Potassium bromide
k Kilo-
kB Boltzmann constant
kD Kilodaltons
keV Kiloelectron volts
LUMO Lowest unoccupied molecular orbital
log Logarithm
LDI-MS Laser desorption/ionization mass spectrometry
M Metal
Molar
µM Micromolar
MHz MegaHertz
MPC Monolayer-protected cluster MPCAs-prep as-prepared MPC
m Meter
Milli-
mg Milligram
min Minute
mL Milliliter
mM Millimolar
mol Mole
mV Millivolt
N Newtons
Nitrogen
N2 Nitrogen gas
NA Avogadro’s number
NaBH4 Sodium borohydride
NaCl Sodium chloride
n Number of electrons transferred
nA NanoAmperes
nDL Number of double-layer electrons
nm Nanometer
O Oxygen
–
OOC Deprotonated carboxylic acid group
Oct4NBr Tetraoctylammonium bromide
OSWV Osteryoung Square Wave Voltammetry
PDA Photo diode array
PE Place exchange
PhC2S Phenylethanethiolate
PhC2 MPCs Phenylethanethiolate monolayer protected clusters p-X-PhSH Para-substituted aryl thiol
Pt Platinum
PZC Potential-of-zero charge
pH –log [H+]
QDL Quantized double-layer
QDL Double-layer charge
RS Alkanethiolate
RSH Alkanethiol
r Radius
rpm Rotations per minute
S Slope
Sulfur
S/N Signal-to-noise ratio
SAM Self-assembled monolayer
SC6 Hexanethiolate
SC6Fc ω-Functionalized ferrocene hexanethiolate SCE Saturated Calomel Electrode
SEC Size exclusion chromatography SET Single electron transfer
SSCE Sodium-Saturated Calomel Electrode STM Scanning tunneling microscopy
s Second
T Temperature
TEM Transmission electron microscopy TGA Thermogravimetric analysis
THF Tetrahydrofuran
UV-visible Ultraviolet-visible
V Volt
∆V Potential difference
v Volume
vs Versus
vv Vice versa
W1/2 Voltammetric peak-width at half-height
X Times
XPS X-ray photoelectron spectroscopy
Z Charge state
δ Chemical shift
ε Dielectric constant
Molar absorbance coefficient
εο Permittivity of free space
φ quantum efficiency
η Viscosity
λ Wavelength
µ
Micro-ν Scan rate
π Pi
ω Omega functional group
= Equals to
Double bond
– Negative
— Single bond
< Less than
> More than
× Multiplied by
CHAPTER I
INTRODUCTION TO MONOLAYER PROTECTED METAL CLUSTERS
1.1 Introduction
While study of the unique properties of colloidal gold has been an increasingly popular field of scientific research, colloidal gold has actually been used for centuries, often as a method of staining glass. The Lycurgus Cup, made of gold and silver colloids, is the oldest example of manipulating the unique optical properties of metal colloids. The cup dates back to the Romans in the fourth century AD and is well known for its unusual coloring.1 When the cup is viewed in reflected light, for example in the daytime, it appears green, however when light is shone through the cup and transmitted through the glass, the cup appears red. In the seventeenth century, colloids of tin dioxide and gold, known as “Purple of Cassius”, became a popular glass coloring agent.2 The creation of unusual colors using metal colloids led to the investigations of Michael Faraday into the colors of gold clusters in the middle of the 1800s, effectively beginning the field of colloidal science.3
Despite the rich history of colloidal chemistry , it is still an exciting and constantly evolving field. Increasingly the field, as well as much of science, is moving toward smaller dimensions. When gold clusters can be reduced down to the lowest end of the nanoscale (< 10 nm), unique physical and chemical properties emerge that can be exploited in
release of chemical reagents in biological systems.12 Metal clusters require additional support in the form of a chemisorbed monolayer shell, typically with organic thiolated ligands owing to the strong gold-sulfur bond, and, as the clusters get smaller in size, these stabilization supports become increasingly important in determining the structural and chemical properties of the cluster system.13-16 The monolayer prevents aggregation of the metal cores and allows for the nanoparticles to be dissolved, dried, and redissolved without alteration or degradation. Ligand-capped gold clusters have been known for a number of years,17,18 however only in the past decade has the practical formation of stable and isolatable monolayer protected clusters (MPCs) been demonstrated.19
1.2 MPC Synthesis
In early 1994, Brust, Schiffrin, and coworkers19 developed a two-phase (water-toluene) synthesis of stable 1 – 3 nm gold MPCs that penetrated the metal to molecule transition range for this metal. In the original reaction, addition of dodecanethiol to organic phase AuCl4- in a 1:1 mole ratio, followed by reduction by BH4-, leads to dodecanethiolate-protected gold MPCs:
AuCl4- (toluene) + RSH à (-AuISR-)n (polymer) (1)
(-AuISR-)n + BH4-à Aux(SR)y (2)
The “Brust-Schiffrin” synthesis is commonly believed to be a growth, nucleation, and passivation process, however the mechanism is still not completely understood.
Our lab has embraced the Brust-Schiffrin synthesis while extensively modifying it over the years. While the synthesis described usually results in MPCs with a core size
more monodisperse and smaller gold cores,20,22 and (iii) quenching of the reaction immediately after reduction which produces larger amounts of smaller gold cores (≤ 2 nm).23,24
While the Brust-Shiffrin method is most well-known for creating alkanethiolate protected gold clusters, much research interest has been in the modification of the
synthesis, both in terms of the metal core and the stabilizing monolayer. The synthesis has been modified to produce MPCs with different metal cores such as palladium,25-27
platinum,8,27-29 copper,30 and silver27,31-34 as well as bimetal35 cores. The supporting monolayer for organic-soluble MPCs can be made up of organothiolate,19,36-38
organophosphine,39-41 or organoamine42 ligands, which can undergo further modification through place exchange reactions38,39,42-48 leading to heterogeneous ligand shells.
Monolayers have also been extensively functionalized, either through place exchange reactions or as the incoming ligand in the Brust-Schiffrin synthesis, with various end groups including redox-active groups49-53 to investigate multiple electron transfer, electron donating and withdrawing groups54 to examine substituent effects on the metal core, and polar groups26,32,55,56 to create water-soluble MPCs. As MPCs become increasing utilized in the fields of catalysis, biosensors, drug delivery agents, and nanoelectronics their synthesis and functionalization continues to be an active area of research.
1.3 MPC Size Dispersion and Separation
sample that is completely monodisperse in size, several techniques have been developed that significantly aid the size dispersion challenge. These methods include heating,57 etching,58 annealing,59,60 and vapor treating,61,62 however the detailed mechanism behind these techniques are still not well understood. Another route to core size monodispersity is through separation and isolation of the various core sizes. Diverse methods have been developed including solubility solvent fractionation,22 gel electrophoresis,63,64 capillary electrophoresis,52,65-67 size exclusion chromatography (SEC),68-71 ion exchange
chromatography (IEC),72 ion-pair73 and reverse phase HPLC,74-78 ultracentrifugation,79 and molecular imprinting.80
While all of these separation techniques have been shown in specific examples to successfully separate MPCs, many of them present significant problems. For example, while solvent fractionation is an excellent method to isolate large amounts of certain cluster sizes, it can be time-consuming, and it is not always possible to find a suitable solvent to separate selected core sizes. Gel electrophoresis and capillary electrophoresis are also favorable techniques, however they have only been shown to work with water-soluble nanoparticles. Disadvantages of chromatographic separations include irreversible adsorption to SEC packing materials and the inapplicability of IEC and ion-pair
chromatography for neutral MPCs. Reverse-phase HPLC has emerged as an excellent, high-resolution method for separating organic-soluble MPCs in the 1 – 2 nm core size range. The optimization of HPLC conditions for separating nanoparticles is still a growing area of research owing to the complicated nature of the separation.
1.4 Core Size Dependent Properties of Gold MPCs
absorbance spectra of the different sized gold MPCs. For example, the smaller gold MPCs, with cores originally presumed to be composed of ca. 38 gold atoms but later revealed to be of 25 atoms,81 reveal step-like transitions over ca. 300 to 500 nm and a weaker band at ca. 700 nm,24,82,83 but as the gold core gets larger, these features become smeared out,84 until eventually, at ca. 200 gold atoms, a surface plasmon band at ca. 520 nm appears.78,85,86 As the gold core increases to even larger clusters, the surface plasmon band becomes more well-defined until eventually the absorbance spectrum resembles that of the bulk metal. The size-dependent electrochemical properties of gold monolayer protected clusters have been fascinating scientists over the last decade or so and have been extensively investigated by our lab59,78,82-84,87-90 and others.60,91-94 Voltammetry of MPCs with gold core diameters smaller than ca. 1.6 nm displays a distinct, large space between the first oxidation and the first reduction peak. This spacing has been assigned to the HOMO-LUMO energy bandgap owing to the molecule-like properties of the very small gold clusters.82,84
MPCs with gold core diamaters larger than or equal to ca. 1.6 nm exhibit very different voltammetric behavior in that their voltammetry shows a series of evenly spaced peaks, with each peak representing a one electron transfer to or from the gold core. We have coined this phenomenon “quantized double-layer (QDL) charging” as it arises from the cluster’s sub-attofarad capacitance (CCLU) associated with the ionic space charge that forms around an MPC dissolved in a solution of electrolyte.36 Charging of the nanocapacitor by single electrons occurs in potential intervals, ∆V = e/CCLU, where e is the electronic charge, that exceed kBT.87,90 The potentials of the electrochemical current peaks seen in
the MPC gold core has zero charge (EPZC).95 Figure 1.1 shows the cyclic voltammogram, with gold core charge states labeled, of a solution of highly monodisperse MPCs with an average composition of 140 gold atoms and 53 hexanethiolate ligands (Au140(SC6)53). When dissolved in an electrolyte solution, a gold MPC can be considered a concentric sphere capacitor, as shown in Figure 1.2, where the metal core acts as the inner conducting sphere, the organic monolayer as the dielectric, and the boundary of conducting ions as the outer sphere.88 The equation for the concentric sphere capacitor model, which relates the cluster capacitance (CCLU) to the core radius (r), is as follows:
(
r d)
d r
CCLU +
=4πε0ε (3)
where ε0 is the permittivity of free space, and ε and d are the static dielectric constant and the thickness of the monolayer, respectively. Because CCLU is inveresely proportional to
∆V, this equation dictates that as the gold core gets larger in size, the peak potential spacing decreases until ∆V < kBT (thermal spreading, ca. 26 mV at 298 K), where the voltammetry is seen as an unresolved current continuum more characteristic of bulk gold. Electrochemical and optical analysis of gold MPCs continues to exploit the core-size dependent properties and has lead to many interesting discoveries that should aid researchers in their fundamental understanding of small metal clusters.
1.5 Determination of Number of Gold Core Atoms
-1.20E-05 -1.00E-05 -8.00E-06 -6.00E-06 -4.00E-06 -2.00E-06 0.00E+00 2.00E-06 4.00E-06 6.00E-06 8.00E-06 1.00E-05 -2500 -2000 -1500 -1000 -500 0 500 1000 1500
Potential (mV) vs. Ag QRE
(
r
d
)
d
r
C
CLU
+
=
4
πε
0ε
Electrolyte Solution (Conductor)
Moniolayer (Dielectric)
atoms of small gold clusters and their structures including a series of gold clusters spanning the size range from Au6 to Au147 with core diameters of 0.7 to 1.7 nm studied by Rösch et. al.97 Their theoretical investigation was aimed to analyze the convergence of cluster properties toward the corresponding bulk metal values. In their research, they calculated positive gold 4f core level binding energy shifts for the surface sites, which distinguish among the corner, edge, and face-centered sites, providing theoretical evidence of a heterogeneous gold core surface.
In another theoretical study, Landman et. al. investigated slightly larger gold clusters, analyzing the structures of clusters ranging from Au40 to Au20099 and reporting a discrete sequence of optimal clusters with different structural motifs, in particular focusing on the decahedral structures. Whetten et. al. showed, through atomistic modeling and x-ray powder diffraction alaysis, that many of the MPC gold cores, including Au140 and Au225, prefer the truncated octahedral (TO) shells, in particular the TO+ shape which is defined as (0 < n – m≤ 4), where n is the number of atoms between (111) facets, and m is the number of atoms between (111) and (100) facets.100 Most analytical techniques are insufficient to determine the extent of truncation so the actual atom count has some uncertainty, for example it is likely that a sample of Au140 MPCs also contains some clusters with cores of Au142 or Au144.
While theoretical studies of gold clusters have been well documented, there has also been intriguing experimental work devoted to learning more about the atom counts and structures of gold clusters. Although electron microscopy has been a valuable tool in the study of large metal colloids, at the sub-2-nm scale the technique is insufficient in
structure of both the metal cluster and organic monolayer with which electronic properties can be correlated.105-115 However, most clusters of recent interest have not been
successfully crustallized owing to the polydispersity, or size distribution, of the cluster samples.116
Several other analytical techniques are showing promise in the determination of precise cluster core stoichiometry and structure. One such technique is mass spectrometry, both with matrix-assisted laser desorption ionization (MALDI) and electrospray ionization (ESI).63,64,81,116-118 Despite the fact that mass spectrometry is emerging as a valuable technique in core size determination, the analysis still has several difficulties to overcome, including resolving multiple core sizes in polydisperse samples. Another promising new technique, quantitative high-angle annular dark-field scanning transmission electron microscopy (HAADF-STEM), is being employed by Nuzzo et. al. to determine atomic compositions and monodispersity of monolayer protected gold clusters.119,120 HAADF-STEM has the ability to provide both images as well as atom counts of individual
1.6 References
(1) http://www.thebritishmuseum.ac.uk/science/lycurguscup/sr-lycugus-p1.html. (2) Thiessen, P. A. Kolloid Z. 1942, 101, 241-248.
(3) Faraday, M. Philos. Trans. R. Soc. 1857, 147, 145-147.
(4) Aubin, M. E.; Morales, D. G.; Hamad-Schifferli, K. Nano Lett. 2005, 5, 519-522. (5) Grancharov, S. G.; Zeng, H.; Sun, S. H.; Wang, S. X.; O'Brien, S.; Murray, C. B.;
Kirtley, J. R.; Held, G. A. J. Phys. Chem. B 2005, 109, 13030-13035. (6) Li, Z. F.; Ruckenstein, E. Nano Lett. 2004, 4, 1463-1467.
(7) Gao, X. H.; Nie, S. M. Anal. Chem. 2004, 76, 2406-2410. (8) Eklund, S. E.; Cliffel, D. E. Langmuir 2004, 20, 6012-6018.
(9) McFarland, A. D.; Van Duyne, R. P. Nano Lett. 2003, 3, 1057-1062.
(10) Riboh, J. C.; Haes, A. J.; McFarland, A. D.; Yonzon, C. R.; Van Duyne, R. P. J. Phys. Chem. B 2003, 107, 1772-1780.
(11) Malinsky, M. D.; Kelly, K. L.; Schatz, G. C.; Van Duyne, R. P. J. Am. Chem. Soc. 2001, 123, 1471-1482.
(12) Rothrock, A. R.; Donkers, R. L.; Schoenfisch, M. H. J. Am. Chem. Soc. 2005, 127, 9362-9363.
(13) Chao, K. J.; Cheng, M. H.; Ho, Y. F.; Liu, P. H. Catal. Today 2004, 97, 49-53. (14) Haruta, M. Catal. Today 1997, 36, 153-166.
(15) Hills, C. W.; Nashner, M. S.; Frenkel, A. I.; Shapley, J. R.; Nuzzo, R. G. Langmuir 1999, 15, 690-700.
(16) Zhang, P.; Sham, T. K. Appl. Phys. Lett. 2002, 81, 736-738. (17) Schmid, G. Clusters and Colloids; VCH: Weinheim, 1994.
(18) Hayat, M. A. Colloidal Gold: Principles, Methods, and Applications; Academic Press: San Diego, 1991.
(20) Hostetler, M. J.; Wingate, J. E.; Zhong, C.-J.; Harris, J. E.; Vachet, R. W.; Clark, M. R.; Londono, J. D.; Green, S. J.; Stokes, J. J.; Wignall, G. D.; Glish, G. L.; Porter, M. D.; Evans, N. D.; Murray, R. W. Langmuir 1998, 14, 17-30.
(21) Leff, D. V.; Ohara, P. C.; Heath, J. R.; Gelbart, W. M. J. Phys. Chem. 1995, 99, 7036-7041.
(22) Whetten, R. L.; Khoury, J. T.; Alvarez, M. M.; Murthy, S.; Vezmar, I.; Wang, Z. L.; Stephens, P. W.; Cleveland, C. L.; Luedtke, W. D.; Landman, U. Adv. Mater. 1996, 8, 428-&.
(23) Alvarez, M. M.; Khoury, J. T.; Schaaff, T. G.; Shafigullin, M.; Vezmar, I.; Whetten, R. L. Chem. Phys. Lett. 1997, 266, 91-98.
(24) Schaaff, T. G.; Shafigullin, M. N.; Khoury, J. T.; Vezmar, I.; Whetten, R. L.; Cullen, W. G.; First, P. N.; GutierrezWing, C.; Ascensio, J.; JoseYacaman, M. J. J. Phys. Chem. B 1997, 101, 7885-7891.
(25) Zamborini, F. P.; Gross, S. M.; Murray, R. W. Langmuir 2001, 17, 481-488. (26) Cliffel, D. E.; Zamborini, F. P.; Gross, S. M.; Murray, R. W. Langmuir 2000, 16,
9699-9702.
(27) Tan, Y. W.; Dai, X. H.; Li, Y. F.; Zhu, D. B. J. Mater. Chem. 2003, 13, 1069-1075. (28) Yang, J.; Lee, J. Y.; Deivaraj, T. C.; Too, H. P. Colloid Surf. A-Physicochem. Eng.
Asp. 2004, 240, 131-134.
(29) Kim, K. S.; Demberelnyamba, D.; Lee, H. Langmuir 2004, 20, 556-560. (30) Chen, S. W.; Sommers, J. M. J. Phys. Chem. B 2001, 105, 8816-8820.
(31) Murthy, S.; Bigioni, T. P.; Wang, Z. L.; Khoury, J. T.; Whetten, R. L. Mater. Lett. 1997, 30, 321-325.
(32) Chen, S. H.; Kimura, K. Chem. Lett. 1999, 1169-1170. (33) Shon, Y. S.; Cutler, E. Langmuir 2004, 20, 6626-6630.
(34) Branham, M. R.; Douglas, A. D.; Mills, A. J.; Tracy, J. B.; White, P. S.; Murray, R. W. Langmuir 2006, 22, 11376-11383.
(35) Shon, Y. S.; Dawson, G. B.; Porter, M.; Murray, R. W. Langmuir 2002, 18, 3880-3885.
(37) Whetten, R. L.; Shafigullin, M. N.; Khoury, J. T.; Schaaff, T. G.; Vezmar, I.; Alvarez, M. M.; Wilkinson, A. Accounts of Chemical Research 1999, 32, 397-406. (38) Brown, L. O.; Hutchison, J. E. J. Am. Chem. Soc. 1997, 119, 12384-12385.
(39) Petroski, J.; Chou, M. H.; Creutz, C. Inorg. Chem. 2004, 43, 1597-1599. (40) Weare, W. W.; Reed, S. M.; Warner, M. G.; Hutchison, J. E. J. Am. Chem. Soc.
2000, 122, 12890-12891.
(41) Schmid, G. Chem. Rev. 1992, 92, 1709-1727.
(42) Brown, L. O.; Hutchison, J. E. J. Am. Chem. Soc. 1999, 121, 882-883.
(43) Boal, A. K.; Das, K.; Gray, M.; Rotello, V. M. Chem. Mat. 2002, 14, 2628-2636. (44) Donkers, R. L.; Song, Y.; Murray, R. W. Langmuir 2004, 20, 4703-4707.
(45) Guo, R.; Song, Y.; Wang, G. L.; Murray, R. W. J. Am. Chem. Soc. 2005, 127, 2752-2757.
(46) Hostetler, M. J.; Templeton, A. C.; Murray, R. W. Langmuir 1999, 15, 3782-3789. (47) Song, Y.; Murray, R. W. J. Am. Chem. Soc. 2002, 124, 7096-7102.
(48) Song, Y.; Huang, T.; Murray, R. W. J. Am. Chem. Soc. 2003, 125, 11694-11701. (49) Hostetler, M. J.; Green, S. J.; Stokes, J. J.; Murray, R. W. J. Am. Chem. Soc. 1996,
118, 4212-4213.
(50) Ingram, R. S.; Murray, R. W. Langmuir 1998, 14, 4115-4121. (51) Miles, D. T.; Murray, R. W. Anal. Chem. 2001, 73, 921-929.
(52) Templeton, A. C.; Cliffel, D. E.; Murray, R. W. J. Am. Chem. Soc. 1999, 121, 7081-7089.
(53) Wolfe, R. L.; Balasubramanian, R.; Tracy, J. B.; Murray, R. W. Langmuir 2007, 23, 2247-2254.
(54) Guo, R.; Murray, R. W. J. Am. Chem. Soc. 2005, 127, 12140-12143.
(55) Shon, Y. S.; Wuelfing, W. P.; Murray, R. W. Langmuir 2001, 17, 1255-1261. (56) Templeton, A. C.; Chen, S. W.; Gross, S. M.; Murray, R. W. Langmuir 1999, 15,
(57) Devenish, R. W.; Goulding, T.; Heaton, B. T.; Whyman, R. J. Chem. Soc.-Dalton Trans. 1996, 673-679.
(58) Schaaff, T. G.; Whetten, R. L. J. Phys. Chem. B 1999, 103, 9394-9396. (59) Hicks, J. F.; Miles, D. T.; Murray, R. W. J. Am. Chem. Soc. 2002, 124,
13322-13328.
(60) Quinn, B. M.; Liljeroth, P.; Ruiz, V.; Laaksonen, T.; Kontturi, K. J. Am. Chem. Soc. 2003, 125, 6644-6645.
(61) Maye, M. M.; Zheng, W. X.; Leibowitz, F. L.; Ly, N. K.; Zhong, C. J. Langmuir 2000, 16, 490-497.
(62) Zhong, C. J.; Zhang, W. X.; Leibowitz, F. L.; Eichelberger, H. H. Chem. Commun. 1999, 1211-1212.
(63) Schaaff, T. G.; Whetten, R. L. Journal of Physical Chemistry B 2000, 104, 2630-2641.
(64) Schaaff, T. G.; Knight, G.; Shafigullin, M. N.; Borkman, R. F.; Whetten, R. L. Journal of Physical Chemistry B 1998, 102, 10643-10646.
(65) Schnabel, U.; Fischer, C. H.; Kenndler, E. J. Microcolumn Sep. 1997, 9, 529-534. (66) Rodriguez, M. A.; Armstrong, D. W. J. Chromatogr. B 2004, 800, 7-25.
(67) Liu, F. K.; Ko, F. H.; Huang, P. W.; Wu, C. H.; Chu, T. C. J. Chromatogr. A 2005, 1062, 139-145.
(68) Wei, G. T.; Liu, F. K.; Wang, C. R. C. Anal. Chem. 1999, 71, 2085-2091. (69) Wei, G. T.; Liu, F. K. J. Chromatogr. A 1999, 836, 253-260.
(70) Fischer, C. H.; Lilie, J.; Weller, H.; Katsikas, L.; Henglein, A. Ber. Bunsen-Ges. Phys. Chem. Chem. Phys. 1989, 93, 61-64.
(71) Siebrands, T.; Giersig, M.; Mulvaney, P.; Fischer, C. H. Langmuir 1993, 9, 2297-2300.
(72) Bos, W.; Steggerda, J. J.; Yan, S. P.; Casalnuovo, J. A.; Mueting, A. M.; Pignolet, L. H. Inorg. Chem. 1988, 27, 948-951.
(74) Song, Y.; Jimenez, V.; McKinney, C.; Donkers, R.; Murray, R. W. Anal. Chem. 2003, 75, 5088-5096.
(75) Song, Y.; Heien, M.; Jimenez, V.; Wightman, R. M.; Murray, R. W. Anal. Chem. 2004, 76, 4911-4919.
(76) Jimenez, V. L.; Leopold, M. C.; Mazzitelli, C.; Jorgenson, J. W.; Murray, R. W. Anal. Chem. 2003, 75, 199-206.
(77) Fischer, C. H.; Weller, H.; Katsikas, L.; Henglein, A. Langmuir 1989, 5, 429-432. (78) Wolfe, R. L.; Murray, R. W. Anal. Chem. 2006, 78, 1167-1173.
(79) Calabretta, M.; Jamison, J. A.; Falkner, J. C.; Liu, Y. P.; Yuhas, B. D.; Matthews, K. S.; Colvin, V. L. Nano Lett. 2005, 5, 963-967.
(80) Koenig, S.; Chechik, V. Chem. Commun. 2005, 4110-4112.
(81) Tracy, J. B.; Kalyuzhny, G.; Crowe, M. C.; Balasubramanian, R.; Choi, J. P.; Murray, R. W. J. Am. Chem. Soc. 2007, 6706-6707.
(82) Jimenez, V. L.; Georganopoulou, D. G.; White, R. J.; Harper, A. S.; Mills, A. J.; Lee, D. I.; Murray, R. W. Langmuir 2004, 20, 6864-6870.
(83) Lee, D.; Donkers, R. L.; Wang, G. L.; Harper, A. S.; Murray, R. W. J. Am. Chem. Soc. 2004, 126, 6193-6199.
(84) Balasubramanian, R.; Guo, R.; Mills, A. J.; Murray, R. W. J. Am. Chem. Soc. 2005, 127, 8126-8132.
(85) Alvarez, M. M.; Khoury, J. T.; Schaaff, T. G.; Shafigullin, M. N.; Vezmar, I.; Whetten, R. L. J. Phys. Chem. B 1997, 101, 3706-3712.
(86) Kreibig, U.; Vollmer, M. Optical Properties of Metal Clusters; Springer-Verlag: New York, 1995.
(87) Ingram, R. S.; Hostetler, M. J.; Murray, R. W.; Schaaff, T. G.; Khoury, J. T.; Whetten, R. L.; Bigioni, T. P.; Guthrie, D. K.; First, P. N. J. Am. Chem. Soc. 1997, 119, 9279-9280.
(88) Hicks, J. F.; Templeton, A. C.; Chen, S. W.; Sheran, K. M.; Jasti, R.; Murray, R. W.; Debord, J.; Schaaf, T. G.; Whetten, R. L. Anal. Chem. 1999, 71, 3703-3711. (89) Chen, S. W.; Murray, R. W.; Feldberg, S. W. J. Phys. Chem. B 1998, 102,
(90) Chen, S. W.; Ingram, R. S.; Hostetler, M. J.; Pietron, J. J.; Murray, R. W.; Schaaff, T. G.; Khoury, J. T.; Alvarez, M. M.; Whetten, R. L. Science 1998, 280, 2098-2101. (91) Yang, Y.; Pradhan, S.; Chen, S. Journal of American Chemical Society 2004, 126,
76-77.
(92) Kim, Y. G.; Garcia-Martinez, J. C.; Crooks, R. M. Langmuir 2005, 21, 5485-5491. (93) Chaki, N. K.; Kakade, B.; Sharma, J.; Mahima, S.; Vijayamohanan, K. P.; Haram,
S. K. J. Appl. Phys. 2004, 96, 5032-5036.
(94) Chaki, N. K.; Singh, P.; Dharmadhikari, C. V.; Vijayamohanan, K. P. Langmuir 2004, 20, 10208-10217.
(95) Chen, S. W.; Murray, R. W. J. Phys. Chem. B 1999, 103, 9996-10000.
(96) Cleveland, C. L.; Landman, U.; Schaaff, T. G.; Shafigullin, M. N.; Stephens, P. W.; Whetten, R. L. Phys. Rev. Lett. 1997, 79, 1873-1876.
(97) Haberlen, O. D.; Chung, S. C.; Stener, M.; Rosch, N. J. Chem. Phys. 1997, 106, 5189-5201.
(98) Hakkinen, H.; Barnett, R. N.; Landman, U. Phys. Rev. Lett. 1999, 82, 3264-3267. (99) Barnett, R. N.; Cleveland, C. L.; Hakkinen, H.; Luedtke, W. D.; Yannouleas, C.;
Landman, U. Eur. Phys. J. D 1999, 9, 95-104.
(100) Cleveland, C. L.; Landman, U.; Shafigullin, M. N.; Stephens, P. W.; Whetten, R. L. Z. Phys. D-Atoms Mol. Clusters 1997, 40, 503-508.
(101) Yang, J. C.; Bradley, S.; Gibson, J. M. Mater. Charact. 2003, 51, 101-107. (102) Yang, J. C.; Bradley, S.; Gibson, J. M. Microsc. microanal. 2000, 6, 353-357. (103) Singhal, A.; Yang, J. C.; Gibson, J. M. Ultramicroscopy 1997, 67, 191-206. (104) Treacy, M. M. J.; Rice, S. B. J. Microsc.-Oxf. 1989, 156, 211-234.
(105) Teo, B. K.; Shi, X. B.; Zhang, H. J. Am. Chem. Soc. 1992, 114, 2743-2745. (106) Briant, C. E.; Gardner, C. J.; Hor, T. S. A.; Howells, N. D.; Mingos, D. M. P. J.
Chem. Soc.-Dalton Trans. 1984, 2645-2651.
(108) Briant, C. E.; Hall, K. P.; Mingos, D. M. P. J. Chem. Soc.-Chem. Commun. 1984, 290-291.
(109) Briant, C. E.; Hall, K. P.; Wheeler, A. C.; Mingos, D. M. P. J. Chem. Soc.-Chem. Commun. 1984, 248-250.
(110) Smits, J. M. M.; Bour, J. J.; Vollenbroek, F. A.; Beurskens, P. T. Journal of Crystallographic and Spectroscopic Research 1983, 13, 355-363.
(111) Smits, J. M. M.; Beurskens, P. T.; Bour, J. J.; Vollenbroek, F. A. Journal of Crystallographic and Spectroscopic Research 1983, 13, 365-372.
(112) Smits, J. M. M.; Beurskens, P. T.; Vandervelden, J. W. A.; Bour, J. J. Journal of Crystallographic and Spectroscopic Research 1983, 13, 373-379.
(113) Bellon, P.; Manasser.M; Sansoni, M. J. Chem. Soc.-Dalton Trans. 1973, 2423-2427.
(114) Albano, V. G.; Bellon, P. L.; Ciani, G. J. Chem. Soc.-Dalton Trans. 1972, 1938-&. (115) Albano, V. G.; Bellon, P. L.; Manasser.M; Ciani, G. J. Chem. Soc.-Dalton Trans.
1972, 171-&.
(116) Schaaff, T. G. Anal. Chem. 2004, 76, 6187-6196.
(117) Negishi, Y.; Nobusada, K.; Tsukuda, T. J. Am. Chem. Soc. 2005, 127, 5261-5270. (118) Zhang, H. F.; Stender, M.; Zhang, R.; Wang, C. M.; Li, J.; Wang, L. S. J. Phys.
Chem. B 2004, 108, 12259-12263.
(119) Menard, L. D.; Gao, S. P.; Xu, H. P.; Twesten, R. D.; Harper, A. S.; Song, Y.; Wang, G. L.; Douglas, A. D.; Yang, J. C.; Frenkel, A. I.; Nuzzo, R. G.; Murray, R. W. J. Phys. Chem. B 2006, 110, 12874-12883.
CHAPTER II
ANALYTICAL EVIDENCE FOR THE MONOLAYER PROTECTED CLUSTER Au225[S(CH)2CH3]75
2.1 Introduction
Metal nanoparticles have been of great interest over the past decade, due in part to the entry they offer to the bridge between bulk and molecular behaviour of chemical
materials.1 Nanometer-scale materials present new chemical, electronic, and physical properties, which can be size-dependent,1 and which have been useful in applications including instrumentation improvement,2,3 biological detection,4,5 and catalysis promotion.6,7 When surrounded by self-assembled monolayer shells, the stability of
nanometer-sized clusters can be dramatically improved, thereby increasing the accessibility of chemical experimentation with the clusters. In the case of thiolate monolayer-coated Au cores, such nanoparticles have been dubbed monolayer-protected clusters (MPCs).1
The initial report by Brust et. al8 of the organic-phase synthesis of thiolate monolayer-protected Au MPCs has been followed by growing interest in their exploration. Much literature has been produced on Au MPCs with cores ranging from 11 to 140 Au atoms, but little about relatively “larger” Au cores. It is known that very small metal clusters (with core diameters < ~ 1.6 nm) display molecule-like properties, while relatively larger clusters (with core diameters > ~ 10 nm) demonstrate properties of a bulk sample of the core
Many properties of Au MPCs are quantized, or size-dependent; consequently, gaining knowledge on different core-sized MPCs will be valuable in understanding these
properties. Size-dependent MPC properties particularly appear in electrochemical and optical properties. The latter vary greatly with the size of the Au core;10-18 the absorbance spectra of MPCs with small Au cores (diameter <1.6 nm) exhibit distinct step-like
transitions over ~300 to 500 nm and a weaker band at ~700 nm. These features are lost with increasing size—Au140 cores have nearly featureless spectra, and for larger Au cores, a surface plasmon resonance absorbance peak appears at ~520 nm. This band’s intensity is strongly correlated with the size of the metallic core,9 increasing with core size until the spectrum resembles that of the bulk metal.
Presented here is the synthesis and investigation of hexanethiolate-protected MPCs with 225 Au atom cores. These nanoparticles, like Au140 MPCs, display size-dependent
properties, notably quantized double layer charging in their voltammetry. The behaviour of these MPCs, with core radii of 1.0 nm, thus differs from that of bulk metal. The determination of the size and exploration of the properties of these MPCs are performed using transmittance electron microscopy (TEM), thermal gravimetric analysis (TGA), electrochemical voltammetry, UV/vis absorbance spectrophotometry, and high
performance liquid chromatography with absorbance and electrochemical detection. This report constitutes a more exacting study than our previous, unrefined preparation of
dodecane thiolate-protected MPCs,9 that was modelled as producing a mixture of Au225 and Au314 that displayed no QDL features.
Our laboratory has previously described using high performance liquid chromatography, with columns of stationary phase C8 and phenyl in series, to separate Au MPCs of varying core sizes.22 The MPCs can be detected optically, using a photodiode array (PDA)
Chemicals. Hexanethiol (HSC6, >99%), tetraoctylammonium bromide (Oct4NBr, >98%), sodium borohydride (NaBH4, >98%), and tetrabutylammonium perchlorate (Bu4NClO4, >99%) were used as received from Aldrich, as were toluene (Fisher, reagent grade), acetonitrile (Fisher, Optima), methylene chloride (Fisher, HPLC grade), and ethanol (HPLC grade). HAuCl4·xH2O (from 99.999% pure gold) was synthesized using a
literature procedure34 and stored in a freezer at -20 oC. Water was purified using a Barnstead NANOpure system (18 MO).
Synthesis of MPCs. MPCs were prepared as in previous work.9 Briefly, 3.19 g of HAuCl4·xH2O in 100 mL of deionized water was added to a vigorously stirred solution of 5.20 g of Oct4NBr in 200 mL of toluene. The HAuCl4·xH2O aqueous solution changed from yellow to clear and the toluene solution from clear to orange-brown as the AuCl4- was transferred from the aqueous to the organic phase. A 2-fold molar excess, relative to gold, of hexanethiol (2.29 mL) was added to the isolated organic phase which was then stirred for 20 minutes at room temperature. Reduction to a dark solution was accomplished— while rapidly stirring at 0 oC—by quickly adding 10 mL of an aqueous solution containing 3.8 g of NaBH4. Stirring was continued for 1 hour at 0 oC; the organic phase was then collected and the solvent removed on a rotary evaporator at room temperature. The black product was suspended in 200 mL of ethanol for 2 hours. Using a glass frit, the product was collected and cleaned with 600 mL of ethanol and 200 mL of acetonitrile.
Thermal Analysis. Thermogravimetric analysis (TGA) was performed with a Seiko RTG 220 robotic TGA. The MPC sample of 6 mg was placed in an Al crucible within a Pt crucible. The sample was heated from 30 oC to 600 oC at 15 oC per minute.
onto standard carbon-coated (200-300 Å) Formvar films on copper grids (600 mesh) and dried in air for at least 1 hour before imaging. Phase-contrast images of the particles were obtained using a side-entry Phillips CM12 electron microscope operating at 120 keV. Images were obtained at 580,000 X magnification. Au core diameters were measured using Scion Image Release Beta 3b (1998) software on enlarged TEM image photographs.
Spectroscopy. vis spectra were collected with a Shimadzu Vis (Model UV-1601) spectrometer. MPC solutions in CH2Cl2 were freshly prepared before each measurement.
Electrochemistry. Voltammetry was done with a Bioanalytical Systems, Inc. (BAS) Electrochemical Analyzer, Model 100B, in 0.1 M Bu4NClO4 in CH2Cl2 solutions that were degassed and blanketed with high-purity Ar during the experiment. The working electrode was a 0.4 mm Pt disk, the counter electrode a Pt wire, and the reference electrode a
Ag/AgCl (aqueous) electrode. The working electrode was polished with 0.05 µm Al2O3 slurry and cleaned electrochemically by potential cycling in 0.1 M H2SO4 solution. Cyclic voltammetry was done at 100 mV/s, and Osteryoung square wave voltammetry was done with potential steps of 4 mV, square wave amplitude of 25 mV, square wave frequency of 15 s-1, and quiet time of 2 s.
High-Performance Liquid Chromatography (HPLC). HPLC was performed on CH2Cl2 solutions containing ca. 1.0 mg/mL Au140 and ca. 0.5 mg/mL Au225 using a Waters 600 controller pump and a Rheodyne 7725 injection valve with a 50-µL loop. Two
configuration, performed to test for reproducibility of MPC core size results, was a serial combination of stainless-steel inorganic/organic hybrid particle-bonded XTerra C8
stationary phase column (250 x 4.6 mm i.d.) and a stainless-steel inorganic/organic hybrid particle-bonded XTerra phenyl column (150 x 4.6 mm i.d., Waters Corporation), both with particle sizes of 5 µm and 125 Å pore size. Columns were at room temperature. The mobile phase for both column sets was CH2Cl2 (with 0.1 M Bu4NClO4 as supporting electrolyte for the amperometry) at a flow rate of 0.7 mL/min.
To measure optical absorbance, a Waters 996 PDA detection system was used to display absorbance at 400 nm. For electrochemical detection, a cross-flow LC-44 thin-layer electrochemical cell (Bioanalytical Systems, Inc.) was connected in-line after the Waters HPLC PDA detector. The working electrode was a ~3-mm diameter glassy carbon, the reference electrode was Ag/AgCl (aqueous), and the counter electrode was the stainless steel electrochemical cell body itself. Signals were read by a locally constructed battery-powered potentiostat (UNC chemistry department electronics shop), converted through a Waters A/D converter, and monitored by the same software used to record the PDA chromatograms. Current responses were collected in successive, repeated chromatograms with the detector working electrode set at varying potentials, so as to define, point-by-point, one-electron hydrodynamic voltammetric steps for each eluted nanoparticle peak. 2.3 Results and Discussion
Synthesis and Analytical Characterization of Au225 MPCs. In the original Brust reaction,8 reaction of a 1:1 molar ratio of dodecanethiol and AuCl4- followed by reduction with BH4-, led to dodecanethiolate-protected Au MPCs having core diameters of 1 – 3 nm. The general reaction is
(—AuISR—)N + BH4-à AuX(SR)Y (2)
That initial report has been followed by many others, using different alkanethiols and varied reaction conditions. While the complexity of the Brust reaction still defies a truly detailed understanding, and reaction products are invariably poly-disperse in core size, its importance is in facile production of a range of smaller nanoparticle sizes than other synthetic routes. Factors important in the nanoparticle size(s) produced are9 the
temperature of the reduction step (lower temperature reduces average size), the thiol-to-Au atom ratio (larger ratios reduce average size), and the rate of addition of NaBH4 (faster addition reduces poly-dispersity). The reaction described here using hexanethiolate ligands produces, according to analytical data presented below, MPCs with a Au225 core size using a ligand-to-Au ratio of 2:1, 0 oC reduction reaction temperature, and a fast (~10 s) addition of NaBH4. The ethanol-insoluble reaction product contained the Au225 component. Generally, ethanol-soluble MPCs have smaller cores20 than their ethanol-insoluble counterparts; by collecting the ethanol-insoluble fraction and using a 2:1 thiol:Au reaction—rather than the 3:1 feed favored9 in preparation of Au140 MPCs, a somewhat larger average core size MPC was produced.
Figure 2.1. (a) TEM image of Au225[(S(CH2)5CH3)]75 in CH2Cl2; (b) Size-distribution histogram for several TEM images of Au225[(S(CH2)5CH3)]75 in CH2Cl2 (118 MPCs in total from three different batches synthesized separately); (c) TGA analysis of organic mass lost for a sample of Au225[(S(CH2)5CH3)]75; (d) UV/Vis absorbance spectrum for
0 1 2 3 4 5 6 7 8
1 1.5 2 2.5 3
Count
Diameter (nm)
(a)
Mean(b)
Diameter 2.0 ± 0.4 nm 0 0.05 0.1 0.15 0.2 0.25
250 450 650
λ
(nm)
Ab
s (
AU)
4.9 5.1 5.3 5.5 5.7 5.90 200 400 600
T (oC)
mass (mg)
![Table 2.1. Estimation of Core Size of Au 225 [(S(CH 2 ) 5 CH 3 )] 75 MPCs Using HPLC and Ratio of Optical Absorbance Detector Signal and One-Electron Charging Currents of MPCs in Two Separate Experiments](https://thumb-us.123doks.com/thumbv2/123dok_us/8263793.2189258/66.918.136.768.221.599/estimation-absorbance-detector-electron-charging-currents-separate-experiments.webp)