ENVIRONMENTAL AND GENETIC INFLUENCES ON INFANT CORTICAL THICKNESS AND SURFACE AREA
Shaili C. Jha
A dissertation submitted to the faculty at the University of North Carolina at Chapel Hill in partial fulfillment of the requirements for the degree of Doctor of Philosophy in the
Neuroscience Curriculum in the School of Medicine
Chapel Hill 2017
Approved by:
ABSTRACT
Shaili C Jha: Environmental and Genetic Influences on Infant Cortical Thickness and Surface Area
(Under the direction of Rebecca Knickmeyer)
Genetic and environmental influences on cortical thickness (CT) and surface area (SA) are thought to vary in a complex and dynamic way across the lifespan. It is established that CT and SA are genetically distinct in older children, adolescents, and adults and that heritability estimates vary across cortical regions. At these ages, various environmental factors have also been shown to have unique influences on cortical structure. Very little is known about how genetic and environmental factors determine infant CT and SA. This represents a critical knowledge gap, especially given compelling evidence that neuropsychiatric disorders have their ultimate origin in prenatal and early postnatal development. In this report, we examine the impacts of 17 major demographic and obstetric history variables on inter-individual variation in CT and SA in a unique sample of 805 neonates who received MRI scans of the brain around 2 weeks of age. Additionally, we examine genetic influences on CT and SA variation using a classical twin model in a subset of 376 twin neonates. Our results reveal that birth weight, postnatal age at MRI, gestational age at birth, and sex are significant
To my ba and moti foi, the strongest, most resilient women I know. Your love and courage is the reason I am here today. To my uncles, aunts, and parents, who left everything they knew in order to
provide a better future for their children. You all are my inspiration and strength. To my ninjhas. Thank you for believing in me, making me smile, and keeping me laughing through stressful times.
ACKNOWLEDGEMENTS
First and foremost, I would like to thank my graduate research advisor, Dr. Rebecca Knickmeyer for her enthusiasm, guidance, and commitment to my graduate training. I am also thankful for the mentorship and research expertise of Dr. John Gilmore and Dr. Martin Styner. Thanks also to Dr. Kai Xia and Dr. James Eric Schmitt for their statistical knowledge and tutelage. Additionally, I am grateful to my dissertation committee for their time, knowledge, and invaluable feedback.
Next, I would like to express my gratitude to the many people who helped make my projects a success. Thank you to the members of the Early Brain Development Study for their efforts toward subject recruitment, to the members of the Neuroimaging Research Analysis Laboratory and the Image Display, Enhancement, and Analysis Group for their contributions toward our large-scale image analysis endeavors, and to the many graduate students and postdocs under Dr. Hongtu Zhu who provided statistical assistance. In particular, I would like to acknowledge Joe Blocher, Mark Foster, Emil Cornea, Gang Li, Mihye Ahn, and Ziliang Zhu. Additionally, I would like to thank my fellow graduate students, Jessica Bullins and Veronica Murphy. Thank you both for your friendship, moral support, research advice, and overall kindness. I will greatly miss working with you.
Finally, I would like to thank the Neuroscience Curriculum for its training, and educational resources and the Emerging Leaders in Science and Society program for the professional
PREFACE
Chapter 1 provides a review of the basic processes of prenatal and early postnatal brain development. It also contains an introduction to pediatric MRI and cortical thickness and surface area development. This chapter ends with an outline of the research aims and hypotheses
presented in this report.
Chapter 2 is a research chapter that addresses our first specific aim. It details the environmental influences on neonatal cortical thickness and surface area. This chapter is a manuscript currently under review at Cerebral Cortex.
Chapter 3 is a research chapter that addresses our second specific aim. It details the genetic influences on neonatal cortical thickness and surface area. This chapter is a manuscript in
preparation.
Chapter 4 contains a summary of the key findings, an outline of the major contributions to the field, and potential future directions for follow-up research.
TABLE OF CONTENTS
LIST OF TABLES ...x
LIST OF FIGURES ... xii
LIST OF ABBREVIATIONS ... xiii
CHAPTER 1: INTRODUCTION ...1
PRENATAL AND EARLY POSTNATAL BRAIN DEVELOPMENT ...1
USING MRI TO STUDY BRAIN DEVELOPMENT ...7
CORTICAL THICKNESS AND SURFACE AREA ...8
RATIONALE & SPECIFIC AIMS ...10
CHAPTER 2: ENVIRONMENTAL INFLUENCES ON INFANT CORTICAL THICKNESS AND SURFACE AREA ...15
INTRODUCTION ...15
MATERIALS AND METHODS ...17
RESULTS ...21
DISCUSSION ...24
CHAPTER 3: GENETIC INFLUENCES ON INFANT CORTICAL THICKNESS AND SURFACE AREA ...50
INTRODUCTION ...50
MATERIALS AND METHODS ...52
RESULTS ...56
DISCUSSION ...58
CHAPTER 4: CONCLUSIONS ...89
SUMMARY OF FINDINGS ...89
CONTRIBUTIONS TO THE FIELD ...90
LIST OF TABLES
Table 2.1. Descriptive Statistics for Demographic and Medical History Variables ...31 Table 2.2. Significant Associations with Average CT and Total SA from Selected Models ...32 Table S2.1. Correlation Matrix of Predictor Variables ...38 Table S2.2. Demographic Characteristics of Neonates with Caucasian and
African American Mothers ...39 Table S2.3. Demographic Characteristics of Neonates by Total Household Income ...40 Table S2.4. Bootstrapping Results from Variable Selection ...41 Table S2.5. Significant Associations of Postnatal age at MRI with Cortical
Thickness from Selected Models ...42 Table S2.6. Significant Associations of Gestational Age at Birth with Cortical
Thickness from Selected Models ...43 Table S2.7. Significant Associations of Paternal Education with Cortical
Thickness from Selected Models ...44 Table S2.8. Significant Associations of Maternal Ethnicity with Cortical
Thickness from Selected Models ...45 Table S2.9. Significant Associations of Sex, Gestational Number, and Birth
Weight with Cortical Thickness from Selected Models ...46 Table S2.10. Significant Associations with Surface Area from Selected Models ...47 Table S2.11. Summary of Results from Mixed Effects Models Containing
All Possible Predictors ...48 Table S2.12. Bootstrapping Results from Variable Selection – Without
Adjustments for Global Measures ...49 Table 3.1. Demographics for Neonate Twin Sample ...64 Table 3.2. Co-twin Correlations for MZ and DZ pairs ...65 Table 3.3. Univariate ACE Model Maximum Likelihood Parameter Estimates and
P-values for Global Measures ...67 Table 3.4. Bivariate ACE Model Maximum Likelihood Parameter Estimates and
P-values for Global Measures ...68 Table 3.5. Univariate ACE Model Maximum Likelihood Parameter Estimates and
Table 3.6. Univariate ACE Model Maximum Likelihood Parameter Estimates and P-values for Regional SA Measures ...71 Table S3.1. Univariate ACE Model Maximum Likelihood Parameter Estimates and
P-values for Regional CT Measures Without Adjustments for Brain Size ...73 Table S3.2. Univariate ACE Model Maximum Likelihood Parameter Estimates and
P-values for Regional SA Measures Without Adjustments for Brain Size ...75 Table S3.3. Univariate ACE Model Maximum Likelihood Parameter Estimates and
P-values for Global Measures Controlling for Age, Sex, Brain Size, and T2 Type ...77 Table S3.4. Bivariate ACE Model Maximum Likelihood Parameter Estimates and
P-values for Global Measures Controlling for Age, Sex, Brain Size, and T2 Type ...78 Table S3.5 Univariate ACE Model Maximum Likelihood Parameter Estimates and
P-values for Regional CT Measures Controlling for Age, Sex, Brain Size, and T2 Type ...79 Table S3.6. Univariate ACE Model Maximum Likelihood Parameter Estimates and
LIST OF FIGURES
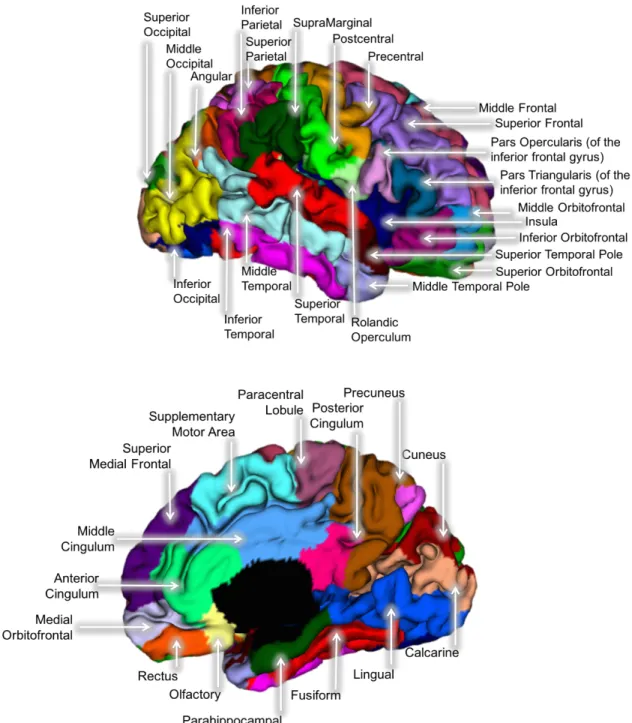
Figure 2.1. The 78 cortical regions of interest from the AAL atlas projected
onto a representative neonatal brain ...33
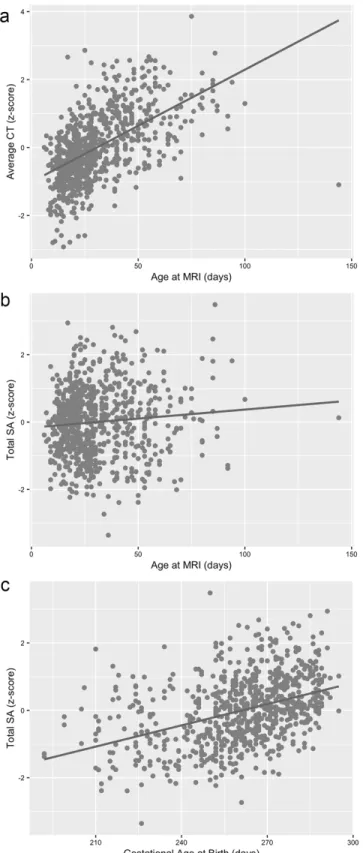
Figure 2.2. Age at MRI plotted against average CT (a), age at MRI plotted against total SA (b), and gestational age at birth plotted against total SA (c) for all individual subjects. ...34
Figure 2.3. Significant associations between regional CT and postnatal age at MRI and gestational age at birth ...35
Figure 2.4. Significant associations between regional CT and paternal education ...36
Figure 2.5. Significant associations between regional CT and maternal ethnicity ...37
Figure S3.1. Genetic Correlation Matrix of Regional CT Measures ...83
Figure S3.2. Genetic Correlation Matrix of Regional SA Measures ...84
Figure S3.3. Genetic Correlation Matrix of Regional CT Measures Without Adjustments for Brain Size ...85
Figure S3.4. Genetic Correlation Matrix of Regional SA Measures Without Adjustments for Brain Size ...86
Figure S3.5. Genetic Correlation Matrix of Regional CT Measures Controlling For Age, Sex, Brain Size, and T2 Type ...87
LIST OF ABBREVIATIONS
ASD Autism Spectrum Disorders CSF Cerebrospinal Fluid
CT Cortical Thickness
DZ Dizygotic
GM Gray Matter GW Gestational Week
GWAS Genome Wide Association Study ICV Intracranial Volume
MRI Magnetic Resonance Imaging
MZ Monozygotic
SA Surface Area
CHAPTER 1: INTRODUCTION
PRENATAL AND EARLY POSTNATAL BRAIN DEVELOPMENT
Embryonic development
The formation of the nervous system begins early in development, approximately 2 to 3 weeks post-conception, and continues well into adolescence.During the first gestational month, complex cascades of molecular signaling and gene-gene interactions initiate the processes of gastrulation and neurulation. During gastrulation, undifferentiated embryonic tissue become specialized into different stem cell lines, including neuroepithelial cells which serve as the precursors for all future neurons and glia. Through the process of neurulation, the first
discernable structure of the nervous system, the neural tube, is formed (Stiles 2008). By the end of these fundamental developmental processes, the neural tube elaborates into the
prosencephalon, mesencephalon, and rhombencephalon which eventually form the forebrain, midbrain, and hindbrain (Dudok et al. 2017) and the primary spatial organization of the brain and spinal cord is established. In the remaining embryonic period and continuing into the fetal
period, there are increases in the size and complexity of the brain driven by cellular processes controlling the proliferation of neuronal progenitor cells, and the production, migration, and differentiation of neurons (Stiles and Jernigan 2010).
Neurogenesis, migration, and differentiation
cells. Proliferation of neuroepithelial cells occurs within the ventricular zone (VZ) and is mediated by genes regulating cell cycle progression. Those controlling gap junctions, cell cycle length, cell cycle exit, and pro- and anti-apoptotic mechanisms that contribute to overall cortical size are particularly important(Sun and Hevner 2014). This period of self-renewing divisions exponentially expands the pool of precursor cells, generating a large population of founder cells. Disruptions in neuroepithelial expansion have effects on both lateral and radial expansion of the cortex and can impact overall cortical size. Examples of aberrant development include
microcephaly, which results in a reduction in brain size and macrocephaly which is characterized by an increase in brain size (Homem et al. 2015).
After the period of symmetrical division is complete, neuroepithelial progenitors transition into radial glial cells, which maintain the properties of stem cells, and begin the production of cortical neurons. During this time, an additional proliferative zone, the subventricular zone (SVZ), emerges above the VZ and expands rapidly during fetal
development. Neurogenesis in these proliferative regions is primarily driven by asymmetric cell divisions of radial glial cells. These divisions produce a radial glial progenitor cell which reenters the mitotic cell cycle and a daughter cell that is an intermediate progenitor, transient amplifying progenitor, subapical progenitor, or a basal radial glial cell(Jiang and Nardelli 2016). These populations of cells represent a diverse number of progenitor cell types capable of
progenitor cells that provide intrinsic signaling through proteins like Notch and Numb to influence neuron fate (Taverna et al. 2014).
During prenatal corticogenesis, there are approximately 3.89 million neurons generated per hour. Rapid rates of neurogenesis are balanced by events of programmed cell death which begin as early as gestational week (GW) 7 (Stiles et al. 2015). The final pool of neurons at the end of neurogenesis is determined by the original pool of neuroepithelial cells, the switch from symmetrical to asymmetrical cell division, the duration of neurogenesis, and the balancing rates of cell death(Jiang and Nardelli 2016). Processes of symmetrical and asymmetrical cell division and resulting pools of progenitor cells and neurons play a crucial role in the ultimate tangential and radial organization of the cortex. These events are likely important determinants of the cortical structure and will be discussed in more detail in the chapters that follow.
Overall, rates of migration peak between GW 13 and 21 (de Graaf-Peters and Hadders-Algra 2006) and result in the formation of a six-layer structure organized in an “inside-out” pattern. Specifically, early migrating neurons are located in deeper cortical layers and are predominantly neurons that project to subcortical areas such as the thalamus, brain stem, and spinal cord. Late-migrating neurons are positioned in subsequent outer cortical layers. These more superficial layers are composed of intracortical neurons that largely project locally within the cortex(Thomson and Lamy 2007; Cooper 2008). After corticogenesis and migration, graded signaling of transcriptional factors helps determine the proper radial and tangential position of neurons within the cortex(Sansom and Livesey 2009). Intrinsic and extrinsic cellular cues guide the differentiation of neurons resulting in subtypes that have unique cellular, chemical,
morphological, and anatomical properties (Stiles 2008).
Synaptogenesis
After migration and differentiation are complete, neurons begin to integrate into the cortex as functional units capable of sending and receiving inputs. This process involves the development of axons and dendrites, the construction of pre- and postsynaptic machinery, and the formation of functional synapses. Attractive and repulsive chemical cues guide the
development and fasciculation of axons. These include classical morphogens like Shh and Wnt, cell-adhesion molecules, and extracellular matrix molecules that together, provide both short and long-range cues that help axons reach their appropriate targets (Jiang and Nardelli 2016).
Through the specialization of presynaptic axon terminals and postsynaptic membranes, functional synapses capable of transmitting electrical and chemical signals are formed.
dendrite growth during the 3rd trimester with high rates continuing into the 1st year of life. Within the first 6 months, there is tremendous elaboration of dendritic branches and increases in axonal length (Nimchinsky et al. 2002; de Graaf-Peters and Hadders-Algra 2006). In parallel, beginning at GW 23 (Markant and Thomas 2013) there is rapid generation of synapses that peaks within the first years of life, continuing well into postnatal development (Huttenlocher and Dabholkar 1997). Synaptogenesis is also a regionally heterogeneous process, with rapid increases in synaptic density observed first in the primary visual and auditory systems and much later in association areas like the frontal cortex. After peak rates of synaptogenesis, there is an
overproduction of synapses during early postnatal life that is offset by mechanisms of synaptic elimination (Stiles 2008). By adolescence, nearly 50% of the synapses formed during infancy are pruned. These regressive processes ensure correct, efficient and refined connections within the cortex and are heavily influenced by environmental cues (Jiang and Nardelli 2016).
Gyrification
The rapid growth and elaboration of the cortex described in the previous sections is coupled with large-scale transformations in cortical morphology that begin around GW 23 (Budday et al. 2015) and result in the formation of a convoluted brain. Cortical folding enables the mammalian brain to expand and grow despite the constraints of the skull. The development of cortical convolutions begins with the emergence of the longitudinal fissure, which separates the left and right hemispheres. After that, primary sulci are formed between GW 14 to 26, secondary sulci are formed 30 to 35 weeks and tertiary sulci arise at 36 weeks and continue into postnatal development (Stiles and Jernigan 2010).
the cortex to fold (Striedter et al. 2015). Other theories suggest that differential rates of
intermediate and basal radial progenitor proliferation in the SVZ and rapid tangential expansion of the outer layers of cortex contribute to the development of gyri (Sun and Hevner 2014). The most popular theory of gyrification suggests that axonal tension between cortical areas generates a tangential force that causes the cortical sheet to fold (Van Essen 1997). Because there is no concrete model of cortical folding that is agreed upon (Striedter et al. 2015), the many genes involved are still under investigation. With that said, genes and molecular pathways essential in proliferation, migration and axonal growth are likely important. Moreover, genetic defects in
LIS1 and DCX genes are known to affect gyral development, resulting in lissencephaly, a cortical malformation and neurodevelopmental disorder characterized by a smooth, disorganized, and thickened cortex (Lian 2006).
Glial Development
While this chapter is largely focused on the overall development of cortical neurons, glial development is essential to proper neuronal function. After neurogenesis is complete,
pro-neuronal factors are downregulated, and pro-glial transcription factors initiate the generation of glia from radial glial progenitors(Jiang and Nardelli 2016). Gliogenesis begins around mid-gestation, extends into postnatal life, and results in the formation of a diverse population of micro and macroglia including astrocytes and oligodendrocytes (Budday et al. 2015). Astrocytes serve a key role in the formation and maintenance of synapses. Oligodendrocytes play a pivotal role in neuronal signaling by myelinating axonal fibers and ensuring efficient transmission of electrical signals (Stiles et al. 2015). The myelination of fiber bundles begins in the third
postnatal years (Qiu, Mori, et al. 2015). The process of myelination gives rise to the white matter of the brain observed in neuroimaging studies.
USING MRI TO STUDY BRAIN DEVELOPMENT
The use of in vivo brain imaging, specifically MRI, has led to a tremendous increase in our understanding of brain development at both structural and functional levels. MRI provides a safe, noninvasive, and standardized approach to measuring brain changes across the lifespan. During infancy, collecting neuroimaging data poses fundamental limitations related to the newborn’s ability to remain asleep and still in a novel and noisy scanning environment (Luby 2017). Analyzing neuroimaging data during this period also presents unique challenges which include low contrast to noise ratio, intensity inhomogeneity across tissue types, smaller
anatomical structures, and rapidly changing tissue contrasts (Gilmore et al. 2004; Prastawa et al. 2005). Despite these limitations, collaborative efforts between neuroscientists, radiologists, and computer scientists in the last two decades have led to the formation and refinement of infant- specific scanning protocols and image analysis tools that have provided researchers with an unprecedented window into the developing brain.
and surface area. These morphometric features are the focus of this report and will be discussed in more detail below.
CORTICAL THICKNESS AND SURFACE AREA
Cortical thickness and surface area are thought to be independent dimensions of cortical volume, driven by distinct genetic and evolutionary factors (Raznahan et al. 2011). Between rodents and primates there is a 2-fold increase in CT and an incredible 1,000-fold increase in SA (Rakic 2009). According to the radial unit hypothesis, this enormous enlargement of the cortical surface occurs early in the embryonic period and is driven by an increase in proliferative
With the use of pediatric MR imaging, both CT and SA measures can be separately examined postnatally to better understand their developmental origins and growth patterns. A recent longitudinal study of healthy twins and singletons examined both global and regional trajectories of CT and SA in the first two years of life and found distinct patterns of development for each measure. Specifically, CT increased 36% and total SA increased an extraordinary 114% on average (Lyall et al. 2015), indicating that SA expansion is the primary driver of volumetric increases in GM. Interestingly, by age 2, CT measures reached 97% of adult values while SA measures reach about 69%. In the same subset of infants, cortical folding patterns were found to be conserved from birth to age 2, revealing major sulci and gyri are well developed and present by term birth (Hill et al. 2010; Li et al. 2013). After birth, increased gyrification of the cortex is largely driven by changes in association regions with increases of 16.1% in the first year and 6,6% in the second year of life (Li, Wang, et al. 2014). Studies of CT and SA (Li, Lin, et al. 2015; Lyall et al. 2015) during early brain development also show heterogeneous patterns of growth across the cortex. Specifically, sensory and motor regions are shown to mature earlier during development compared to regions involved with higher-order integrative functions. Overall, results from these studies capture extremely rapid expansion and growth of the cortex during early postnatal development, likely driven by dendritic development, synaptogenesis, and, gliogenesis, as well as complex patterns of cortical connectivity and cortical folding (Stiles 2008). By comparison, annual growth rates during middle and late childhood reach maximum values of only 0.005% and 0.015% for CT and SA respectively (Raznahan et al. 2011).
environmental disruptions and are linked to risk for psychopathology. Specifically, preliminary studies of CT and SA in infants at high risk for schizophrenia suggest that CT development is altered in female neonates (Li et al. 2016). Abnormalities in SA are also observed in individuals at risk for autism spectrum disorders (ASD) in the first year of life (Hazlett et al. 2017). These studies demonstrate that the foundation of many psychiatric conditions is rooted in disturbances of early typical brain development and can be observed at structural levels through cortical phenotypes like CT and SA.
RATIONALE & SPECIFIC AIMS
As we review in this chapter, the prenatal and early postnatal periods represent a
foundational phase of human brain development. During early life, tightly regulated patterns of gene expression and pre- and postnatal environmental influences shape the structure and function of the nervous system (Kandel 2013). The fetal period is characterized by strong temporal
gradients of protein-coding genes that weaken during infancy, childhood, and adolescence (Kang et al. 2011) and by robust regional differences in gene expression that are replaced by global similarities in expression during infancy and early childhood (Pletikos et al. 2014; Silbereis et al. 2016). At the structural level, the prenatal and early postnatal period is characterized by rapid micro and macrostructural growth that result in large volumetric and morphometric changes (Knickmeyer et al. 2008; Stiles and Jernigan 2010; Gilmore et al. 2012; Lyall et al. 2015).
gray matter volumes(Xia et al. 2017). Recently, a population neuroscience study from our group revealed gestational age at MRI, gestational age at birth, sex, and birth weight as significant obstetric predictors of global and regional gray matter volumes (Knickmeyer et al. 2016).
The important next step is to establish which morphometric feature of gray matter volume (cortical thickness (CT) or surface area (SA)) reflect these environmental and genetic relationships. Previous studies have shown CT and SA to be genetically, evolutionarily, and phenotypically distinct. CT is thought to be driven by the number of neurons arranged in vertical proliferative columns while SA is determined by the number of columns present in the
developing cortex (Rakic 1995; 2009). While our understanding of CT and SA development is expanding, very little is known about the underlying genetic and environmental influences during the early postnatal period. Given that the foundation of many psychiatric conditions is rooted in disturbances of early brain development (Wolff and Piven 2014; Birnbaum et al. 2015), it is vital to address the genetic and environmental factors that control variation in phenotypes such as cortical thickness and surface area during these largely understudied time points.
The objective of this research was to investigate the environmental and genetic determinants of neonatal cortical thickness and surface area. This objective was achieved by pursuing the aims highlighted below. Overall, by examining how genetic and environmental influences contribute to individual differences in CT and SA during a time point of rapid cortical growth and heightened developmental vulnerability, we will better understand how genes and prenatal factors influence brain structure and ultimately contribute to pathological abnormalities.
Aim 1/Chapter 2: Investigate the influence of major demographic and obstetric history variables on cortical thickness and surface area development during infancy
‘envirome’ encompasses an almost infinite variety of exposures and experiences (Anthony 2001). Within this vast search space, prenatal and early postnatal environmental influences are likely to be particularly important. For example, subtle variations in birth weight exert robust influences on IQ and surface area well into adolescence (Raznahan et al. 2012). Similarly, effects of preterm birth show long-lasting influences on cortical thickness (Lax et al. 2013) and surface area (Zhang et al. 2015) during childhood. While these studies provide crucial insights into the persistent effects of prenatal influences on childhood and adolescent brain outcomes, they cannot address age-specific effects at birth. With comprehensive medical histories and well-established pediatric imaging protocols, we can assess the neurodevelopmental consequences of normative differences in birth weight, gestational age at birth and many other prenatal and postnatal environmental outcomes within the early postnatal period.
In a previous study of demographic, obstetric, and socioeconomic variables, we found that gestational age at MRI, gestational age at birth, sex, and birthweight were the most significant predictors of infant brain volumes, explaining 31% to 59% of the overall variance (Knickmeyer et al. 2016). How these factors influence cortical structure measures like CT and SA has not yet been studied. Thus, we examined the impact of 17 major demographic and obstetric history variables on inter-individual variation in CT and SA in a unique sample of 805 neonates who received MRI scans of the brain around 2 weeks of age. Given the unique
greater extent than CT.The relationships we reveal may help explain individual variation in cognitive ability and risk for psychiatric and neurological disorders, all of which show associations with CT and SA.
Aim 2/Chapter 3: Determine genetic contributions to cortical thickness and surface area in infancy using a classical twin model and identify regions with shared genetic architecture
Genetic contributions to typical and atypical brain development have been studied
through candidate gene approaches, genome-wide association studies (GWAS) and classical twin and family designs. The classical twin design compares the similarity of monozygotic (MZ) and dizygotic (DZ) twins to estimate the proportion of phenotypic variance attributable to genetics versus shared and unique environments.Thus far, these approaches have been applied primarily in school age children, adolescents and adults. During this age range, observed genetic effects may be confounded or obscured by years of gene-environment interactions, medication use, or other factors associated with disease risk such as alcoholism, drug abuse, and social stress. It is, therefore, necessary to perform imaging genetic studies at earlier time points in order to better assess genetic effects.
Cross-ROI genetic correlations were also calculated in order to determine which cortical regions are genetically similar. Based on previous studies, we hypothesized that higher heritability estimates would be observed for SA compared to CT and for global CT and SA compared to regional CT and SA. Results from this analysis will reveal how genetically similar or unique cortical measures are during a time of heightened and dynamic CT and SA growth.
The research presented in this report is the first twin study of CT and SA during infancy. Our study is also the first to investigate a wide range of important environmental contributions to CT and SA. Our results will fill a critical gap in the understanding of normal brain development and the environmental and genetic influences on CT and SA. Specifically, we will be able to address how genes influence both CT and SA measures, how these changes regionally, and how they are correlated. Additionally, our work will provide much needed insight into how infant CT and SA differences may be driven by environmental, genetic and developmental factors.
CHAPTER 2: ENVIRONMENTAL INFLUENCES ON INFANT CORTICAL THICKNESS AND SURFACE AREA
INTRODUCTION
Cortical thickness (CT) and surface area (SA) are two independent components of cortical volume most commonly studied using structural MRI. Although both measures change dynamically across the lifespan (Storsve et al. 2014; Lyall et al. 2015; Remer, Croteau-Chonka, Dean, D'Arpino, Dirks, Whiley, and Deoni 2017; Tamnes et al. 2017) recent research suggests that early-life events, especially those occurring in the pre- or perinatal period, have pervasive and long-lasting effects (Raznahan et al. 2012; Walhovd et al. 2012; Walhovd, Krogsrud, et al. 2016). Pre- and perinatal events may be especially important for atypical development as small differences early in life can have cascading effects on later outcomes (Karmiloff-Smith 1998; Masten and Cicchetti 2010). Notably, many neuropsychiatric disorders are characterized by altered global and/or regional CT and SA including schizophrenia and bipolar disorder (Rimol et al. 2012), autism (Ohta et al. 2016; Yang et al. 2016), and attention deficit hyperactivity disorder (Silk et al. 2016).
Current theories of cortical development also point to the prenatal period as a
foundational period in the emergence of individual differences in CT and SA. According to the radial unit hypothesis, differences in global and regional surface area are driven by the number of cortical columns generated during the early embryonic period, while differences in CT are
and perinatal periods (Rakic 1995; 2009). More recently, a supragranular layer expansion
hypothesis has been proposed which posits that outer radial glial cells play a critical role in radial and tangential expansion of supragranular layers in primates with potential implications for individual differences in CT and SA (Nowakowski et al. 2016). Throughout the prenatal and early postnatal developmental window, these processes are influenced by tightly regulated patterns of gene expression and environmental signals (Kandel 2013). How these factors influence individual variation in early CT and SA is not well understood.
In this chapter, we report the first large scale neuroimaging study of environmental influences on CT and SA during infancy. Our aim was to understand how 17 major demographic and medical history variables affect neonatal CT and SA. Studying infants allows us to
environmental influences on neonatal CT and SA represents a fundamental step in developing public health interventions to optimize early cortical development and reduce risk for later mental illness.
MATERIALS AND METHODS
Subjects
Our study included 805 neonates (434 twins, 371 singletons; 429 males, 376 females) between the ages of 6 and 144 days post birth, drawn from two prospective longitudinal studies of early brain development being carried out at the University of North Carolina (UNC) at Chapel Hill (Gilmore, Kang, et al. 2010; Gilmore, Schmitt, et al. 2010; Gilmore et al. 2012). Pregnant mothers were recruited from outpatient obstetrics and gynecology clinics in central North Carolina. Women with major medical illnesses or abnormal fetal ultrasounds were excluded at enrollment. Maternal reports were used to determine parental demographic
information such as maternal age, paternal age, maternal education, paternal education, paternal ethnicity, maternal ethnicity, total household income, maternal psychiatric history, and paternal psychiatric history. Psychiatric history variables were also determined using medical record review. Both maternal and paternal psychiatric history were categorized and binarized such that individuals were considered positive for psychiatric history if they reported a diagnosis in any of the following DSM-V categories, or if medical record review indicated such a diagnosis:
age at birth, 5 minute APGAR scores, stay in neonatal intensive care unit over 24 hours, gestation number, and delivery method. Detailed demographic information can be viewed in Table 2.1. After complete description of the study to subjects’ parent(s), written informed consent was obtained. Study protocols were approved by the Institutional Review Board of the UNC School of Medicine.
Image Acquisition
significant influence on both cortical thickness and surface area and therefore included T2 sequence name (Type1-Type4) as a covariate in all of the analyses described in this study. Image Analysis
Cortical thickness and surface area measures were derived for all subjects using a pipeline previously described by Li et al (2016). All MR images were preprocessed for tissue segmentation using a standard infant-specific pipeline (Li et al. 2013). Specific steps included skull stripping and manual editing of non-brain tissue, removal of the cerebellum and brain stem, corrections for intensity inhomogeneity, and rigid alignment of T2-weighted images into an average atlas space (Shi et al. 2011). Gray matter (GM), white matter (WM), and cerebrospinal fluid (CSF) were segmented by applying a standalone infant-specific patch driven coupled level sets method (Wang et al. 2014). Non-cortical regions were masked and tissues were divided into the left and right hemisphere. A deformable surface method (Li et al. 2012; Li, Nie, et al. 2014) was applied to the tissue segmentation in order to reconstruct the inner, middle, and outer cortical surfaces. This method involved a topological correction of WM volume to ensure spherical topology, a tessellation of the corrected WM to generate a triangular mesh, and the deformation of the inner mesh towards the reconstruction of each cortical surface while preserving the initial topology. All inner, middle, and outer surfaces for the left and right hemisphere were visually examined for accurate mapping.
was computed based on the central cortical surface. The cortical surface was parcellated into 78 regions of interest based on an infant-specific 90 region parcellation atlas (Tzourio-Mazoyer et al. 2002; Gilmore et al. 2012) as shown in in Figure 2.1. Twelve regions represent subcortical structures and were therefore not examined. The average CT and total SA were calculated for each ROI based on corresponding values at each vertex.
Statistical Analysis
Parental demographic and medical history variables included maternal age, paternal age, maternal education, paternal education, maternal ethnicity, paternal ethnicity, maternal
psychiatric history, paternal psychiatric history, total household income, and maternal smoking during pregnancy. Infant demographic variables included sex, birth weight, gestational age at birth, postnatal age at MRI, 5 min APGAR scores, stay in neonatal intensive care unit over 24 hours, gestation number, and delivery method. See Table S2.1 for a correlation matrix of predictor variables (continuous and binary). See Table S2.2 for a comparison of demographic variables between Caucasian and African American subjects. See Table S2.3 for a comparison of demographic variables by income. To examine the effects of these variables on individual
white matter and cerebrospinal fluid) was fixed in the model selection for average and regional cortical thickness. As a sensitivity analysis, model selections were also run without adjusting for overall brain size.
After variable selection, linear mixed effects models were run using the selected variables for each region independently. These selected models were used to perform significance testing and to generate effect sizes and r2 values. Mixed effects models were also run including all variables for comparison. To account for familial relatedness within monozygotic (MZ) and dizygotic (DZ) twins, we used a standard ACE model described in Xia et al. (2014), which includes additive genetic effects (A), common environmental effects (C) and random
environmental effects (E). For all regional analyses, adjustments for multiple comparisons were made using Benjamini & Hochberg method. FDR <0.05 was considered significant for each region of interest.
RESULTS
Average CT
Regional CT
Postnatal age at MRI, gestational age at birth, maternal ethnicity, and paternal education emerged as significant predictors of regional CT in at least 10% of regions examined (Table S2.4). Postnatal age at MRI showed positive associations with regional CT (Figure 2.3, Table S2.5). Specifically, older babies had thicker cortices in the pre- and postcentral gyri, right supplementary motor area, right middle cingulate gyrus, insula, and portions of the lateral frontal, occipital, and parietal lobes. Gestational age at birth showed negative associations with regional CT (Figure 2.3, Table S2.6). Earlier born babies had thicker cortices in the medial and lateral frontal lobe, superior and middle temporal poles, right hippocampal gyrus, and postcentral gyrus. Paternal education also showed a negative association with regional CT (Figure 2.4, Table S2.7). Higher paternal education was associated with thinner cortices in superior frontal, middle frontal, and middle orbital frontal gyri as well as in the right inferior frontal pars triangularis, right medial superior frontal gyrus, right olfactory region, and right middle temporal gyrus.
to offspring of Caucasian mothers, offspring of Native American mothers had thicker cortices in the precuneus, left postcentral gyrus, right rolandic operculum, right supramarginal gyrus, right supplementary motor area, and right insula, and thinner cortices in the right precentral and postcentral gyri, superior parietal lobule, right inferior parietal lobule, and right supramarginal gyrus. Sex, birth weight and gestational number were also significant predictors of average CT in a small number of cortical regions. These results can found in Table S2.9.
Total SA
Birth weight, gestational age at birth, postnatal age at MRI, and sex emerged as the most significant predictors of total surface area (Table 2.2). Birth weight showed a strong positive association with total SA. For every 500g increase in birth weight, there was a 3.6% increase in overall cortical SA. Gestational age at birth and postnatal age at MRI also showed strong positive associations with total SA (Figure 2.2b-c). Total surface area increased 0.35% for every
additional day in the womb and 0.51% for every postnatal day. Additionally, sex was a
significant predictor of total SA, with males having 3.9% larger cortical surfaces than females. Regional SA
We found postnatal age at MRI, birth weight, paternal ethnicity, maternal ethnicity, sex and gestational age at birth to be significant predictors of regional SA in a small number of ROIs. These results can found in Table S2.10.
The following were not significant predictors of neonatal CT and SA at either the global or regional level: Apgar scores at 5 minutes, delivery method, maternal education, total
included birth weight and maternal ethnicity, which did not emerge as significant predictors of regional CT in the full mixed models. Additionally, gestational age at birth, sex, and birth weight were significant predictors of regional SA in the full model but did not appear in the adaptive lasso.
Secondary Analyses
In a secondary analysis, model selection was performed without adjusting for overall brain size. For regional CT, significant predictors were similar to those in the primary analysis. For regional SA, we identified postnatal age at MRI, gestational age at birth, birth weight, gestation number, and sex as significant predictors in widespread regions of the cortex (Table S2.12).
DISCUSSION
To our knowledge, this study is the first to examine environmental influences on cortical thickness and surface area in a large normative sample of neonates. Our findings build on our previous work examining the influences of obstetric, demographic, and socioeconomic factors on neonatal brain volumes (Knickmeyer et al. 2016) and provide a more refined account of how these factors impact early cortical development.
We found that the cortical surface expanded 0.51% and cortical thickness increased 0.09% daily between the ages of 6 and 144 days post birth. These results capture extremely rapid expansion and growth of the cortex during early postnatal development, likely driven by
heterogeneous, with primary visual, motor, and auditory regions representing some of the fastest growing cortices after birth. This is consistent with longitudinal studies of CT, SA, (Li, Lin, et al. 2015; Lyall et al. 2015) and cortical volume during early brain development (Gilmore et al. 2012) that also show heterogeneous patterns of growth across the cortex. Specifically, sensory and motor regions are shown to mature earlier during development compared to regions involved with higher-order integrative functions. Similar hierarchical organization is observed in older children and adolescents, with sensory and motor regions reaching their peak thickness values earlier than association cortices (Sowell et al. 2004; Shaw et al. 2008). While our results were in line with these reports, faster growing cortices also included association regions within
orbitofrontal and prestriate cortex. This suggests there are complex patterns of CT growth after birth in both primary sensory and association regions. Given minimal regional differences in gene expression during infancy (Pletikos et al. 2014), heterogeneous patterns of CT growth observed in our sample may reflect post-transcriptional processes and activity-dependent mechanisms sensitive to environmental input. Interestingly, we observed nominal regional heterogeneity in surface area growth during this time period.
We found that gestational age at birth had opposing effects on surface area and cortical thickness (positive and negative associations respectively). In keeping with published studies showing reduced cortical SA during infancy (Engelhardt et al. 2015) and childhood (Lax et al. 2013; Rogers et al. 2014; Zhang et al. 2015) in infants born preterm, total SA was larger in later born babies. During the late fetal stage, there is rapid growth in brain size driven by the
accelerated development of cortical surface area relative to cortical volume (Kapellou et al. 2006). This is likely influenced by the development of sulci, gyri, and cortico-cortical
that are not technically premature ( > 37 weeks). In contrast to SA, later born babies had thinner cortices in widespread regions of the frontal lobe as well as the postcentral gyrus, precuneus, and the temporal poles. This finding suggests that exposure to the postnatal environment in earlier born babies may alter the growth of the cortical mantle in these regions. Compared to the
intrauterine environment, the extra-uterine environment is rich in sensory information and could promote synaptogenesis and complex dendritic morphology, leading to the accelerated growth of the cortex. Alternatively, thicker cortices in earlier born babies may reflect cortical overgrowth resulting from disrupted apoptotic mechanisms which normally take place late in gestation. Thicker cortices in earlier born babies compared to later born babies may also reflect a lack of maturation of the underlying white matter (Keunen et al. 2016) which would influence tissue classification during automated MRI segmentation protocols. The intrauterine environment is critical for the organization of axonal pathways and the processes of premyelination and
myelination that begin during the second half of pregnancy and are likely interrupted as a result of preterm birth (Qiu, Mori, et al. 2015). Additional studies assessing white matter
microstructure and myelination would help clarify the biological mechanisms underlying these findings.
genetically independent (Jansen et al. 2015), and with current theories of prenatal cortical development. In particular, the radial unit hypothesis (Rakic 2009) suggests that the number of cortical minicolumns determines the size of the cortical surface and that the number of
minicolumns depends on the rate of cell proliferation and/or programmed cell death within symmetrically-dividing radial glial cells of the ventricular zone (VZ). Differences in CT are ascribed to changes in proliferation kinetics of asymmetrically dividing neural progenitor cells, as well as to changes in the size of neurons and the amount of tissue situated between neuronal cell bodies, which is itself composed of neuronal and glial processes including dendrites, dendritic spines, axon terminals and synapses (Rakic 1995; 2009). Additionally, the recently proposed supragranular layer expansion hypothesis suggests that at mid-neurogenesis, radial glial scaffolds become discontinuous (Nowakowski et al. 2016). During this discontinuous phase, self-renewing divisions of oRG cells increase the surface area of supragranular layers, while neurogenic divisions of oRG cells increase the thickness of these layers.
Our findings regarding birth weight and sex are similar to studies in older children and adults, which reveal males and heavier born babies have larger surface area but not cortical thickness (Raznahan et al. 2011; 2012; Walhovd et al. 2012; Wierenga et al. 2014; Walhovd, Fjell, et al. 2016). Our results indicate that these relationships are established during prenatal brain development and remains stable throughout childhood and into adulthood, confirming the importance of prenatal factors during early development. Keeping the above
neurodevelopmental hypotheses in mind, the positive association of birth weight with SA may reflect the influence of genetic potential for growth, maternal nutrition and metabolism,
development of corticocortical connectivity. Larger total SA in males may reflect the influence of gonadal steroids on these same processes. It is notable that testosterone secretion in male fetuses is highest between weeks 14 and 18 (Prince 2001), encompassing the latter portion of the continuous scaffold stage and the early portions of the discontinuous scaffold stage.
The association between paternal education and CT may reflect the father's ability to provide psychosocial resources during pregnancy and the early postpartum period, support healthy maternal behaviors, reduce stress, and provide greater cognitive stimulation in the home (Blumenshine et al. 2011; Shapiro et al. 2016). All of these factors may influence asymmetrically dividing neural progenitor cells, neurogenic divisions of oRG cells, synaptogenesis, and the formation/elaboration of neuronal and glial processes during development. Alternatively, associations between neonatal CT and paternal education could be driven by genetic influences. Given the rapid rates of CT growth observed in our study, it is somewhat surprising that this association is negative such that infants of more educated fathers have thinner cortices, especially in the frontal lobes. With that said, our findings are in keeping with previous work showing negative correlations between CT and intelligence during early childhood (Shaw et al. 2006). These findings have led to the hypothesis that children with higher IQs have more prolonged maturation of higher order regions. Thus, we hypothesize that infants born to more educated fathers may experience a slower, more extended developmental window of the frontal lobe that may be advantageous to later cognitive outcomes. It is also possible that thinner cortices in offspring of highly educated fathers reflect changes in image contrast caused by the myelination of underlying white matter (Sowell et al. 2004). Notably, environmental enrichment and social interactions promote oligodendrocyte lineage development and myelination
education is associated with larger overall white matter volume in neonates (Knickmeyer et al. 2016).
We observed that offspring of African American mothers had thicker cortices in parietal regions involved in somatosensory processes and sensory integration compared to offspring of Caucasian mothers. However, we note that these associations were not significant in the full mixed effects models. Associations between maternal ethnicity and CT may reflect genetic differences and/or the influences of environmental factors associated with the sociocultural construct of race/ethnicity on the cellular processes described above. Additional studies are needed to determine whether these associations are robust and if they are temporary or represent persistent alterations with functional consequences. Furthermore, to effectively develop
interventions aimed at optimizing infant brain development, future studies must delineate
specific mechanisms underlying these associations. Specific variables that may be of importance include psychosocial stress, exposure to environmental pollutants, and reduced access
to/utilization of prenatal care, which may be more common among racial and ethnic minorities (Grobman et al. 2016; Lorch and Enlow 2016). These variables were not assessed in the current study, but when comparing infants of Caucasian and African American (AA) mothers, we did observe significant differences in birth weight, maternal and paternal education, and maternal age (all lower in AA), in NICU stay greater than 24 hours, maternal psychiatric history, and maternal smoking (all more common in AA), and in paternal psychiatric history (less common in AA).
and SA. In some cases, this may reflect high correlations between predictor variables (e.g. between paternal and maternal education). In such a situation, the moment-based method selects the best predictive variable. With specific regard to psychiatric history, the lack of associations may reflect the fact that our psychiatric history variables include multiple disorders with depression being the most common. Previous work by our group has shown that a maternal history of severe mental illness (specifically schizophrenia) does influence brain development (Gilmore, Kang, et al. 2010).
In conclusion, CT and SA both exhibit rapid growth during the first postnatal month but show distinct relationships with environmental factors. Gestational age at birth is positively associated with SA, but negatively associated with CT. Birth weight and sex influence SA, potentially through cellular processes active during early pregnancy and midgestation, while maternal ethnicity and paternal education influence CT, possibly through cellular processes active in the perinatal period. Strengths of this study include the use of detailed medical,
obstetric, and demographic data, the collection of a large representative imaging dataset, and the application of cutting-edge pediatric image analysis methods. Limitations reflect inherent
difficulties in imaging infant subjects. Age-related changes in signal intensities and contrast may affect CT and SA measures (Walhovd, Fjell, et al. 2016). In addition, compared to SA
Table 2.1. Descriptive Statistics for Demographic and Medical History Variables
Continuous Variables Average SD Min Max
Birth weight 2843.511 706.544 790 4820
Gestational Age at Birth 261.195 19.082 192 295
Postnatal Age at MRI 30.64 16.871 6 144
5 Minute APGAR Score 8.72 0.693 3 10
Maternal Education 15.05 3.464 0 26
Paternal Education 14.86 3.488 0 26
Maternal Age 29.858 5.585 16 47
Paternal Age 32.379 6.553 17 64
Categorical Variables N %
NICU Stay > 24 hours No 635 79%
Yes 170 21%
Sex Male 429 53%
Female 376 47%
Delivery Method Vaginal C-section 382 423 47% 52%
Household Income
High 238 30%
Mid 217 27%
Low 299 37%
Missing 51 6%
Maternal Ethnicity
Caucasian 612 76%
African American 173 21%
Asian 17 2%
Native American 3 < 1%
Paternal Ethnicity
Caucasian 588 73%
African American 184 23%
Asian 26 3%
Native American 7 1%
Gestational Number Singleton 371 46%
Twin 434 54%
Maternal Psychiatric History No 508 63%
Yes 297 37%
Paternal Psychiatric History No Yes 714 91 89% 11%
Maternal Smoking No 738 92%
Yes 67 8%
T2 Sequence Type
Type 1 287 36%
Type 2 386 48%
Type 3 12 1%
Table 2.2. Significant Associations with Global Cortical Thickness and Surface Area
Region of
Interest R2 Predictors Beta r2 q- value
Relative Difference
Average Thickness
0.52 Intercept 1.14E+00
Postnatal Age at MRI 1.64E-03 1.77E-01 6.67E-44 0.09%
Paternal Education -2.44E-03 1.67E-02 3.26E-06 -0.13%
Maternal Ethnicity - Asian 8.66E-03 3.58E-04
3.39E-08
0.45% Maternal Ethnicity - African American 2.74E-02 2.91E-02 1.40% Maternal Ethnicity - Native American -5.44E-03 2.53E-05 -0.29%
ICV 1/3 9.59E-03 1.87E-01 4.24E-49 0.50%
T2 Sequence (Type1 vs Type2) 3.62E-03 7.53E-04
8.12E-01
0.19%
T2 Sequence (Type1 vs Type3) 2.73E-03 2.52E-05 0.14%
T2 Sequence (Type1 vs Type4) -1.86E-03 1.01E-04 -0.10%
Total Surface
Area
0.51 Intercept -2.11E+02
Birth Weight 5.70E+00 1.89E-01 3.98E-24 3.6%*
Gestational Age at Birth 2.78E+02 3.29E-01 1.78E-26 0.35%
Postnatal Age at MRI 4.08E+02 5.52E-01 1.16E-67 0.51%
Sex -3.06E+03 2.71E-02 1.69E-10 3.90%
T2 Sequence (Type1 vs Type2) 7.39E+02 1.59E-03
3.76E-01
0.93%
T2 Sequence (Type1 vs Type3) -1.26E+03 2.72E-04 -1.59%
T2 Sequence (Type1 vs Type4) 4.33E+02 2.73E-04 0.55%
Figure 2.3. Significant associations between regional CT and postnatal age at MRI and gestational age at birth shown as percent change by day. Regions in white were not deemed significant after correction for
Figure 2.5. Significant associations between regional CT and maternal ethnicity are projected onto the cortical surface. Regions in dark pink show thinner cortices in infants of Caucasian mothers and regions in light pink show thicker cortices in infants of Caucasian mothers. Regions in white were not significant
38
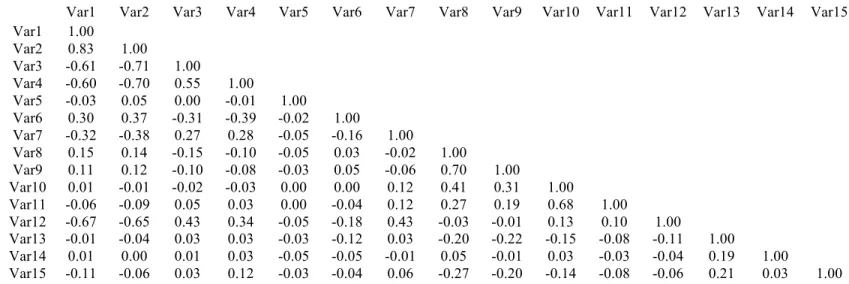
Table S2.1. Correlation Matrix of Predictor Variables
Var1 Var2 Var3 Var4 Var5 Var6 Var7 Var8 Var9 Var10 Var11 Var12 Var13 Var14 Var15
Var1 1.00
Var2 0.83 1.00
Var3 -0.61 -0.71 1.00
Var4 -0.60 -0.70 0.55 1.00
Var5 -0.03 0.05 0.00 -0.01 1.00
Var6 0.30 0.37 -0.31 -0.39 -0.02 1.00
Var7 -0.32 -0.38 0.27 0.28 -0.05 -0.16 1.00
Var8 0.15 0.14 -0.15 -0.10 -0.05 0.03 -0.02 1.00
Var9 0.11 0.12 -0.10 -0.08 -0.03 0.05 -0.06 0.70 1.00
Var10 0.01 -0.01 -0.02 -0.03 0.00 0.00 0.12 0.41 0.31 1.00
Var11 -0.06 -0.09 0.05 0.03 0.00 -0.04 0.12 0.27 0.19 0.68 1.00
Var12 -0.67 -0.65 0.43 0.34 -0.05 -0.18 0.43 -0.03 -0.01 0.13 0.10 1.00
Var13 -0.01 -0.04 0.03 0.03 -0.03 -0.12 0.03 -0.20 -0.22 -0.15 -0.08 -0.11 1.00
Var14 0.01 0.00 0.01 0.03 -0.05 -0.05 -0.01 0.05 -0.01 0.03 -0.03 -0.04 0.19 1.00
Var15 -0.11 -0.06 0.03 0.12 -0.03 -0.04 0.06 -0.27 -0.20 -0.14 -0.08 -0.06 0.21 0.03 1.00
Var1- Birth Weight, Var2 – Gestational Age at Birth, Var3 – Postnatal Age at MRI, Var4 – NICU stay > 24 hours, Var5 – Sex, Var6 – 5 Minute APGAR Score, Var7 – Delivery Method, Var8 – Maternal Education, Var9 – Paternal Education, Var10 – Maternal Age, Var11 – Paternal Age,
Table S2.2. Demographic Characteristics of Neonates with Caucasian and African American Mothers
Caucasian (n = 612)
African American (n = 173)
Continuous Variables Average SD Average SD P-value
Birth weight (grams) 2910.941 695.798 2610.613 727.922 < 0.001 Gestational Age at Birth (days) 261.882 18.644 258.572 21.128 0.063
Postnatal Age at MRI (days) 30.092 16.878 32.601 17.153 0.089
5 Minute APGAR Score 8.740 0.696 8.642 0.706 0.105
Maternal Education (years) 15.428 3.513 13.569 2.771 < 0.001 Paternal Education (years) 15.204 3.633 13.420 2.230 < 0.001
Maternal Age (years) 30.361 5.326 27.994 6.236 < 0.001
Paternal Age (years) 32.379 6.068 32.237 8.249 0.833
Categorical Variables N % N % P-value
NICU Stay > 24 hours Yes No 493 119 81% 19% 125 48 72% 28% 0.026
Sex Male 321 52% 92 53% > 0.999
Female 291 48% 81 47%
Delivery Method C-section Vaginal 298 314 49% 51% 78 95 45% 55% 0.388
Gestational Number Singleton 286 47% 75 43% 0.489
Twin 326 53% 98 57%
Paternal Ethnicity
Caucasian 564 92% 17 10%
< 0.001
African American 31 5% 152 88%
Asian 13 2% 1 1%
Native American 4 1% 3 2%
Maternal Psychiatric History
No 403 66% 90 52% 0.001
Yes 209 34% 83 48%
Paternal Psychiatric History
No 527 86% 169 98%
< 0.001
Yes 85 14% 4 2%
40
Table S2.3. Demographic Characteristics of Neonates by Total Household Income
High (n = 238) Middle (n = 217) Low (n = 299)
Continuous Variables Average SD Average SD Average SD P-value Birth weight (grams) 2920.231 678.033 2887.76 781.669 2761.137 677.829 0.022 Gestational Age at Birth (days) 263.122 18.503 260.834 19.517 259.786 19.434 0.13 Postnatal Age at MRI (days) 29.769 17.052 29.433 15.485 32.144 17.636 0.128 5 Minute APGAR Score 8.769 0.624 8.728 0.642 8.682 0.788 0.358 Maternal Education (years) 17.466 2.6 15.871 2.775 12.793 2.85 < 0.001 Paternal Education (years) 16.911 2.736 15.452 3.053 12.785 3.26 < 0.001 Maternal Age (years) 32.882 3.868 31.014 5.227 26.732 5.523 < 0.001 Paternal Age (years) 35.075 5.386 33.598 5.427 29.192 6.93 < 0.001
Categorical Variables N % N % N %
NICU Stay > 24 hours No 205 86% 162 75% 225 75% 0.002
Yes 33 14% 55 25% 74 25%
Sex Male 124 52% 117 54% 157 53% 0.921 Female 114 48% 100 46% 142 47%
Delivery Method Vaginal C-section 110 128 46% 54% 122 95 44% 56% 151 148 51% 49% 0.298
Gestational Number Singleton Twin 112 126 47% 53% 118 99 46% 54% 134 165 45% 55% 0.873
Maternal Ethnicity
Caucasian 220 92% 165 76% 199 67%
< 0.001 African American 12 5% 45 21% 95 32%
Asian 6 3% 7 3% 2 1%
Native American 0 < 1% 0 < 1% 3 1%
Paternal Ethnicity
Caucasian 214 90% 159 73% 186 62%
< 0.001 African American 14 6% 47 22% 104 35%
Asian 9 4% 9 4% 5 2%
Native American 1 < 1% 2 1% 4 1%
Maternal Psychiatric History No 170 71% 146 67% 163 55% < 0.001 Yes 68 29% 71 33% 136 45%
Paternal Psychiatric History No Yes 213 25 89% 11% 188 29 87% 13% 267 32 89% 11% 0.56
Table S2.4. Bootstrapping Results from Variable Selection
Variable of Interest Cortical Thickness Surface Area Total SA # ROIs >
800
% ROIs > 800
# ROIs > 800
% ROIs > 800
> 800
5 Minute Apgar 0 0% 0 0% No
Postnatal Age at MRI 41 52% 3 4% Yes
Birth weight 4 5% 2 3% Yes
Delivery Method 0 0% 0 0% No
Gestational Age at Birth 24 30% 1 1% Yes
Gestational Number 2 3% 0 0% No
Income (low vs high) 0 0% 0 0% No
Income (low vs mid) 0 0% 0 0% No
income (low vs missing) 0 0% 0 0% No
Maternal Age 0 0% 0 0% No
Maternal Education 0 0% 0 0% No
Maternal Ethnicity (Caucasian vs Native American) 0 0% 0 0% No
Maternal Ethnicity (Caucasian vs Asian) 0 0% 0 0% No
Maternal Ethnicity (Caucasian vs African American) 14 18% 1 1% No
Maternal Psychiatric History 0 0% 0 0% No
Maternal Smoking 0 0% 0 0% No
NICU Stay > 24 hours 0 0% 0 0% No
Paternal Age 0 0% 0 0% No
Paternal Education 11 14% 0 0% No
Paternal Ethnicity (Caucasian vs Native American) 0 0% 0 0% No
Paternal Ethnicity (Caucasian vs Asian) 0 0% 0 0% No
Paternal Ethnicity (Caucasian vs African American) 0 0% 2 3% No
Paternal Psychiatric History 0 0% 0 0% No
Sex 7 9% 1 1% Yes
T2 Sequence Type (Type1 vs Type2) * 79 100% 78 100% Yes
T2 Sequence Type (Type1 vs Type3) * 79 100% 78 100% Yes
T2 Sequence Type (Type1 vs Type4) * 79 100% 78 100% Yes
ICV1/3 * 79 100% --- --- ---
Total Surface Area * --- ---- 78 100% ---
Table S2.5. Significant Associations of Postnatal age at MRI with Cortical Thickness from Selected Models
Region of Interest Beta r2 q- value Relative Difference
Angular_L 1.69E-03 0.05 1.57E-10 0.091%
Angular_R 1.72E-03 0.08 1.43E-15 0.094%
Calcarine_L 2.42E-03 0.08 1.36E-16 0.130%
Calcarine_R 1.98E-03 0.05 1.70E-05 0.102%
Cingulum_Mid_R 9.81E-04 0.03 1.07E-07 0.051%
Cuneus_R 1.68E-03 0.05 1.01E-09 0.092%
Frontal_Inf_Oper_L 1.80E-03 0.08 2.12E-15 0.093% Frontal_Inf_Oper_R 1.77E-03 0.06 5.04E-14 0.091%
Frontal_Mid_L 1.21E-03 0.04 1.77E-05 0.065%
Frontal_Mid_R 1.12E-03 0.04 1.91E-05 0.061%
Frontal_Sup_L 1.06E-03 0.02 8.62E-04 0.056%
Frontal_Sup_Orb_R 2.51E-03 0.09 8.97E-17 0.139%
Frontal_Sup_R 8.12E-04 0.01 8.84E-03 0.043%
Heschl_L 2.08E-03 0.06 1.96E-13 0.103%
Heschl_R 2.47E-03 0.07 1.61E-14 0.117%
Insula_L 1.65E-03 0.10 4.77E-23 0.082%
Insula_R 1.25E-03 0.06 9.70E-14 0.061%
Lingual_L 1.43E-03 0.06 3.55E-06 0.076%
Lingual_R 1.91E-03 0.08 4.98E-16 0.101%
Occipital_Mid_L 1.21E-03 0.05 3.47E-10 0.069%
Occipital_Mid_R 1.17E-03 0.04 1.11E-08 0.066%
Occipital_Sup_L 1.29E-03 0.04 1.19E-08 0.074%
Occipital_Sup_R 1.52E-03 0.06 5.28E-12 0.086%
Olfactory_R 2.71E-03 0.04 1.56E-08 0.120%
Parietal_Inf_L 1.66E-03 0.08 5.39E-16 0.090%
Parietal_Inf_R 1.96E-03 0.09 1.10E-18 0.108%
Parietal_Sup_L 1.06E-03 0.02 7.03E-03 0.059%
Parietal_Sup_R 1.32E-03 0.04 1.28E-04 0.074%
Postcentral_L 1.38E-03 0.07 3.40E-07 0.074%
Postcentral_R 1.43E-03 0.07 1.88E-08 0.078%
Precentral_L 1.72E-03 0.11 1.58E-25 0.091%
Precentral_R 1.91E-03 0.12 8.31E-29 0.101%
Rolandic_Oper_L 2.18E-03 0.14 4.03E-26 0.109%
Rolandic_Oper_R 1.83E-03 0.10 1.81E-21 0.093%
Supp_Motor_Area_R 1.25E-03 0.03 3.65E-04 0.060%
SupraMarginal_R 1.45E-03 0.05 2.79E-09 0.077%
Temporal_Mid_L 1.15E-03 0.04 8.33E-08 0.061%
Temporal_Mid_R 1.22E-03 0.05 4.18E-10 0.063%
Temporal_Sup_L 1.57E-03 0.08 7.57E-15 0.077%
Table S2.6. Significant Associations of Gestational Age at Birth with Cortical Thickness from Selected Models
Region of Interest Beta r2 q-value Relative Difference Frontal_Inf_Orb_L -2.07E-03 0.12 1.38E-24 -0.10% Frontal_Inf_Tri_L -1.64E-03 0.08 1.62E-18 -0.09% Frontal_Med_Orb_L -2.35E-03 0.06 5.53E-13 -0.12% Frontal_Med_Orb_R -2.13E-03 0.07 4.29E-14 -0.11%
Frontal_Mid_L -1.16E-03 0.05 2.01E-06 -0.06%
Frontal_Mid_Orb_L -2.49E-03 0.08 4.04E-18 -0.13% Frontal_Mid_Orb_R -2.16E-03 0.07 2.20E-14 -0.12%
Frontal_Mid_R -1.18E-03 0.05 2.44E-07 -0.06%
Frontal_Sup_L -1.67E-03 0.08 2.17E-09 -0.09%
Frontal_Sup_Medial_L -2.97E-03 0.22 4.06E-49 -0.14% Frontal_Sup_Medial_R -3.56E-03 0.23 4.80E-50 -0.17% Frontal_Sup_Orb_L -2.24E-03 0.08 8.28E-16 -0.12%
Frontal_Sup_R -1.96E-03 0.11 1.05E-12 -0.10%
ParaHippocampal_R -1.59E-03 0.02 4.01E-03 -0.07% Parietal_Sup_L -1.58E-03 0.06 4.22E-06 -0.09% Parietal_Sup_R -1.07E-03 0.03 3.42E-04 -0.06%
Postcentral_L -5.96E-04 0.02 1.08E-02 -0.03%
Postcentral_R -5.06E-04 0.01 2.06E-02 -0.03%
Precuneus_L -1.28E-03 0.09 2.65E-19 -0.07%
Precuneus_R -1.57E-03 0.11 4.34E-23 -0.08%
Table S2.7. Significant Associations of Paternal Education with Cortical Thickness from Selected Models
Region of Interest Beta r2 q-value Relative Difference Frontal_Inf_Tri_R -5.05E-03 0.03 3.80E-07 -0.27%
Frontal_Mid_L -4.41E-03 0.02 7.63E-08 -0.24%
Frontal_Mid_Orb_L -6.97E-03 0.02 3.72E-06 -0.37% Frontal_Mid_Orb_R -6.70E-03 0.02 6.00E-06 -0.36%
Frontal_Mid_R -4.59E-03 0.03 1.98E-09 -0.25%
Frontal_Sup_L -4.10E-03 0.02 1.15E-05 -0.22%
Frontal_Sup_Medial_R -5.04E-03 0.02 1.15E-05 -0.25%
Frontal_Sup_R -5.46E-03 0.03 3.65E-09 -0.29%
Olfactory_R -7.59E-03 0.01 5.57E-04 -0.34%