DECODING THE YEAST STRESS ADAPTATION CIRCUIT
Justin Gregory English
A dissertation submitted to the faculty of the University of North Carolina at Chapel Hill in partial fulfillment of the requirements for the degree
of Doctor of Philosophy in the Department of Pharmacology.
Chapel Hill 2014
Approved by:
Timothy Elston
Henrik Dohlman
Channing Der
Klaus Hahn
©2014
iii ABSTRACT
JUSTIN ENGLISH: Decoding the Yeast Stress Adaptation Circuit (Under the direction of Henrik Dohlman)
Cells must adapt to survive. To mount an appropriate adaptive response the cell must
relay information from its surroundings to its adaptive machinery. This process, termed
information transmission, is a universal property of biology. Determining how this
information is transmitted, amplified, and interpreted throughout the cell is of paramount
importance. By establishing how information is transmitted in biological systems we can
identify new routes for intervention in disease progression. To this end, this thesis aims to
resolve the information transmission mechanisms associated with the oft studied stress
adaptation circuit of the yeast S. cerevisiae. The work herein considers two distinct properties
of this stress circuit. First, a determination of the methods and mechanisms by which
environmental information is conveyed. Second, an assessment of the consequences of this
information on the reprogramming of cellular metabolism and protein expression. Combined,
these two investigations uncover how yeast have engineered a dynamic system for
v
ACKNOWLEDGEMENTS
First and foremost I wish to thank Henrik G. Dohlman. As my advisor and mentor he
has supported me through all of the work contained in this document, and a substantial
amount that is not. His capacity to remain level headed, guide me in the right direction, and
help me when no one else is able are just some of the few reasons I was able to accomplish
what I have during my time at UNC. Henrik has demonstrated an infinite amount of patience;
as the several hundred manuscript edits and several thousand email correspondences between
us will attest. I sincerely and truly thank you, for everything.
Second, I’d like to thank the Department of Pharmacology. All of the students,
professors, and staff have been outstanding to work with each day. There are few places I
have enjoyed doing and discussing science more, or likely will again. It has been a unique
and wonderful experience to be instructed and educated by leaders of the cell signaling field.
In addition, all these lessons were learned alongside bright peers who have challenged me
every day to do better and push further than at times I thought I was capable. Thank you, to
all of you.
I’d also like to thank the Dohlman lab, both past and present. Much like a family, lab
mates see all of your worst moments, frustrations, and challenges. They keep you humble.
But they are also always there to help you improve yourself, so you can show your best face
Lastly, I thank my family. They have endured from me what I can only describe as a
constant haze of emotions, ranging from exhilaration to crushing frustration. Thank you to
my Father, who has with near perfect regularity come to visit every 3 months since my wife
and I moved to North Carolina. Your visits, support, and love have helped stabilize me
through this long journey. Thank you to my Mother, who I’m not sure ever got away with a
phone call that didn’t run past an hour in length or a late night conversation at home that
didn’t drag on in to morning. You’ve always been there for me. Finally, thank you to my
wife, Michelle. You must be exhausted. My constant stream of thoughts, ideas, complaints,
and jubilations you’ve shouldered with an amazing degree of patience, love, and endurance.
Far from being a sounding board and shoulder to cry on, you truly listen, understand, and talk
me through every obstacle. I can also happily report that you are able to, with surprising
eloquence, inform anyone who might ask what a “MAPK” is or how yeast research is
important. You have on multiple occasions informed someone as to what I am researching -
frequently when I myself didn’t have the foggiest clue as to what I was doing. For all these
vii
TABLE OF CONTENTS
LIST OF TABLES ... viii
LIST OF FIGURES ... ix
LIST OF ABBREVIATIONS ... xii
CHAPTERS I. INTRODUCTION ... 1
Cellular Information Theory and Transmission ... 3
HOG1: an Ancestral MAPK Pathway for Decoding Stress Adaptation ... 13
II. MAPK FEEDBACK SETS A SWITCH AND TIMER FOR TUNABLE STRESS ADAPTATION IN YEAST ... 16
Introduction ... 17
Results ... 19
Discussion ... 42
Experimental Procedures ... 46
III. SPECTATING THE SYMPHONY OF YEAST STRESS ADAPTATION THROUGH BIOINFORMATICS ... 57
Stress Induced Metabolic Restructuring in Yeast ... 58
Weak or Wise?: the Alternative Stress Adaptive Network of Aged Yeast ... 71
Experimental Procedures ... 100
IV. CONCLUSIONS AND FUTURE DIRECTIONS ... 103
Functional Characterization of MAPK Signaling ... 103
Age, Adaptation, and Polyamines ... 110
ix
LIST OF TABLES
Table 2.1. Transcription Factor Binding and Interaction Analysis ... 55
LIST OF FIGURES
Figure 1.1 Potential Sources of Enhanced Computational Depth for MAPK Pathways ... 10
Figure 2.1 Monophosphorylated Hog1 is Recognized by -phospho-p38 Antibodies ... 21
Figure 2.2 The Signaling Profile of the Hog1 MAPK ... 22
Figure 2.3 Modulation of the Hog1 Signaling Profile through Pathway Mutagenesis ... 24
Figure 2.4 Mutational analysis of Hog1 Activity and Downstream Transcription ... 26
Figure 2.5 The Hog1 Signaling Profile is Encoded Through Feedback Phosphorylation .... 29
Figure 2.6 Analogue Inhibition Control Experiments ... 31
Figure 2.7 The Hog1 Signaling Profile is Encoded via Graded Phosphorylation of Ste50 .. 34
Figure 2.8 Ste50 Phosphorylation Profile and Effect on Hog1 Signaling Profile ... 36
Figure 2.9 Microarray and Flow Cytometric Analysis of Adaptive Output ... 39
Figure 2.10 Gating Parameters for Flow Cytometry Analysis ... 41
Figure 3.1 Rank Order Analysis of Metabolomic and Proteomic Output After Osmostress 60 Figure 3.2 Metabolomic and Proteomic Data Overlay to Yeast Cell Glycolysis ... 62
Figure 3.3 Metabolomic and Proteomic Data Overlay to Yeast Krebs Cycle ... 63
Figure 3.4 Metabolomic and Proteomic Data Overlay to Yeast Carbon Cycle ... 66
Figure 3.5 Metabolomic and Proteomic Data Overlay to Yeast Starch Metabolism ... 68
Figure 3.6 Atomic Structure of the Molecule Glycogen ... 69
Figure 3.7 Metabolomic and Proteomic Data Overlay to Yeast Polyamine Metabolism ... 71
xi
Figure 3.9 Age-Dependent Distribution of Protein Abundance; Hor7 ... 76
Figure 3.10 Age-Dependent Distribution of Protein Abundance; Glk1 ... 77
Figure 3.11 Age-Dependent Distribution of Protein Abundance; Gsy1 ... 78
Figure 3.12 Age-Dependent Distribution of Protein Abundance; Gph1 ... 79
Figure 3.13 Age-Dependent Distribution of Protein Abundance; Dcs1 ... 80
Figure 3.14 Age-Dependent Distribution of Protein Abundance; Hsp26 ... 81
Figure 3.15 Age-Dependent Distribution of Protein Abundance; Tsl1 ... 82
Figure 3.16 Age-Dependent Distribution of Protein Abundance; Hsp30 ... 83
Figure 3.17 Age-Dependent Distribution of Protein Abundance; Mbf1 ... 84
Figure 3.18 Age-Dependent Distribution of Protein Abundance; Glc3 ... 85
Figure 3.19 Age-Dependent Distribution of Protein Abundance; Fmp48 ... 88
Figure 3.20 Age-Dependent Distribution of Protein Abundance; Rcn2 ... 89
Figure 3.21 Age-Dependent Distribution of Protein Abundance; Sur1 ... 90
Figure 3.22 Age-Dependent Distribution of Protein Abundance; Gip2 ... 91
Figure 3.23 Age-Dependent Distribution of Protein Abundance; Arg1 ... 92
Figure 3.24 Age-Dependent Distribution of Protein Abundance; Arg3 ... 93
Figure 3.25 Age-Dependent Distribution of Protein Abundance; Arg4 ... 94
Figure 3.26 Age-Dependent Distribution of Protein Abundance; Sed1 ... 95
Figure 3.27 Age-Dependent Distribution of Protein Abundance; Bap2 ... 96
Figure 3.28 Age-Dependent Distribution of Protein Abundance; Tmt1 ... 97
Figure 3.29 Age-Dependent Distribution of Protein Abundance; Aco2 ... 98
Figure 3.30 Gating Parameters for Age-Dependent Distributions ... 102
xiii
LIST OF ABBREVIATIONS
Ala or A Alanine
Alpha
Arg or R Arginine
AMP Adenosine monophosphate
ATP Adenosine Triphosphate
Beta
CCD Charge Coupled Device
CRE-LacZ or CLZ cAMP Regulated Elemental fused to the -Galactosidase Gene
Cys or C Cysteine
Deletion
DNA Deoxyribonucleic acid
EC50 Half Maximal Effective Concentration
E. coli Escherichia coli
ERK Extracellular Signal-Related Kinase
FMO Fluorescence Minus One
FSC-A Forward Scatter Area
Gamma
GAP GTPase Activating Protein
GEF Guanine Nucleotide Exchange Factor
Gly or G Glycine
GO Gene Ontology
GFP Green Fluorescent Protein
GTP Guanosine Triphosphate
His or H Histidine
HOG High Osmolarity Glycerol
Hn Hill slope
JNK c-Jun N-Terminal Kinases
KanMX4 Kanamycin Resistance Gene
KCl Potassium Chloride
Ile or I Isoleucine
Leu or L Leucine
Lys or K Lysine
MAPK Mitogen Activated Protein Kinase
MAP2K Mitogen Activated Protein Kinase Kinase
MAP3K Mitogen Activated Protein Kinase Kinase Kinase
Med. Median
Min. Minutes
mRNA Messenger RNA
nm Nanometer
PAGE Polyacrylamide Gel Electrophoresis
xv
rCV Robust Coefficient of Variation
S. cerevisiae Saccharomyces cerevisiae
Ser or S Serine
SCD Synthetic Complete Dextrose
SDS Sodium Dodecyl Sulfate
SEM Standard Error of the Mean
SSC-A Side Scatter Area
TCA Trichloroacetic Acid
TF Transcription Factor
Val or V Valine
WGA Wheat Germ Agglutinin
WT Wild Type
YPD Yeast Peptone Dextrose
CHAPTER I
INTRODUCTION1
Organisms respond to changes in their environment to maintain balance or
homeostasis. This process is known as adaptation. Adaptation is essential for the survival of
all organisms, as their internal and external environments are in a constant state of flux. For
example, every day we consume a wide variety of foods whose content and concentration are
a diverse mix of chemical signals. A healthy individual is able to digest, absorb, and use
these materials with no ill effect. This is possible as a result of adaptation. Our bodies can
detect the presence of food, or rising concentrations of nutrients in our blood stream, and
generate suitable responses to those stimuli. Such responses may include an increased
production of saliva, bile, or insulin. Eating is an example of adaptation to an acute signal of
external origin; we also adapt to the inverse, a chronic signal of internal origin. An example
would be body heat. We generate heat as we convert the raw materials from food in to
energy. Regulating this heat, our body temperature, is a continuous adaptive process that
engages a multitude of complex systems including blood flow, sweat glands, and air intake.
The number of systems that function through adaptive response is innumerable. From our
immune system to social interactions our bodies are engaged in a continuous adaptive cycle;
Adaptation, with respect to the long-term health of an organism, is not always
beneficial. Stress occurs when an organism adapts to a challenge, but ultimately deteriorates
its health in the process. For example, atherosclerotic lesions are caused by inflammation of
blood vessel epithelium1,2. Inflammation is an adaptive response of the epithelial cell to the accumulation of lipids, macrophages, and shear forces against its extracellular matrix. This
inflammation is a stressful adaptation that can eventually result in various diseases, from high
blood pressure to a stroke or heart attack if the lesion becomes unstable and ruptures. The
adaptive response mounted by the epithelial cell is not a disease, it is the best effort of this
cell to respond to and survive in a changing environment. The cell is attempting to maintain
balance, but this process results in a stress, both for the cell and the organism.
While adaptation influences whole organisms, these adaptations originate from single
cells. In the atherosclerosis example above, a handful of epithelial cells mount an adaptive
response, resulting in a detriment to the organism. This example is just one of many instances
where stressful cellular adaptations beget disease. We see the same patterns recur in
diabetes3, immune dysfunction4, wound necrosis5, arthritis6, and ischemia7- just to name a few among many. The cells in these diseased tissues attempt to adapt to their environment
and in turn generate a stress that develops in to the disease. To preempt or remedy disease
progression it is vital that we understand how, when, and under what conditions cells make
adaptive decisions.
To adapt, a cell must transmit information dictating the changes in its environment to
its adaptation machinery. New mechanisms of cellular information transmission are being
conserved cellular information transmission mechanisms. MAPK pathways receive input
information as signals from extracellular receptors and convert these signals in to adaptive
output through activation of downstream substrates. Our understanding of these information
transmission processes has allowed the development of many disease interventions. These
successes are based primarily on traditional pharmacological approaches that focus on
intervening at the input, or receptor, level. However, MAPK pathways process these simple
signal inputs in to complex system outputs. While interference at the input level can
modulate MAPK activity, a fine-tuned therapeutic approach can be developed by modulating
single aspects of MAPK signaling pathways11–15. A current limitation for designing these interventions is our narrow understanding of how MAPK pathways process input
information. In the following I will expand on these principles and then introduce new
insights from my graduate research, delineating new mechanisms of MAPK information
processing that regulate stressful adaptations.
Cellular Information Theory and Transmission
To adapt a cell must detect and transmit the presence of an extracellular cue to its
internal adaptive machinery. This process is termed information transmission16,17.
Information transmission occurs any time an input is delivered from its origin to a receiver to
generate a related output. Information transmission is a fundamental principle of the natural
world. An entire branch of physics is based on the process of information transmission, since
at its core, information transmission is a fight against entropy. In 1877 Ludwig Boltzmann,
during his studies of the molecular properties of gas, inadvertently birthed the field of
energy can be configured in a system. The background noise in any system is a sampling of
these many configurations. A signal, or information, is the amplification of a meaningful
subset of these configurations. Claude E. Shannon, during his time at Bell Labs in 1948,
published “A Mathematical Theory of Communication”18, a seminal work in the field that expanded on the principles brought forth by Boltzmann to establish how a signal could be
distinguished and transmitted in a system.
Shannon’s work derived two key principles that have formed the foundation for all
modern communication systems. First, he deduced that all information is encoded as
interpretable symbols. Our alphabet is a suitable example as each letter is a symbol. Our
alphabet, however, is a poor vehicle for rapidly transmitting information as no individual
symbol conveys information in isolation. The word “no” is the smallest symbol combination
possessing an isolated meaning. Shannon developed similar (though more complex)
deductions to derive his second principle, that information has a specific symbol density. The
rate at which information of a particular density can be conveyed in a system represents that
systems bandwidth. Further details of Shannon’s work falls outside the scope of this
dissertation, but the core principles established above have shaped how we view information
communication in biological systems19–22. For example, deoxyribonucleic acid (DNA) is frequently cited to explain how the principles of information theory pertain to biology.
Information is written in to DNA using a four symbol code; A, T, G, and C. This code is
delivered to ribosomes to inform protein synthesis and each symbol is read in groups of 3,
the codon. The codon represents the density of DNA communication in this system. The
bandwidth of translation is thus the number of codons the ribosome can read per unit time.
containing some density of information is delivered and transformed to generate a related
output at a particular rate. Adaptation, including stress and disease progression, depend on
this paradigm. In the following I will address how cells leverage this information
transmission paradigm to convert simple signal inputs in to complex system outputs through
MAPK signaling pathways.
Information Transmission in MAPK Signaling Pathways
Cells use protein networks to transmit information. For environmental adaptation this
process can be summarized in to 3 stages; an environmental cue is internalized as a
cytoplasmic signal, that signal is converted into information of a given density, and that
information is communicated to adaptive machinery to encode a response. This
generalization applies to a multitude of specific signaling mechanisms. The cue can be
internalized as a signal through receptor transduction, active transport, or changes in
membrane energy potential. This signal can then be converted to communicable information
by a host of second messengers and signaling pathways ranging from classic signals such as
cyclic AMP, phosphotidyl inositol, and calcium influx to more recent discoveries such as
proton influx23 and scaffold recruitment24–26. Each second messenger ultimately conveys signaling information to a signaling cascade that processes and stores this information for
later communication to the cells adaptive machinery. There are many classes of signaling
cascades, each of which perform crucial biological functions. Of these, mitogen activated
protein kinase (MAPK) cascades are a canonical and widely studied example – and are the
A kinase, the active unit of a MAPK cascade, is a simple enzyme that binds
adenosine triphosphate (ATP) and liberates its y-phosphate using a coordinated charge
re-distribution mechanism. Where kinases shine, from an information transmission point of
view, is in their capacity to append this freed phosphate to specific residues of a bound
protein substrate; a process referred to as phosphorylation. In so doing, kinases organize raw
cellular energy in to an array of chemical signals. This organized phosphorylation represents
a unique signature within the cell. However, as noted by Shannon and Boltzmann, for a
signature to convey information it must be amplified above the stochastic noise of the
system. To meet these signal propagation demands organisms utilize a startlingly elegant
solution, MAPK cascades.
The core architecture of a MAPK cascade is the same in all eukaryotes27,28, from yeast to humans. Each cascade is comprised of 3 kinases, which confer information to one
another in series. The MAPK kinase kinase (MAP3K) is the first in the series. The MAP3K
is the gatekeeper of activation for the cascade, and is activated by mediators of second
messenger signals. Upon activation the MAP3K activates the MAPK kinase (MAP2K) by
appending two phosphates on two distinct residues of the enzymes activation loop. Once
activated the MAP2K repeats this process, phosphorylating and thereby activating the MAPK
– the terminal signal integration point in the cascade.
The sequential signal transduction mechanism of MAPK cascades serves two
important information transmission functions. First, the cascade converts the disparate
chemical signals input at the MAP3K level in to a single phosphorylation-based language
carried through the cascade. Second, the cascade exponentially amplifies input information
through basic enzyme kinetics. If a single MAP3K molecule is activated by an upstream
signal it will subsequently act upon multiple MAP2K molecules, which will then act on an
even greater proportion of MAPK molecules. This process is referred to as ultrasensitive
signal propagation29,30. Ultrasensitive MAPK signals, without external regulation, result in exponential signal amplification. Studies of synthetic, unregulated MAPK cascades
corroborate these conclusions31. Thus, nature has devised a simple signal converter and amplifier for communicating extracellular signals.
MAPK activation is essential for adaptation. The MAPK conveys the converted and
amplified information of the upstream cascade to hundreds of downstream substrates32–34. This transmission step is what enables adaptive behavior. The MAPK conveys this
information via substrate phosphorylation. Phosphorylation has been observed to amplify or
weaken enzymatic activity, queue the substrate to be localized or degraded, and increase or
decrease the affinity of the substrate to binding partners. Thus, by converting extracellular
cues in to a universal phosphorylation signal and amplifying that signal, the MAPK cascade
is able to reprogram molecular activity across the cell. This reprogramming impinges upon
fundamental cellular processes such as transcription35, translation36, and metabolism37 to augment cellular behaviors.
Ultimately, reprogramming causes the cell to either redefine or re-establish
homeostasis. For example, the mammalian extracellular signal-regulated kinase (ERK)
cascade is activated by numerous growth hormones, resulting in cell division or
differentiation38. Thus, ERK signaling redefines homeostasis and pushes the cell toward a definitive state change. Conversely, the mammalian p38 MAPK cascade is activated by
challenge. Notably, the cell is able to delineate these vastly different adaptive programs using
the same general information transmission system, the MAPK cascade. By determining how
MAPKs transmit adaptive information we can identify ideal means for modulating these
processes in the interest of therapeutic intervention.
Two mechanisms dictate how MAPKs transmit adaptive information. The first is the
substrate specificity of the MAPK. Each MAPK binds to and phosphorylates a specific panel
of downstream substrates. Thus, the substrate interaction space for the kinase represents the
adaptive machinery with which it can communicate. However, transient activation of the
MAPK may only result in phosphorylation of the highest affinity substrates; whereas
prolonged activation may result in saturation of the interaction space. Following the same
kinetic logic, activation of a small number of MAPK molecules may minimally
phosphorylate the substrate pool; whereas activation of all MAPK molecules may saturate
the substrate pool. This potential for alternative outputs as a function of MAPK amplitude
and duration was recently highlighted in a study of ERK activity40. By increasing ERK activity duration researchers were able to induce cell differentiation upon application of a
proliferative stimulus. Therefore, the second mechanism mediating distribution of MAPK
cascade information is the kinetics with which the MAPK is activated. The amplitude,
duration, and frequency of MAPK activation represents its signaling profile41. Thus, much like telephone cables, the kinase-substrate affinities establish the connections in the
The Computational Architecture of MAPK Signaling Pathways
MAPK substrate interaction networks have been generated under a plethora of
signaling conditions, however in most instances the message originating at the nexus of these
networks remains to be elucidated. To understand this message we must consider how it is
generated; specifically by determining how the originating extracellular signal is converted,
amplified, and applied to the MAPK. A suitable analogy for addressing this problem comes
from mathematics. Specifically, an environmental input “x” is converted to a related output
“y” through computation within the MAPK cascade “f(x)”. This computation is performed
over time, generating a signaling profile curve representing the relationship between input
and MAPK activity.
From a strictly biochemical point of view the computational depth of a 3 kinase
cascade is minimal (Figure 1.1). Each active kinase can have 3 variables that dictate the
functional form of the pathway; abundance in the cell, binding rate, and catalytic rate. Over
time, with ample ATP and a low rate of intrinsic dephosphorylation, all the kinase molecules
in the cascade will arrive at a phosphorylated steady state. Thus, the system would truly only
communicate one of two messages, on or off, a binary switch. A binary signal produces the
lowest density of encoded information, and could never produce the flexible permutations of
signal transduction necessary for life. For example, knowing that a hormone or cytotoxin is
present in the environment is informative, but to mount an appropriate adaptive response the
cell must also know the quantity of these cues. To this end, the cell utilizes numerous
regulatory mechanisms to modulate MAPK cascade signals; tuning and controlling MAPK
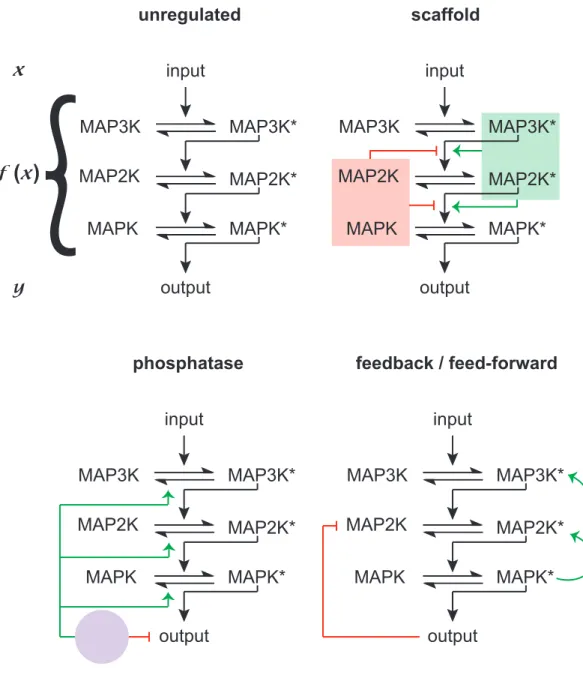
unregulated MAP3K MAP3K* MAP2K MAP2K* MAPK MAPK* input output scaffold MAP3K MAP3K* MAP2K MAP2K* MAPK MAPK* input output phosphatase MAP3K MAP3K* MAP2K MAP2K* MAPK MAPK* input output
feedback / feed-forward
MAP3K MAP3K* MAP2K MAP2K* MAPK MAPK* input output
x
f
(
x
)
y
{
Figure 1.1. MAPK cascades convert and amplify input information in to adaptive outputs. An unregulated cascade represents the lowest order of computational complexity for this system. Through addition of single regulatory mechanisms, as illustrated for scaffolds, phosphatases, or feedback / feed-forward loops the
Regulatory mechanisms act as additional variables in our mathematical analogy.
Addition of variables increases the dynamic range of the binary cascade, creating greater
computational depth (Figure 1.1). This increase in computational depth is necessary for
generating complex adaptive processes. A MAPK cascade and all its constituent regulatory
mechanisms are referred to as a MAPK pathway. Numerous MAPK pathway components
have been identified. For example, scaffolds are catalytically inactive proteins that
simultaneously bind multiple pathway components42. In so doing, scaffolds can increase or decrease information transmission kinetics. Phosphatases also regulate MAPK cascade
activity43–46. Phosphatases strip phosphates from peptides. If the rate with which a kinase phosphorylates a peptide is significantly lower than the dephosphorylation rate of a
competing phosphatase the signal extinguishes. Thus, phosphatases can edit information
transmission directly within the pathway or at the level of MAPK substrates. In this way,
phosphatases filter low amplitude signaling events while increasing the dynamic range of the
cascade. Lastly, feedback phosphorylation has been attributed to large increases in MAPK
pathway computational complexity47–51. Through feedback MAPK pathways can exert differential computations on an input with respect to time, with early activation of the MAPK
impinging on the computational equation to dynamically edit information transmission. A
multitude of MAPK pathway regulators have been identified, each with unique activities and
dose or time dependent behaviors43,47,48. Each serves to modulate the information
transmission process, culminating in the controlled activation of just one protein, the MAPK.
Through kinase cascades, cells have developed a mechanism to convert and amplify
extracellular signals in to transmittable information. Through modulation of these cascades
response. This behavior can be captured in the above f(x) = y analogy, however this analogy
remains a dramatic over-simplification of the complexities of biological activity. It does
however, provide a reasonable platform for approaching a difficult question. Namely, how do
MAPK pathways encode environmental information in a way that is both dynamic and
meaningful for adaptation? To answer this question one must begin carefully measuring “y”
for all “x” values. In this way, a relationship can be established and a signaling profile for the
system elucidated. Using this simple approach, several researchers have recently uncovered a
wealth of information regarding how information transmission informs cell fate41,52. To repeat an above example, the duration of ERK activity dictates whether a cell will proliferate
or differentiate to the same stimulus40. Further, the sum of total active ERK molecules functions as a signal integrator capable of establishing a threshold for cell proliferation53. Like-wise, signaling profiles of p53 have demonstrated that the frequency of signaling, either
pulsed or steady, can result in entirely different cell fate and recovery mechanisms to the
same DNA damage stimulus54. These experiments highlight the importance of elucidating total signaling profiles for a given information transmission circuit. It is no longer sufficient
to simply assess whether a signal is on or off.
The above examples of ERK activity represent a canonical signaling mechanism.
Specifically, a graded signal dictates a switch-like cell fate decision. This rheostat to switch
system is a logical process for determining if a change in cell fate is necessary. For example,
the decision to divide is a major and irreversible decision. Thus, integrating environmental
information as ERK activity duration can allow the cell to establish a decision making
threshold48,55. This rheostat to switch decision making process exists for numerous biological systems. However, in the face of strong cytotoxic events, decision making prior to action
may not be an affordable luxury. Under these circumstances the cell should commit to
adapting as soon as possible to mitigate damage, and tune its response thereafter. This system
would represent a switch that tunes a biological rheostat. No MAPK signaling profiles have
yet been identified that possess this switch-to-rheostat characteristic. However, recent
observations of the high osmolarity glycerol (HOG) MAPK pathway in S. cerevisiae have
hinted at just this possible ordering of operations.
HOG1: an Ancestral MAPK Pathway for Decoding Stress Adaptation
The bakers yeast S. cerevisiae has been a workhorse of stress signaling research for
decades56–60. Central to the capacity of yeast to respond to extracellular stress is the HOG MAPK pathway. The HOG pathway is activated by hyperosmotic stress through the
independent activation of two receptors; Sln1 and Sho1. The Sln1 branch is comprised of a
histidine kinase cascade conserved from bacteria. The Sho1 branch is a canonical MAPK
signaling cascade. The HOG pathway is among the best defined in biology58. In the Sln1 branch the receptor, Sln1, and two histidine kinases, Ypd1 and Ssk1, are coupled together at
the membrane. During normal cellular conditions this complex is autophosphorylated via
phosphorelay from Sln1 through Ypd1 to Ssk1. Upon osmotic shock autophosphorylation
ceases and Ssk1 is activated. Upon activation Ssk1 phosphorylates Ssk2 and Ssk22, two
downstream histidine kinases. Ssk2/22 phosphorylate and activate Pbs2, the MAP2K of the
Hog1 cascade, which in turn phosphorylates and activates Hog1. In the Sho1 branch the
receptor, Sho1, binds to two transmembrane mucin proteins Hkr1 and Msb2. Upon
osmostress these mucins recruit a Rho GTPase (Cdc42) along with the GTPase activator
likely to associate with the Bem1/Cdc42/Cdc24 complex. Cdc24 activates Cdc42, which in
turn activates Ste20. The MAP3K Ste11 is then chaperoned to the cell surface by the scaffold
Ste50, which contacts Cdc42 and brings Ste11 in to proximity with active Ste20. Ste20
activates Ste11, and active Ste11 phosphorylates the MAP2K Pbs2, which again
phosphorylates of the MAPK Hog1. Both branches have been described as having alternative
mechanisms of regulation and activation kinetics. It is currently unclear whether this
2-branch system acts synergistically or competitively for Pbs2, however each 2-branch is capable
of activating Hog1 in isolation.
The Leading Edge of Hog1 Information Transmission
As mentioned, the Hog1 pathway and the entire osmostress response circuit have
been studied extensively. The diversity of these studies has lent to formation of multiple
context specific conflicts, however the core sequence of events culminating in adaptation
from this pathway have been consistently observed. Namely, activation of the pathway
results in the rapid localization of Hog1 to the nucleus62–64. This process depends on phosphorylation of Hog1, but occurs for numerous doses of osmostress within minutes of
activation and nearly all Hog1 molecules are transported. This accumulation suggests that
phosphorylation of Hog1 is switch-like. Indeed several recent studies have demonstrated a
switch-like accumulation of phosphorylated Hog165. This switch-like activation mechanism also results in the immediate blockade of the cell cycle, another switch-like event66.
However, both the duration Hog1 remains in the nucleus and the quantity of transcriptional
an uncommonly observed organization of signal types. Thus far, a mechanism for how Hog1
achieves this unlikely ordering of operations, and the biological consequences of such
actions, have remained elusive. The goal of this thesis is to resolve the mechanisms
underlying these observations and elucidate the biological consequences of the information
CHAPTER II
MAPK FEEDBACK SETS A SWITCH AND TIMER FOR TUNABLE STRESS ADAPTATION IN YEAST1, 2
Signaling pathways can behave as switches or rheostats, generating binary or graded
responses to a given cell stimulus. Osmotic stress activates the MAPK Hog1 resulting in
switch-like nuclear translocation and cell division arrest, but graded transcription and
recovery. Here we consider how this pathway can simultaneously encode a switch and a
rheostat. We demonstrate that Hog1 facilitates a bifurcated cellular response wherein Hog1
activation and commitment to adaptation are switch-like, while protein induction and the
resolution of this commitment are graded. We demonstrate that graded recovery is encoded
through feedback phosphorylation and a gene induction program that is both temporally
staggered and variable across the population. This switch-to-rheostat signaling mechanism
represents an ideal stress adaptation system; with a broad range of inputs generating an all-in
response that is later tuned to allow graded recovery of individual cells over time.
1 Elements of the work referenced in this chapter have been published in: PENDING
2 Figures contributed by:
Justin G. English; 2.1, 2.2, 2.3, 2.4, 2.5, 2.6, 2.7, 2.8, 2.9, 2.10
James P. Shellhammer; 2.2c‐d
Introduction
Mitogen activated protein kinase (MAPK) pathways are dynamic signaling modules present
in all eukaryotic cells. These modules are activated by an environmental input such as the
introduction of a hormone or cytotoxic stress, which generates a signal that is transmitted by
sequential phosphorylation of a protein kinase cascade to a terminal MAPK. Once activated,
the MAPK phosphorylates numerous protein substrates throughout the cell—effectively
transmitting the input signal as a distinct pattern of protein phosphorylations. This
phosphorylation-encoded information confers a symphony of changes in protein activity,
localization, and abundance – a process that ultimately decodes the input information into
adaptive behavior. For example, human growth factors activate the ERK MAPK module,
which initiates cell division38. Cytotoxic agents activate the p38 and JNK MAPK modules, resulting in apoptosis, inflammation, or autophagy67,68. By deciphering how the cell encodes and decodes information via MAPK modules, we can begin to understand the molecular
mechanisms driving animal development, behavior, homeostasis, and disease.
The high osmolarity glycerol (HOG) pathway of S. cerevisiae (yeast) has long been
used to investigate how cells encode and decode environmental information into appropriate
adaptive responses56,69. The HOG pathway has two distinct branches, each activated by osmotic stress. The first (Sln1 branch) is comprised of a 2-component system evolutionarily
conserved in bacteria and yeast. The second (Sho1 branch) is activated by an integral
membrane scaffold similar to numerous mammalian systems. These two branches converge
on a shared MAPK kinase (MAP2K) Pbs2 and the MAPK Hog1. Hog1 activation triggers a
cascade of signaling and transcription events that promote stress adaptation through osmolyte
mammalian stress adaptation MAPK JNK, demonstrating for the first time a conservation of
MAPK function from yeast to humans70.
MAPK signaling is a dynamic process with complexity that extends beyond mere
activation and inactivation. Rather, MAPK modules are tunable communicators of
information wherein the onset, amplitude, and duration of MAPK activation combine to
generate a unique signaling profile41. These profiles directly affect how input information is encoded and ultimately decoded to change cellular behavior. For example, increasing the
duration of ERK MAPK signaling causes the input normally used to encode cell division to
instead initiate differentiation40. Appropriate responses to stress, mitogens, and other stimuli also hinge upon producing distinct signaling profiles52,54,71. However, it remains unclear how these signaling profiles are generated. Identifying the mechanisms that coordinate the onset,
amplitude, and duration of MAPK activation will allow us to interpret, predict, and intervene
in the information transmission processes of the cell. Such interventions may eventually
include drugs that restore the MAPK signaling profile in disease states.
The terms switch and rheostat are traditionally used to describe the relationship
between input and output in signaling systems. A switch produces a binary, on or off, fate
decision with no intermediary responses. A rheostat generates a graded output. Cell division
uses switches to threshold checkpoints at the level of MAPK signaling72 and cell cycle progression48. Chemotaxis uses rheostats to flexibly track and dynamically adjust to signal amplitude and direction. In some cases a rheostat can beget a switch53. For example, activation of the MAPK Fus3 occurs in a dose-dependent manner, but leads to switch-like
outputs62,65,66. Unresolved are the direct biochemical mechanisms that can encode this unusual ordering of response types.
Here we define the mechanisms encoding the Hog1 response and its consequences on
downstream output. Our strategy employs a new method to ratiometrically quantify
phosphorylation at multiple levels of the Hog1 signaling cascade over time and in response to
a wide range of input concentrations. In so doing, we define a linear function that relates the
stimulus dose to Hog1 activity duration, a profile we had previously characterized as
dose-to-duration signaling75. Dose-to-duration signaling can account for the ability of some cells to detect changes in a stimulus above that needed for saturation of receptors. We show that
dose-to-duration signaling depends on Hog1 feedback, and that it allows Hog1 to encode
both the switch and the rheostat. The Hog1 switch rapidly engages all cells in the adaptive
process, but also allows individual cells to progress down a temporally graded adaptive
program. Our findings reveal how a switch and rheostat can work simultaneously to ensure
an appropriate response to an environmental stress.
Results
Hog1 is a switch-like timer that linearly transforms dose to duration
Our goal for this work was to identify the exact dose-to-duration relationship between
input strength, Hog1 activity, and signaling output. We additionally endeavored to define the
proteins and processes that encode this dose-to-duration profile. Hog1 is activated when the
MAP2K Pbs2 phosphorylates the activation loop residues T174 and Y17656. Accordingly, activation of Hog1 has traditionally been measured using antibodies raised against the
kinase has also been measured by tracking the translocation of a Hog1-GFP fusion into the
nucleus. Neither method provides simultaneous measurement of the timing and amplitude of
MAPK activation. The anti-phospho-p38 method does not provide the stoichiometry of
activated and inactivated states and does not fully differentiate between the mono- and
dually-phosphorylated forms of the kinase (Figure 2.1). Measurements of nuclear
translocation suffer from similar shortcomings. For example, monophosphorylation is
sufficient for nuclear translocation but not for full activation of the kinase43,76. Conversely, Hog1 promotes stress resistance and mitophagy under conditions that do not normally lead to
nuclear translocation77,78. Thus it remains unclear the extent to which Hog1 phosphorylation and nuclear translocation are correlated. Given these limitations we sought an alternative
method that accurately measures the dynamics and stoichiometry of Hog1 phosphorylation.
Phos-tag is a metal-coordinating small molecule with a high affinity for
phosphorylated serine, threonine, and tyrosine79. Addition of Phos-tag to acrylamide gels slows the migration of polypeptides in proportion to the number of phosphorylations on the
molecule. Accordingly, we analyzed whole cell lysates using our modified method for
Phos-tag analysis. As compared to unstimulated cells, cells osmostressed with 550 mM KCl for
five min exhibited slowed Hog1 migration (Figure 2.2a). Strains harboring integrated Hog1
mutations T174A or Y176F exhibited faster migration, in accordance with a reduced number
of phosphorylations on the polypeptide. Deletion of the MAP2K Pbs2 resulted in migration
of Hog1 identical to that observed in unstimulated cells. Interestingly, we never observed
accumulation of mono-phosphorylated Hog1 in wildtype cells. Strains lacking each of the
phosphatases known to act on Hog1 likewise produced only the dually phosphorylated
0 50 150250350550550 0 50 150250350550
WT hog1∆ Hog1TA
WT hog1∆ Hog1YF
KCl (mM)
α-pp38
α-pp38
Figure 2.1. Phospho-p38 antibodies recognize monophosphorylated forms of Hog1.
A
550 mM KCl
550 mM KCl
WT Hog1 TA Hog1 YF Hog1 AS Hog1 T100A ptc1 ∆ ptc2 ∆ pbs2 ∆ hog1 ∆ pbs2 ∆ ptp2/3 ∆ ptp2 ∆ ptp3 ∆ − + WT α-Hog1 α-Hog1 − + − + − + − + − + − − + − + − + − + − + − + − + C
0 10 20 30
0 25 50 75 100 0 150 250 350 450 550 650 50
Time (min) 60
%ppHog1
B
Phos-tag
bis-tris
min 0 1 2 5 10 20 30 60
α-Hog1
α-Hog1 pbs2
∆ 550 mM KCl
D
0 200 400 600 800
0 500 1000 1500 2000 2500 wildtype area (%ppHog1*min) KCl (mM)
R2 = 0.98 + 0.02
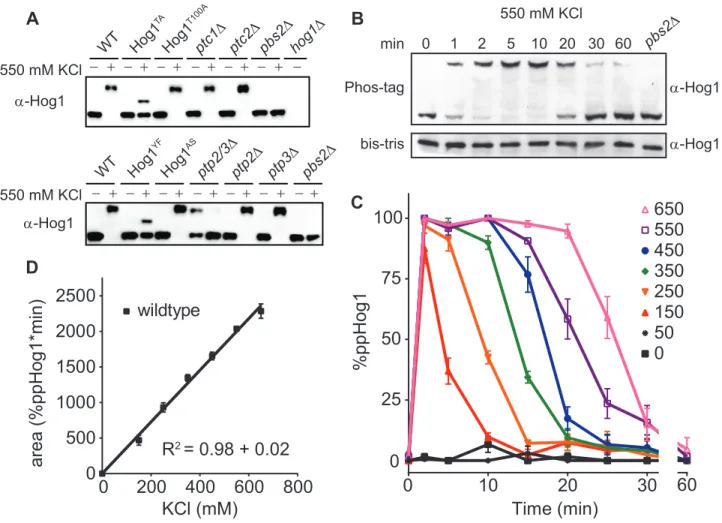
Figure 2.2. The Hog1 signaling profile is a linear function that converts dose-to-duration.
A. Validation of Phos-tag method for resolving dual-phosphorylated and activated (top band) or unactivated (bottom band) Hog1. Cells untreated (-) or treated for 5 min (+) with 550 mM KCl were lysed, resolved by Phos-tag SDS-PAGE, and immunoblotted with Hog1 antibodies. Hog1TA and Hog1YF, mutants lacking one of two phosphorylation sites; Hog1T100A, analogue sensitive mutant; ptc1∆ and ptc2∆, serine/threonine phosphatase mutants. ptp2∆ and ptp3∆, tyrosine phosphatase mutants; pbs2∆ and hog1∆, MAP2K and MAPK mutants, respectively.
B. Hog1 activation over time. Wildtype cells were treated with 550 mM KCl, lysed and probed by immunoblotting with Hog1 antibodies. Top, Phos-tag Bis-Tris SDS PAGE. Bottom, identical samples in the absence of Phos-tag.
C. Hog1 signaling profile. Wildtype cells were treated with the indicated doses of KCl. Percentage of dually phosphorylated Hog1 was calculated by dividing intensity of the upper band by the total intensity of all Hog1 bands in each lane. Data are means +/- SEM (n > 3).
demonstrate that the entire pool of cellular Hog1 is dually phosphorylated in response to
osmotic stress.
Our next objective was to define the Hog1 signaling profile; that is, the amplitude and
duration of Hog1 activation as a function of time and dose of stimulus. We therefore
performed eight time course experiments (Figure 2.2b-c) using a range of salt concentrations
up to 650 mM, a dose past which cellular compression begins to restrict molecular
diffusion80. From these experiments it is evident that Hog1 is activated processively and phosphorylated maximally in response to low doses of osmostress. In particular, we observed
full activation of Hog1 between 50 mM and 150 mM KCl, doses that we had previously
regarded as non-activating. While activation of Hog1 occurred rapidly at all doses tested, the
duration of Hog1 activity was graded, with increasing stimulus concentrations producing
longer periods of maximum phosphorylation. Additionally, deactivation of Hog1 was
significantly slower than its activation and was relatively dose independent, with 95%-98%
of the kinase dephosphorylating in a 10 min window. Integrating the area under each time
series of Hog1 activity revealed a linear relationship between the dose of osmostress and the
duration of total Hog1 activity (Figure 2.2d). Thus the activation of Hog1 is switch like,
while the duration and deactivation of Hog1 are graded. This signaling profile allows Hog1
to reliably convert input strength to Hog1 activity duration. As shown below, this
relationship can be used to identify regulatory components and predict the behavior of Hog1
under various experimental conditions.
0 25 50 75 100 125 150 175 KCl (mM) wildtype ssk1∆ rga1∆ hog1∆ 0
200 400 600800
relative fluorescence
C
0 200 400 600 800
0 800 1.6K
2.4K wildtypessk1∆ rga1∆
area (%ppHog1 * min)
KCl (mM)
D E
relative fluorescence
Hog1 activity duration (log) ∆
ssk1 wildtype rga1∆ B
- 100 - 50 50 100
- 1.5 - 1.0 - 0.5 0.5 1.0 1.5 ∆EC50 ∆Hill slope ssk1∆ ssk2∆ nha1∆ rga1∆ ste50∆ sho1∆ rga2∆ ste20∆ bem3∆ A cytoplasm plasma membrane ssk1 sln1
ssk22 ssk2 ste11
pbs2 bem3 rga2 rga1 hog1 opy2 ste50 ste20 nha1 cdc24 cdc42
msb2 sho1 hkr1
1 2 3 4
0 25 50 75 100 125 150 175
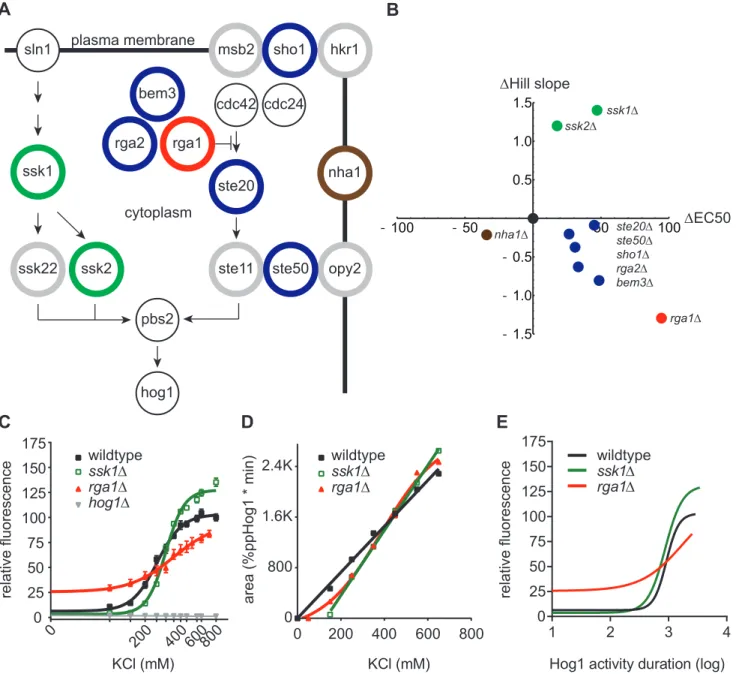
Figure 2.3. The Hog1 signaling profile can be re-engineered through component gene deletions. A. Diagram of the Hog1 signaling pathway. Colored circles correspond to data points in B. Gray circles, pathway component deletions without effect. Black circles, essential pathway components that were not evaluated.
B. Summary of transcription reporter data. 8XCRE-LacZ Hill slope and EC50 for each mutant strain plotted relative to wildtype (black dot) and color coded as in A. Only significant (p < 0.05) changes are displayed. See Figure 2.3 for complete data set.
C. Transcription reporter data for wildtype, ssk1∆, rga1∆, and hog1∆ strains. Data are mean relative fluorescence +/- SEM (n > 4).
D. Integration of Hog1 signaling profiles for ssk1∆ and rga1∆ strains. Wildtype is shown for reference (see Figure 2.1). Data from Figure 2.3 are presented as mean area under the curve +/- SEM.
Extensive effort has gone toward understanding how molecular signaling components
encode, transmit, and decode information about environmental conditions53–55,66,81. One of the best known examples of an encoding component is the kinase scaffold Ste5, which is
regulated via localization, feedback phosphorylation, and conformational changes that relate
pheromone concentration to Fus3 MAPK activity51,74,82,83. Our studies of the Fus3 pathway were the first to suggest a dose-to-duration mechanism for MAPK signaling75. Above we
demonstrate that Hog1 functions in a similar manner, converting input strength to total Hog1
activity duration. Below, we identify components of the Hog1 pathway responsible for this
conversion, reengineer the pathway through deletion of these pathway components, and use
those reengineered pathways to demonstrate how downstream output is determined by the
duration of MAPK activation.
An input-output relationship has been established between Hog1 nuclear dwell time
and transcriptional output62. We predicted that deletion of encoding components upstream of Hog1 would transform the functional dependence of Hog1 activity on salt concentration,
leading to commensurate changes in downstream transcription. We therefore monitored
pathway output using a Hog1-dependent promoter fused to the -galactosidase gene
(CRE-lacZ, CLZ). Using this reporter we conducted a screen wherein we individually deleted each
of 15 non-essential upstream components of the Hog1 pathway and calculated dose-response
curves for transcriptional output (Figure 2.3a-b). CRE-lacZ induction in wildtype cells
requires a minimum of 200 mM KCl, and exhibits a Hill slope of approximately 3 (Figure
2.3c). As compared to wildtype, deletion of SSK1, SSK2, SHO1, STE20, or STE50 increased
the EC50 (Figures 2.3b and 2.4a). Deletion of SSK1 or SSK2 increased the Hill slope. These
B
C
0 5 10 15 20 25 30 60
0 25 50 75 100 0 150 250 350 450 550 650 50 time (min) % pp H og 1
ssk1∆ KCl (mM)
0 5 10 15 20 25 30
0 25 50 75 100 0 50 150 250 350 450 550 650 60 % pp H og 1 time (min)
rga1∆ KCl (mM)
A
nha1ste11hkr1slt2msb2opy2ssk22ssk2ste50sho1rgaste2 20ssk1bem3rga1
-100 0 100
rga1bem3ssk22rga2hkr1opy2sho1nha1ste50ste20ste11slt2ssk2ssk1msb2
-2 0 2
∆
EC50 relative to wildtype
(mM KCl)
∆
Hill slope relative to wildtype
(mM KCl)
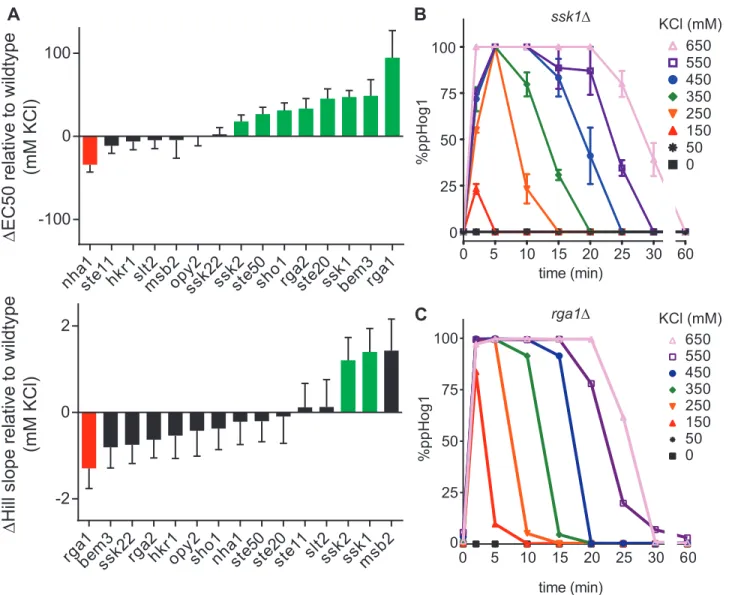
Figure 2.4. The complete transcription and Hog1 activity quantifications for Figure 2.3
A. Rank order of change in transcription reporter Hill slope and EC50 for each mutant strain, relative to wildtype. Significant (p < 0.05) increases or decreases are annotated by green or red shading, respectively. Data are mean relative fluorescence +/- SEM (n > 4).
B. Hog1 signaling profile in an ssk1∆ strain determined as described in Figure 2.2. Data are means +/- SEM (n = 3).
to these known pathway components we also assessed the contribution of the GTPase
activating proteins for Cdc42; RGA1, RGA2 and BEM384,85. Cdc42 is essential for Sho1
branch activity86. Of the Cdc42 regulators, deletion of Rga1 had by far the largest effect on transcription reporter activity, increasing the EC50 and decreasing the Hill slope
substantially. These data reveal a unique and previously unrecognized role of Rga1 in the
Hog1 signaling pathway.
Our next step was to determine the functional relationship between Hog1-mediated
transcription and Hog1 activation. Having identified several candidate encoders of
transcription, we selected Ssk1 and Rga1 for in-depth analysis of Hog1 function. Ssk1 is
essential for the Sln1 branch of the HOG pathway. Rga1 represents a novel regulator of the
Sho1 branch of the pathway. Deletion of these components had the most prominent effects
on both the Hill slope and EC50 for our transcriptional reporter. As shown in Figure 2.4b-c,
deletion of SSK1 produced a delay in Hog1 activation. Deletion of RGA1 shortened the
duration of Hog1 activity at low doses and prolonged activity at high doses. Integration of
these signaling profiles revealed that both deletions affect the relationship between dose and
duration for Hog1 activity (Figure 2.3d). Deletion of SSK1 preserved the linear relationship,
but produced a steeper slope and x-intercept that was right-shifted as compared to wildtype.
Deletion of RGA1 produced a sigmoidal relationship, with less total Hog1 activity at low
doses and greater Hog1 activity at high doses. Thus, the Sln1/Ssk1 branch increases the
dynamic range of the pathway by allowing Hog1 to become activated at low doses and limits
the duration of Hog1 activation at high doses. The Sho1 branch establishes the linearity of
Having determined the contributions of Ssk1 (Sln1 branch) and Rga1 (Sho1 branch)
to Hog1-mediated transcription and Hog1 activation, we next sought to determine the
functional relationship between transcriptional output and Hog1 activity. Accordingly, we
plotted transcriptional output as a function of the duration of Hog1 activation, as measured
by the area under the curve, for wildtype, ssk1, and rga1 strains (Figure 2.3f). When
plotted using this transformation we observed nearly identical induction and output EC50
values for the wildtype and ssk1 strains (Figure 2.3f). When plotted using this transformation we observed nearly identical induction and output EC50 values for the
wildtype and ssk1 strains (Figure 2.3f). However, the behavior of these strains differed from that of the rga1 strain. Part of this difference may be due to pre-adaptation in the rga1D mutant, given that basal transcription is elevated in this strain and suppressed in the
ssk1D mutant87 (Figure 2.3e). Taken together, our results suggest that the Hog1 signaling profile is encoded differently by the two branches of the Hog1 pathway. Additionally, Hog1
activity duration is insufficient to predict transcriptional output under conditions where
integrity of the Sho1 branch is perturbed.
Hog1 feedback phosphorylation encodes dose-to-duration signaling
In our previous modeling analysis we postulated that dose-to-duration signaling is
mediated by a feedback mechanism75. Theoretically, the MAPK may be the origin of this feedback, conveying information via phosphorylation to tune upstream pathway output.
Positive feedback drives switch-like behavior, while negative feedback tunes oscillators and
C
0 200 400 600
0 500 1000 1500 2000 2500 wildtype Hog1T100A KCl (mM) area (%ppHog1*min) B
0 10 20 30 60
0 25 50 75 100 0 50 150 250 350 450 550 KCl (mM) Time (min) % pp H og 1
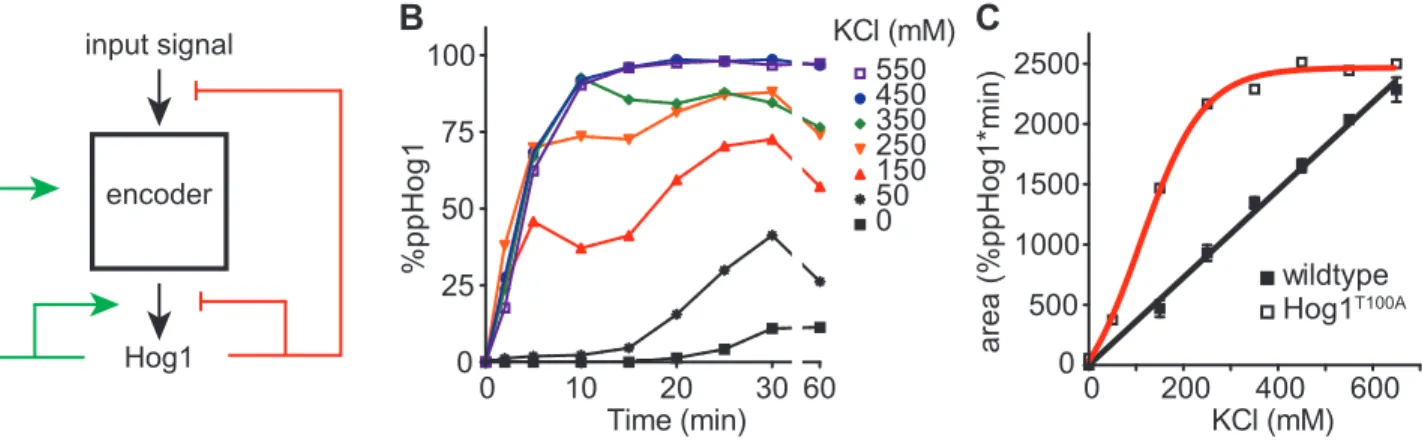
A input signal
encoder
Hog1
Figure 2.5. The Hog1 signaling profile is encoded through feedback phosphorylation.
A. Diagram of potential positive and negative feedback represented by green and red lines, respec-tively.
B. Hog1T100A signaling profile in the presence of the kinase inhibitor 1-NA-PP1 (n = 1).
Indeed, we previously identified two feedback targets of Hog1 in this pathway49,50. To assess the overall contribution of Hog1 feedback we set forth to directly block all Hog1 catalytic
activity. In so doing we predicted that we would disrupt the dose-to-duration relationship
between input strength and Hog1 activation. To test this prediction, we blocked Hog1
activity using a variant of the kinase (Hog1T100A)89 engineered to be sensitive to the ATP-analogue 1-NA-PP190. This method of inhibition has several important advantages over mutations that permanently disrupt the catalytic activity of the kinase. In the absence of
inhibitor the T100A mutation has no detectable effects on Hog1 activity. Conversely, the
presence of the inhibitor has no effect on the wildtype kinase (Figure 2.6). Thus, cells
bearing Hog1T100A will signal normally but are selectively inactivated within minutes of analogue addition. Such acute inhibition limits the opportunity for genetic adaptation or
changes in basal activity of the pathway.
For our experiment, cells were pre-treated for two minutes with 1-NA-PP1, then
exposed to a range of salt concentrations and harvested at different times. As shown in
Figure 2.5b, acute inhibition of kinase activity significantly decreased the amplitude and
increased the duration of Hog1 activation (dual phosphorylation). As expected for such a
signaling profile, we calculated a non-linear relationship between salt concentration and area
under the curve for Hog1 activation (Figure 2.5c). In particular, we observed a requirement
of Hog1 catalytic activity for switch-like activation of the kinase, indicative of a
Hog1-mediated positive feedback loop. We also observed a requirement of Hog1 catalytic activity
for its own dephosphorylation, indicative of a Hog1-mediated negative feedback loop. Taken
together, our results point to the existence of at least two feedback mechanisms: a positive
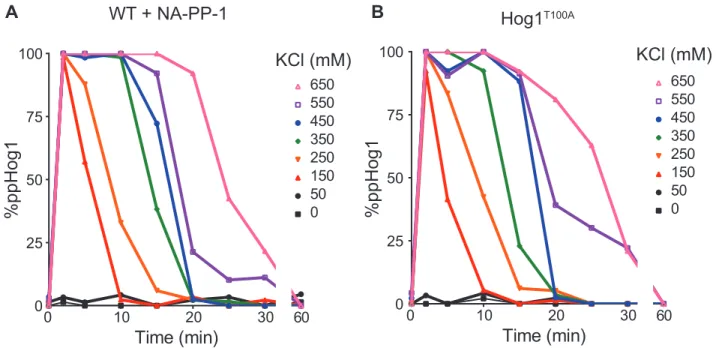
0 10 20 30 0 25 50 75 100
Time (min) 60
650 550 450 350 250 150 50 0 %ppHog1
WT + NA-PP-1
KCl (mM)
0 10 20 30
0 25 50 75 100
Time (min) 60
650 550 450 350 250 150 50 0 %ppHog1 Hog1T100A KCl (mM)
Figure 2.6. Only the combination of Hog1 inhibitor and mutant disrupt dose-to-duration.
A. Hog1 signaling profile with 1-NA-PP1 inhibitor (n=1).
B. Hog1T100A signaling profile without inhibitor (n=1).
feedback loop that ensures graded inactivation over time. We conclude that Hog1 feedback
encodes both a rapid switch and a tunable rheostat.
Hog1 feedback encodes dose as graded bits of patterned phosphorylation
For Hog1 to encode dose-to-duration, some target of Hog1 must be regulated in a
graded manner. Phosphorylation is the currency of MAPK signaling, and many MAPK
substrates are phosphorylated at multiple sites. Such multi-site phosphorylation can be
compared to the binary bit language of computing91. By this analogy, a single protein phosphorylation event shifts the bit state of the substrate amino acid from 0
(unphosphorylated) to 1 (phosphorylated). The number of potential phosphorylation sites on
a protein represents its bit length. For example, Hog1 can accept two phosphorylations and
thus it has a bit length of 2, coding 22 or 4 bit states. However, we have demonstrated that Hog1 only persists in 2 of its 4 potential states, unphosphorylated or dually phosphorylated.
Thus Hog1 functions as a binary switch with just two potential states, on or off. Additionally,
we have shown that feedback regulation is a critical component of dose-to-duration, and that
feedback phosphorylation converts the Hog1 switch into a tunable rheostat. Here we consider
how this switch-to-rheostat conversion might be accomplished via bit state encoding on
feedback substrates.
In our forward genetic screen we identified multiple components that affect Hog1
activity, all of which contain consensus sites for MAPK phosphorylation. Even in this limited
analysis of 15 pathway components, we counted over 100 potential MAPK phosphorylation
sites. Discerning the phosphorylation state of each feedback site, and its individual
loop is likely to encode the entire complex topography of the Hog1 signaling profile.
However, the relative contribution of a single loop can be investigated in isolation. We and
others have previously demonstrated that Ste50 is a substrate of Hog149,66,92, and contains 5 documented sites for MAPK phosphorylation, amounting in 25 or 32 bit states. This rich diversity of Ste50 bit-states can be observed using Phos-tag, as demonstrated in Figure 2.7a.
Upon treatment with a high dose of salt, Ste50 rapidly accumulates as a high-migrating
species and then relaxes back to the original migration pattern over time. Since the
phosphorylated species is absent in a pbs2 mutant, Ste50 feedback phosphorylation is dependent on Hog1 activity.
We then considered whether the phosphorylation of Ste50 is graded. To that end we
measured the bit states occupied by Ste50 over a range of doses and times. These data were
then internally normalized for intensity and aligned computationally (see methods) to
generate an average bit state occupancy histogram for each condition. As shown in Figure
2.7b, Ste50 phosphorylation was indeed graded, occupying a smaller number of increasingly
higher bit states as input strength increased. These phosphorylation events occurred rapidly,
with obvious shifts after 2 min of stimulus addition. Peak Ste50 phosphorylation occurred by
15 min for all doses, and returned to baseline by 30 to 60 min. This trend is highlighted via
plotting of the median migration distance of all Ste50 molecules (Figure 2.8a). Integrating
each median curve demonstrates a linear relationship between input strength and the
accumulation of phosphorylated Ste50 (Figure 2.7c). Thus, Hog1 encodes dose as a pattern
of graded bit state phosphorylations on the Ste50 scaffold. While Hog1 is phosphorylated as
A C
minutes 0 2 5 10 15 20 25 30 60 ste5
0∆
pbs2 ∆ 20 min
αSte50
550 mM KCl
Total pSte50 migration
(pixels) 1000 800 600 400 200 0
0 200 400 600
KCl (mM)
D
0 200 400 600 800
0 500 1000 1500 2000 2500 wildtype Ste505A area (%ppHog1*min) F
1 2 3 4
0 25 50 75 100 125 wildtype relative fluorescence Ste505A E
0 200 400600800
wildtype Ste505A relative fluorescence 0 25 50 75 100 125 B
2 5 10 15 20 25 30 60
50 150 250 350 450 550 650 time (min) KCl (mM) distance (pixels) 0 40 80
% total Ste50
Figure 2.7. Hog1 encodes dose-to-duration signaling through graded phosphorylation
A. Ste50 phosphorylation over time. Wildtype and the indicated mutant strains were treated with KCl, processed via Phos-tag immunoblotting, and probed with Ste50 antibodies.
B. Ste50 phosphorylation profile. Wildtype cells were treated as in A with the indicated concentrations of KCl. Each histogram represents > 2 biological replicates. Red, mean Ste50 distribution measured from unstimulated cells; black, mean Ste50 distribution measured for each dose-time in the variable matrix. Shading, +/- SEM (red and gray) or the positional confidence of our computational alignment for the data (blue).
C. Integration of the Ste50 phosphorylation profile (see Figure 2.8a). Data are mean area under the curve +/- SEM.
D. Integration of the Hog1 signaling profile for the Ste505A strain. Wildtype is shown for reference (see Figure 2.2). Data from Figure 2.8b are presented as mean area under the curve +/- SEM.
E. Transcription reporter data for wildtype (black) and Ste505A (blue). Data are mean relative fluores-cence +/- SEM (n > 4).
B Ste505A
0 5 10 15 20 25 30
0 25 50 75 100 0 150 250 350 450 550 650 KCl (mM) time (min) %ppHog 1
Median pSte50 migration
Time (min) 0 50 150 250 350 450 550 650 KCl (mM) A
0 5 10 15 20 25 30
0 10 20 30 40 2 60 Figure 2.8.
A. Average Ste50 migration. Data are means derived from the alignments in Figure 2.7c +/- SEM (n > 2).
Our next goal was to determine if graded feedback to Ste50 contributes to
establishing the Hog1 dose-to-duration signal. To that end we replaced all documented Hog1
feedback sites on Ste50 and determined the Hog1 signaling profile for this mutant. Ablation
of Ste50 feedback phosphorylation modulated Hog1 activity duration, rather than signaling
amplitude, and disrupted the linearity of the Hog1 dose-to-duration response (Figures 2.7d
and 2.8b). In contrast, the CRE-lacZ profile for the Ste505A mutant was identical to wildtype (Figure 2.7e). This seemingly incongruous behavior appears to be a consequence of a
reduced gene induction threshold in this mutant. This reduction can be highlighted using the
dose to duration conversion method outlined in Figure 2.3 (Figure 2.7f). Again, we discover
that perturbation of components in the Sho1 branch results in a failure of Hog1 duration to
predict gene induction. Thus the effects of the Ste505A mutant are largely masked in the reporter assay, but revealed through direct observation of Hog1 activity over time.
Taken together, these data reveal a time- and dose-dependent increase in Ste50
phosphorylation. As with activation of Hog1, the increase in phosphorylation is rapid and
transient. In contrast to Hog1, the increase in phosphorylation occurs with a dose-dependent
profile that is clearly graded. Thus the switch-to-rheostat conversion occurs at the level of
Hog1-mediated phosphorylation.
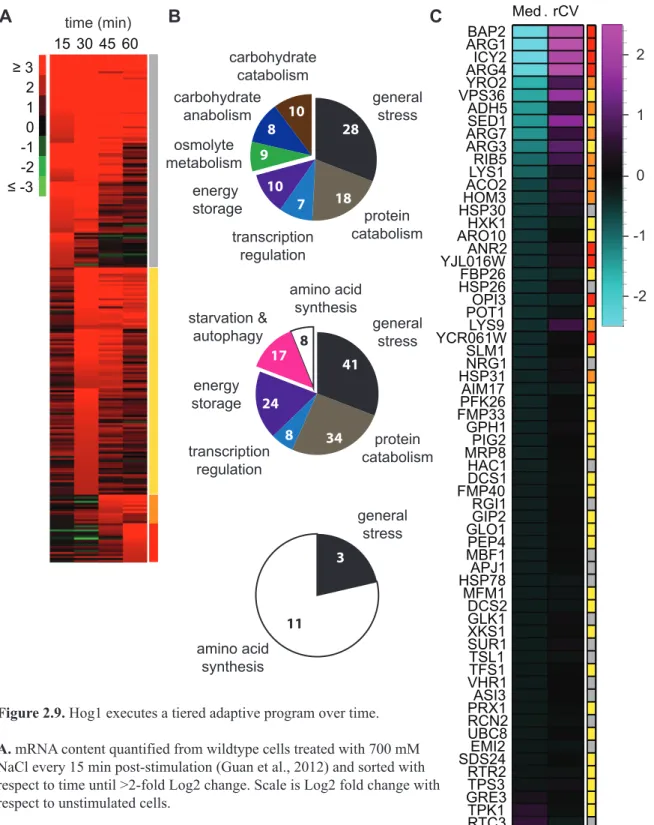
Hog1 activity duration coordinates a tiered adaptive program
Switch-like signals usually underlie commitment to a binary developmental or