Cover Page
The handle
http://hdl.handle.net/1887/35579
holds various files of this Leiden University
dissertation
Author
: Marel, Nienke van der
Mind the gap:
gas and dust in planet-forming disks
Proefschrift
ter verkrijging van
de graad van Doctor aan de Universiteit Leiden, op gezag van Rector Magnificus prof.mr. C.J.J.M. Stolker,
volgens besluit van het College voor Promoties te verdedigen op dinsdag 29 september 2015
klokke 13.45 uur
door
Nienke van der Marel
Promotors: Prof. dr. E. F. van Dishoeck Prof. dr. C. P. Dullemond
Overige leden: Prof. dr. I. A. G. Snellen
Prof. dr. G. A. Blake California Institute for Technology Prof. dr. J. P. Williams University of Hawaii
Prof. dr. A. Natta Dublin Institute for Advanced Studies Dr. M. R. Hogerheijde
Prof. dr. H. J. A. Röttgering
ISBN: 978-94-6259-807-2
1 Introduction 1
1.1 Stars, disks and planets . . . 4
1.1.1 Star formation . . . 4
1.1.2 Planet formation . . . 5
1.1.3 Protoplanetary disks . . . 5
1.1.4 Transition disks . . . 7
1.2 Disk processes . . . 9
1.2.1 Dust evolution . . . 9
1.2.2 Disk dynamics and dust trapping . . . 10
1.2.3 Planetesimal and planet formation . . . 11
1.2.4 Disk dispersion and photoevaporation . . . 12
1.3 Observations . . . 12
1.3.1 SEDs . . . 12
1.3.2 Gas observations . . . 14
1.3.3 Millimeter observations . . . 16
1.3.4 Infrared observations . . . 18
1.4 This thesis . . . 18
1.5 Outlook . . . 20
2 A major asymmetric dust trap in Oph IRS 48 23 2.1 Main article . . . 25
2.2 Supplementary Materials . . . 29
2.2.1 IRS48 . . . 29
2.2.2 ALMA observations . . . 29
2.2.3 Morphology of the continuum emission . . . 31
2.2.4 Dust mass . . . 33
2.2.5 CO 6-5 lines . . . 34
2.2.6 Dust trapping . . . 36
2.2.7 Model of the IRS 48 dust trap . . . 37
2.2.8 Alternative scenarios . . . 39
3 A concentration of centimeter-sized grains in Oph IRS 48 43 3.1 Introduction . . . 45
3.2 Observations . . . 46
3.3 Results . . . 46
3.4 Discussion and summary . . . 49
4 Testing particle trapping in transition disks 53 4.1 Introduction . . . 55
4.2 Targets and observations . . . 55
4.3 Data analysis . . . 57
4.3.1 Visibilities and disk morphology . . . 57
4.3.2 Spectral index . . . 58
4.4 Theoretical predictions of particle trapping . . . 61
4.A Uncertainties of azimuthal variations of spectral index . . . 63
4.B Imaginary part of the visibilities . . . 65
4.C Residual maps . . . 65
5 Gas structure inside dust cavities of transition disks: Oph IRS 48 67 5.1 Introduction . . . 69
5.2 Observations and data reduction . . . 70
5.3 Results . . . 71
5.3.1 Integrated intensity maps . . . 71
5.3.2 Channel maps . . . 73
5.3.3 Total spectrum and C17O . . . . 74
5.3.4 A cut through the major axis of the disk . . . 74
5.4 Analysis . . . 74
5.4.1 Disk structure . . . 77
5.4.2 Physical-chemical modeling . . . 80
5.4.3 Comparison to observations . . . 81
5.4.4 How well is the 20 AU radius determined? . . . 84
5.4.5 Prediction for the CO isotopologue lines . . . 84
5.5 Discussion . . . 86
5.5.1 The gas mass and surface density profile . . . 86
5.5.2 The gas surface density at the dust trap . . . 88
5.5.3 Consequences of the gas mass for a companion . . . 88
5.6 Conclusions . . . 89
6 Gas density drops inside dust cavities of transitional disks 91 6.1 Introduction . . . 93
6.2 Data . . . 95
6.2.1 Observational details . . . 95
6.2.2 Continuum and line maps . . . 96
6.3 Method . . . 99
6.3.1 Modeling . . . 99
6.3.2 DALI . . . 100
6.3.3 Approach . . . 100
6.4 Results . . . 104
6.4.1 Results of individual targets . . . 107
6.5 Discussion . . . 112
6.5.1 Implications of gas density drop . . . 112
6.5.2 Cavity size and dust distribution . . . 113
6.6 Conclusions . . . 114
6.A Channel maps . . . 115
7 Resolved gas cavities in transitional disks inferred from CO isotopologues 119 7.1 Introduction . . . 121
7.2 Data . . . 125
7.2.1 Observational details . . . 125
7.2.2 Continuum and line maps . . . 125
7.3 Modeling . . . 126
7.3.1 Physical model . . . 126
7.3.2 Model fitting approach . . . 126
7.4.1 Results of individual targets . . . 128
7.4.2 A gradual drop . . . 133
7.4.3 Isotopologue selective photodissociation . . . 135
7.5 Discussion . . . 135
7.6 Conclusions . . . 137
7.A Dust model DoAr44 . . . 138
7.B Channel maps . . . 139
7.C Additional models . . . 140
8 Warm formaldehyde in Oph IRS 48 143 8.1 Introduction . . . 145
8.2 Observations . . . 146
8.3 Results . . . 147
8.4 Model . . . 148
8.4.1 Physical structure . . . 148
8.4.2 Results . . . 153
8.5 Discussion . . . 157
8.5.1 Origin of the H2CO emission . . . 157
8.5.2 Comparison with chemical models . . . 159
8.5.3 Comparison of upper limits with other observations . . . 160
8.5.4 Predictions of line strengths of other transitions . . . 161
8.6 Conclusions . . . 162
9 The (w)hole survey: transition disk candidates from the Spitzer catalogs 165 9.1 Introduction . . . 167
9.2 Observations . . . 169
9.2.1 Target selection . . . 169
9.2.2 Additional photometry . . . 170
9.2.3 Submillimeter observations . . . 172
9.2.4 Herschel observations . . . 173
9.2.5 Spectroscopy . . . 173
9.3 Results . . . 174
9.3.1 Stellar parameters . . . 174
9.3.2 Photometry . . . 180
9.3.3 Disk parameters . . . 180
9.4 Modeling . . . 182
9.4.1 Approach . . . 182
9.4.2 Results . . . 183
9.5 Discussion . . . 188
9.5.1 Comparison of cavity radii with literature values . . . 188
9.5.2 Binaries . . . 189
9.5.3 Accretion . . . 190
9.5.4 Evaluation of color criteria . . . 191
9.5.5 Comparison with Cieza survey . . . 191
9.5.6 Evolution . . . 194
9.5.7 Inner disk . . . 196
9.5.8 Cavity radii and exoplanets . . . 196
9.6 Summary . . . 197
9.B Flux tables . . . 216
Bibliography 221
Nederlandse samenvatting 231
List of publications 237
Curriculum Vitae 239
Acknowledgements 241
1
Introduction
"We live in a universe whose age we can’t quite compute, surrounded by stars whose dis-tances we don’t altogether know, filled with matter we can’t identify, operating in conformance with physical laws whose properties we don’t truly understand."- Bill Bryson: ‘A short
his-tory of nearly everything’
Since the beginning of humanity, people have looked up to the sky and wondered where they come from. Both religion and philosophy played a major role to explain everything we saw that we could not understand. Observing the motions and phenomena in the sky within the human perspective gives only a limited view on what is going on in the Universe. It is then even harder to imagine that there is a link between the Earth we live on, the Sun that rises and sets every day and the twinkling dots in the night sky. The major question throughout history is the place of humans (and their home planet) within the Universe: from Aristarchos who suggested for the first time that the Sun was the center of the Universe instead of the Earth, to Galileo’s discovery of moons orbiting Jupiter, to William Herschel defining the Sun as an ordinary star somewhere in the outer parts of the Milky Way, to exoplanets not quite following the ‘perfect’ configuration of our Solar System. With time, ideologies and philosophical theories were replaced by science and empirical research. Even now, new discoveries are constantly overtaken by the understanding at that time, creating new problems and challenges for scientists to be solved and new ideas to be explored.
One of the most remarkable revolutions was the idea that stars and planets do not live forever, but that they must be born, live and die. The main trigger for this idea was the discovery of nuclear fusion as the main fuel of stars in the beginning of the 20thcentury, which
implies directly that there has to be a beginning and end of the fueling process. The Solar Nebular Hypothesis was already proposed in the 18thcentury by Emanuel Swedenborg and
further developed by Immanuel Kant. This theory contributed to the idea that stars and planets are formed at some stage. It is surprising that the idea of an infinite, unchanging Universe was taken for granted for such a long time, while evidence of birth and death is all around us in every day life. The main reason is again the limitation of the human perspective: the spatial and temporal scales in which things happen in the Universe go beyond our imagination. Even if we put numbers and units to these scales, it is difficult to put a feeling to what it is really like
in the Universe. As a consequence, astronomy was for a long time driven by the development of physics itself.
With the technological innovations and the exponential increase of new telescopes and instruments at wavelengths outside the optical regime in the second half of the 20thcentury, observations did not only confirm or disprove theories, but started to drive new theories. The dawn of every new telescope revealed new objects, new structures, new prospects for our understanding of the Universe. The insight in formation of young stars, disks and planets has been revolutionized by telescopes such asIRAS,SpitzerandHerschelin the infrared, and
JCMT, IRAM, APEX and SMA in the (sub)millimeter, where these objects are shining the brightest.
transition disks in the planet formation process?
The arrival of ALMA, the Atacama Large Millimeter/submillimeter Array, is another
revolution in answering these questions. ALMA is an array of 66 antennas operating at (sub)millimeter wavelengths, built at the Chajnantor plateau in the Atacama desert at 5000 m altitude in Chile. ALMA is an international partnership of ESO, NSF (USA) and NINS (Japan), together with NRC (Canada), NSC and ASIAA (Taiwan), and KASI (Republic of Ko-rea), in cooperation with the Republic of Chile. When finished, the antennas will be equipped with 10 receivers ranging from 30 to 950 GHz (0.3 millimeter up to 1 cm) and placed in configurations with baselines up to 16 kilometer, resulting in spatial resolutions at the mas level. Both the sensitivity and spatial resolution exceed the pioneering millimeter interfer-ometers by two orders of magnitude. Of particular importance for this thesis are the high frequency Band 9 receivers operating at 690 GHz (Baryshev et al. 2015), developed by NOVA (the Netherlands Research School for Astronomy) and SRON (Netherlands Institute for Space Research). ALMA started operations in 2011 with a partially completed array of 16 antennas and 4 receivers with baselines up to 400 meter (0.2" resolution at the highest frequency) and has gradually increased its capacities in the following years. ALMA allows us to zoom in deeper on the birth of planets than any other telescope before, unraveling more questions than we could ever have imagined in the wonder about our origin.
1.1
Stars, disks and planets
1.1.1
Star formation
Stars and planets are ubiquitous in the universe and their formation process has been the sub-ject of decades of study (see reviews e.g. Shu et al. 1987; Williams & Cieza 2011; Armitage 2011; André et al. 2014; Raymond et al. 2014; Helled et al. 2014). Planets are thought to form in protoplanetary disks of gas and dust around young low-mass and intermediate mass (<8
M⊙) protostars (see Figure 1.1 for an evolutionary sequence). These disks are a natural con-sequence of star formation. A star is formed by gravitational collapse of a molecular cloud, where the conservation of angular momentum ensures the spin up of material leading to a flattened, rotating structure around the star, called a‘disk’. The cloud mass is dominated by
the gas with a typical gas-to-dust ratio of 100. In the early phases of evolution the disk is sur-rounded and fed by the protostellar envelope (embedded disk) and simultaneously depositing
material onto the still forming star for a period of a few 105years (Evans et al. 2009; Dunham
et al. 2014). After this, a period of several Myr years starts in which the disk disperses its material, through viscous accretion inside the disk and stellar winds at the disk surface. Since the bulk of the disk mass is in the gas, the gas dominates the dynamical processes in the disk. By some critical point, the disk has lost a large fraction of its gas mass and accretion onto the star has come to an end. Some, if not all planets in the system may already have formed at this stage. The star continues its evolutionary path towards the main sequence until hydrogen fusion starts; by this time the star and its surrounding planets have several billion relaxing years ahead of them until the star has run out of its nuclear fuel. Although the formation of high-mass stars (>8 M⊙) likely follows more or less the same sequence of events, the physical
Prestellar
Core
Class 0 Class I
Class II Class III
Planetary
System
30 000 AU 10 000 AU
300 AU
100 AU 100 AU
50 AU
Figure 1.1:The evolutionary process of star and planet formation. A prestellar core collapses to a protostar still embedded in its envelope. Material keeps falling in and a rotating disk forms around the star. Molecular outflows and accretion remove the envelope material, until only a disk remains. The disk evolves from a massive gas-rich to a gas-poor debris disk, ending as a planetary system. Figure by Magnus Persson.
1.1.2
Planet formation
One of the many open questions is when and how the formation of planets fit into this story. Current statistical studies of exoplanets suggest that most stars in the Milky Way (and perhaps the Universe) hosts at least one planet (Batalha 2014). This conclusion raises the question whether planets are just a natural by-product of disk evolution and star formation. Since the construction of a planet is a long-lasting process taking up millions of years (see Section 1.2), we have to study the structure of their birth cradles, the protoplanetary disks, in order to learn more about the relevant physical processes. This thesis focuses on the structure of the gas and dust in disks, which is now possible due to the sensitivity and spatial resolution of ALMA, which started operations only a few years ago. Interestingly, the Solar Nebular Hypothesis was proposed long before astronomers could prove the presence of circumstellar disks around other stars and study how planets form inside these disks.
1.1.3
Protoplanetary disks
middle of their formation; the presence of disks was not confirmed until several decades later. The main characteristics of this new class of stars pointing to their pre-main sequence status were e.g. their systematically higher brightness compared to main sequence stars of the same spectral type; their overabundance inside dark clouds; and strong optical emission lines such as the hydrogen Balmer lines (e.g. Hα) and Ca II (Joy 1945; Herbig 1957). They were called
T Tauri stars and their massive, bright equivalents the Herbig Ae/Be stars. The latter were
rec-ognized early on as equivalent to T Tauri stars (Herbig 1960), with the distinct difference that
the star is of earlier type and illuminates a reflection nebula, which is a natural consequence of the star being brighter.
Initially the T Tauri/Herbig stars were thus not even known to have disks. T Tauri stars
often show emission excess in the UV with respect to the stellar photosphere, which is not so evident in Herbig stars. At this stage, two types of T Tauri stars were known:classical(CTTS)
andweak-line(WTTS or NTTS: naked TTS), referring to the emission strength and width of
the Hαline. In addition WTTS show strong X-ray emission (e.g. Walter & Kuhi 1981) and
much less UV excess. The first evidence for dust grains surrounding these stars was found through additional emission excess above the photosphere in the infrared up to 5µm (Mendoza
V. 1966). However, the pieces of the puzzle were not put together until the suggestion of a self-luminous viscous accretion disk model to explain the nature of both of these types of excess emission (Lynden-Bell & Pringle 1974; Kenyon & Hartmann 1987). This was also the time that both UV and far infrared data became available through theInternational Ultraviolet Explorer (IUE)and theInfraRed Astronomical Satellite (IRAS)in 1978 and 1983, respectively.
The bright infrared emission with optically visible stars proved that the dust grains could not be distributed in a spherical shell, as this would result in much higher optical extinction. Therefore the emission had to originate from a physically thin structure: a disk. Another piece of evidence for disks was found through optical spectroscopy showing only the blue-shifted component of forbidden line emission: the red-shifted emission is obscured by an occulting disk (e.g. Edwards et al. 1987; Bertout 1989). The recognition and understanding of disks has thus always been strongly driven by new observational facilities, just as this thesis is largely driven by ALMA.
Remarkably, one of the main reasons that T Tauri and Herbig stars were even recognized as a signature of protostellar evolution, is their similarity to high mass counterparts seen in short-lived (and thus recently formed) OB associations, whereas the high-mass star formation process itself remains much less understood. The Herbig stars were studied largely separately from T Tauri stars due to their bright nature and thus easy observability. This terminology splits up the pre-main sequence stars in different categories, whereas they are likely just similar
in nature, albeit with a different spectral type and mass, and thus a different evolutionary pace.
In this thesis we study several disks for a range of spectral types from A-type Herbig to M-type T Tauri stars.
In the decades after the discovery of circumstellar disks through excess emission, they were successfully imaged: the nearbyβPic debris disk in scattered light (Smith & Terrile
1984), the ‘proplyds’ (acronym for protoplanetary disks seen in silhouette against a bright HII region) in Orion with theHubble Space Telescope(O’Dell et al. 1993) and the millimeter
continuum and CO line images showing Keplerian rotation (e.g. Sargent & Beckwith 1987). Accretion was related to UV excess and optical line emission (Kenyon & Hartmann 1987). With the availability of infrared data from IRASandInfrared Space Observatory (ISO)an
This classification (Lada classification) relies on the infrared part of the Spectral Energy Distribution or SED: the (spatially unresolved) photometric spectrum from optical to millime-ter wavelengths. Dust grains are heated by the star and by viscous heating, and emit primarily through thermal emission. As the dust temperature in a disk (or envelope) largely depends on the distance from the central heating source, this results in a broad continuous excess above the stellar photosphere at infrared and longer wavelengths due to the range of temperature in the disk. Disk emission is clearly distinct from envelope emission because a spherical en-velope obscures a much larger fraction of the emission originating from the protostar. With theSpitzer Space Telescopecomplete samples of young stellar objects in nearby star-forming
regions were constructed. From the complete survey of star-forming regions it was possi-ble to compute statistics and derive typical time scales of the different stages in the star and
disk evolution process, which were compared to evolutionary models (e.g. Evans et al. 2009). Disks around young stars were found to be a common feature. At the same time the number of discovered exoplanets was steadily growing, giving more and more evidence that planets around stars are ubiquitous.
1.1.4
Transition disks
stellar photosphere
inner
disk disk
hole ~150 AU 25 AU
Figure 1.2: Spectral Energy Distribution of a transition disk, showing the different compo-nents of the system and their emitting wavelengths. The stellar photosphere emits as a black-body in optical to near-infrared wavelengths, an inner disk is recognized as near-infrared ex-cess above the photosphere due to hot dust grains, the hole is seen as a dip in the mid-infrared, while the bulk of the dust in the outer disk emits in far-infrared up to millimeter wavelengths.
was interpreted as a sign of inner holes or dust clearing (Strom et al. 1989). This group of disks were named ‘transition disks’ (see Figure 1.2), although it remains unclear whether all disks go through a ‘transition disk phase’. Several other disks with cleared inner cavities were identified 10-15 years later through dips in their Spitzer IRS spectra (5-35µm) (Forrest et al.
2004; Calvet et al. 2005; Brown et al. 2007).
In this transitional phase a range of processes were thought to be responsible for the ap-pearance of a cavity (see also next section): (1) grain growth, where dust grains inside the cavity have grown to larger sizes that do not emit sufficiently at the observed wavelength; (2)
photoevaporative clearing, where the stellar UV heats gas to temperatures above the escape speed, resulting in a photoevaporative wind that clears the disk from the inside out; (3) certain instabilities leading to dust concentrations in the outer disk; (4) companion clearing, where either a planet or a star carves a gap in the dust and gas in their orbit.
grain growth
wind
interaction
with planet
cavity
trapping
trapping
cavity
cavity
cavity
1 AU 10 AU 100 AU
1 AU 10 AU 100 AU
1 AU 10 AU 100 AU
1 AU 10 AU 100 AU
instabilities
photo
evaporation
Figure 1.3: Cavity clearing mechanisms in dust (black dots) and gas (yellow). Top left: increased grain growth inside the cavity, while the gas density remains unchanged compared with the original disk. Bottom left: photoevaporative clearing, with both the gas and dust cleared simultaneously from the inside out.Top right:clearing by a companion, in which the gas density inside the cavity drops and the large dust particles get trapped at the edge.Bottom right:instabilities due to e.g. viscosity or entropy gradients create a dust trap, the gas density remains unchanged. Figure based on cartoon by Simon Bruderer.
The discovery of transition disks thus opened up an interesting possibility of studying the most important disk evolution processes for understanding planet formation. Most observa-tional studies of transition disks have focused on the dust distribution in these disks, while the key for distinguishing between the mechanisms lies in the gas, which is predicted to be different in all cases (see Figure 1.3): the gas density is unaffected by grain growth and certain
instabilities, is cleared completely by photoevaporation from the inside out and is reduced in case of companion clearing depending on the companion mass and disk viscosity (Lubow & D’Angelo 2006; Crida et al. 2006; Pinilla et al. 2012a).
of ALMA. In this thesis we quantify the gas distribution directly with resolved ALMA obser-vations of several transition disks in order to answer the questions of their underlying clearing mechanism and their role in planet formation and disk evolution.
1.2
Disk processes
With a large range of observations of the planet birth cradles, the step towards solving the puzzle of planet formation itself appears to be close, but this could not be further from reality: although increasingly sophisticated evolution models explain a large range of disk properties and physical processes, planet formation itself remains a mystery, as any theory that has been developed so far ultimately breaks down when compared to the actual time scales and exo-planet properties. Transition disks are promising candidates with active exo-planet formation. The spatially resolved ALMA observations of gas and dust presented in this thesis can be com-pared directly with physical disk processes to get a better understanding of their role in disk evolution.
1.2.1
Dust evolution
MIR
Scattered Light
(sub-)mm
1 100
Distance in AU
0.35 mm 3.0 mm ALMA
10
1 2 3
4 a
b
c d
1Turbulent Mixing (radial or vertical) Vertical Settling
Radial Drift a) Sticking b) Bouncing
c) Fragmentation with mass transfer d) Fragmentation
2
3
4
10 µm
2 µm 10 µm
VLTI/MATISSE EELT
JWST/MIRI
Figure 1.4: Dust processes in the disk. The left part shows the physical processes affecting the dust grains in the disk, as described in the text. The right part shows which section of the disk is observed at different wavelengths, as discussed in Section 2.3. Figure taken from Testi et al. (2014).
velocities (which in turn are affected by turbulence, drift, mixing and location in the disk) and
the grain stickiness (composition, icy layers and fluffiness or shape). Dust evolution requires
numerical modeling, with constraints on the collision outcomes set by laboratory experiments (Blum & Wurm 2008). Dust growth models show that ISM grains can indeed efficiently
grow to millimeter sizes within 105year time scales (Brauer et al. 2008). However, growth is
stymied by several processes, including fragmentation and drift.
The most important issue is the presence of gas in the disk, which prevents dust particles from moving freely: they experience a drag force (depending on their physical size) when they move relative to the gas. One of the consequences is vertical settling: larger dust particles settle to the midplane of the disk due to damping of the drag force, although turbulent mixing partially opposes the effect. The vertical structure of dust particles is thus an equilibrium
between settling and mixing (e.g. Dullemond & Dominik 2004). Another consequence is the
radial drift problem(Whipple 1972; Weidenschilling 1977). Dust and gas orbit in Keplerian
motion in a protoplanetary disk, due to gravitational and centrifugal forces. However, the gas feels an additional pressure force, due to the outward pointing pressure gradient in the disk, resulting in slightly sub-Keplerian velocities of the gas. This causes a head-wind or friction for the dust particles, which consequently lose angular momentum and spiral inwards on short time scales: typically 100 years for a one-meter-sized object at 1 AU or a millimeter-sized dust grain at 100 AU, since the efficiency of this phenomenon depends on the dust particle size and
orbital time scale. This ‘meter-size-barrier’ prevents particles to grow to larger pebbles, which is a crucial first step in planet formation. Radial drift also predicts that larger grains are radially more concentrated than the gas in a protoplanetary disk.
If the drift barrier can be overcome, the fragmentation barrier limits dust to grow beyond 1 meter in the outer disk. Fragmentation occurs when larger particles collide with relatively high velocities (Brauer et al. 2008). In principle this problem can be overcome when additional dust growth mechanisms such as sweep-up and mass transfer are included (Xie et al. 2010; Windmark et al. 2012). However, the radial drift problem can not be solved by dust processes alone.
1.2.2
Disk dynamics and dust trapping
A possible way to overcome the radial drift problem is to trap dust particles in so-called pres-sure bumpsin the gas. A local region of high pressure in the outer disk provides a negative
pressure gradient outwards, reversing the drift direction and effectively trapping the dust
par-ticles (Whipple 1972). Anti-cyclonic vortices in disks were suggested first to act as pressure bumps (Barge & Sommeria 1995; Klahr & Henning 1997).
1.2.3
Planetesimal and planet formation
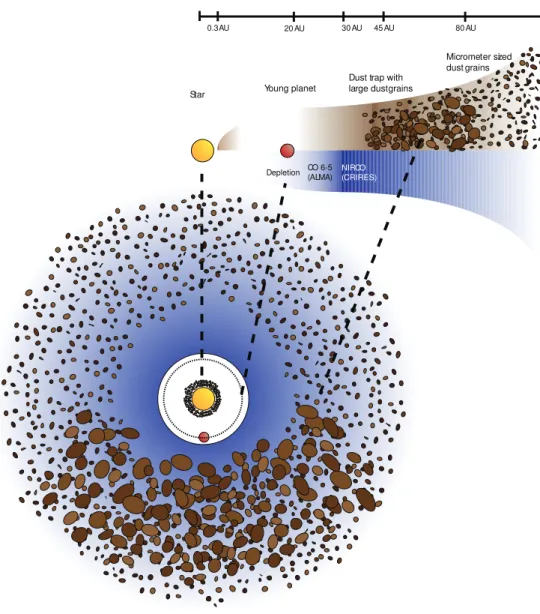
In general, a radial pressure trap would result in a ring of millimeter-sized particles, while an azimuthal maximum such as seen in a vortex would result in an asymmetric millimeter-dust distribution (Wolf & Klahr 2002; Regály et al. 2012; Birnstiel et al. 2013). In this thesis we present the first clear observational evidence for such a dust trap in the Oph IRS 48 disk. Other transition disks imaged by ALMA show asymmetric dust distributions (Casassus et al. 2013; Pérez et al. 2014). Trapping depends on the particle size, so smaller particles are predicted to spread further throughout the disk and continue to flow inwards through the gap. This radial segregation of small vs large particles is also referred to as dust filtration (Rice et al. 2006). On the other hand, larger centimeter-sized dust particles are expected to be even further concentrated in a dust trap, either radially or azimuthally. This is indeed found for the dust trap in IRS 48 as well.
Time-dependent dust evolution models show that dust not only gets trapped but also grows more efficiently inside these traps, as fragmentation is lower due to a decrease in relative
velocities (Brauer et al. 2008). Growth continues up to planetesimal sizes, which can then grow further to rocky planets through runaway or orderly growth, as their own gravitational field starts to attract planetesimals in their surroundings. Once a rocky planet of>10 Earth
masses has been formed, thecore accretionmodel predicts the formation of a gas giant, where
the planet accretes gas from the disk. This implies that the rocky core needs to be formed before the gas disk has dissipated. Alternativelygravitational instabilitycan result in disk
fragmentation and quick gas giant formation (e.g. Helled et al. 2014). Both models have difficulties explaining the observed exoplanets and their orbital radii, also due to the expected
migration of planets through the disk-planet torques.
0.8
0.6
1.0
0.4
0.0
1.0
1.5
2.0
2.5
3.0
0.2
negative pressure gradient
positive pressure gradient Gap opened by a massive planet
Particle Trap
Σ / Σ
0
r (
r
planet)
1.2.4
Disk dispersion and photoevaporation
Although planet formation is one of the major drivers for disk studies, it is not the main reason why disks disappear: observations of both the Solar System and exoplanets show that planets contain only-1% of the initial disk mass. Instead, the main mechanisms for disk dissipation are accretion onto the star and photoevaporation (Hollenbach et al. 2000; Gorti et al. 2009; Alexander et al. 2014): stellar and interstellar high energy radiation (UV and/or X-rays) heats
the disk surface to higher temperatures, up to the point where the thermal energy exceeds the gravitational binding energy and the heated gas escapes as a photoevaporative wind. Disk dispersal by photoevaporation becomes important when the accretion rate from the disk onto the star drops below the photoevaporation rate: at that point the material in the inner part of the disk is no longer replenished by the outer disk and will disappear from the inside out on time scales of∼105years. Transition disks with cleared out cavities have been suggested to be
caused by photoevaporation, but disks with large cavities (R>20 AU) which are still strongly
accreting cannot be explained by photoevaporation models only (Owen & Clarke 2012).
1.3
Observations
Disk theories are developed from a theoretical point of view, in attempts to explain planet for-mation, and directly driven by disk observations. New observations provide better constraints but also raise new questions: the measurement of millimeter fluxes in disks confirmed larger particles in disks than in the ISM (Beckwith & Sargent 1991) but set the challenge of solving the radial drift problem; the discovery of the stellar companion of CoKu Tau 4 solved the question of its large cavity (Ireland & Kraus 2008) but binarity could not explain other transi-tion disks; scattered light imaging confirmed a gap in the small dust grains in some disks but did not reveal a cavity in others (e.g. Follette et al. 2013); large cavity sizes were confirmed by millimeter interferometry observations (Andrews et al. 2011), but they were generally too large to match with exoplanet orbital radii (planet clearing mechanism) or photoevaporation models. This thesis combines the results of several of the studies mentioned above with new ALMA data and resolves some of the issues.
1.3.1
SEDs
One of the difficulties of disk observations is their low mass (only a fraction of the cloud mass)
and thus total flux and their angular size: due to the distances of the nearby star-forming re-gions of∼100-200 pc, disks are typically only a few arcseconds in size. Their detection and identification was relatively easy when the first infrared observations became available throughIRASphotometry in the 1980s. However, resolving disks was only possible for the
proplyds in silhouette against a bright background until the arrival of the first millimeter inter-ferometers in the early 2000s. Fortunately, even SEDs consisting of unresolved photometry fluxes provide important information on the structure of the dust disk, especially transition disks. As the dip in the mid infrared part of the SED is the main signature of a transition disk, theSpitzer Space Telescopewith a wavelength range from 3.6 up to 70µm was by far the most
important tool to recognize and study transition disks. All nearby star forming regions were observed in the Cores to Disks (c2d) and Gould BeltSpitzerprograms, and several transition
disks were discovered by observations with theSpitzerIRS spectrograph 5-35µm range.
Disk structure in the SED The SED of a transition disk consists of signatures of the
disk in the near-infrared and the outer dust disk at wavelengths from mid-infrared up to mil-limeter emission (Figure 1.2). The continuum emission at long wavelengths probes the cold, optically thin millimeter-sized dust. Some disks have a strong near-infrared excess while oth-ers do not, implying systems with and without an optically thick inner disk. Espaillat et al. (2007) interpret the existence of these two types of systems as an evolutionary effect and name
them pre-transitional and transitional, respectively, as clearing by a companion would first just clear a gap and later remove the inner disk entirely. However, as the clearing mechanism is unknown for most disks and as material needs to continue to flow through the gap to explain the accretion onto the star, one needs to be careful with interpreting this observational diff
er-ence as a real evolutionary sequer-ence. Her-ence the term pre-transitional disk will not be used in this work.
Identifying transition disks A transition disk is often identified in the SED by comparison
with a representative disk (usually the median SED of disks in the well-studied Taurus star forming region): typically the excess between 5 and 20µm is lower in a transition disk while
the SEDs are similar at longer wavelengths. A problem of photometry is confusion: the large beam size ofIRAScould contain multiple young stellar objects, as they are often grouped
to-gether, leading to overestimating the excess emission and the false presence of a mid-infrared deficit. TheSpitzerbeam was better at the longest wavelengths where the beam is largest,
with a 70µm beam size of 15”, similar to single dish submillimeter observations. Photometry
of theHerscheltelescope with a 4 times larger mirror has revealed cases ofSpitzerconfusion
of objects at 70µm (Ribas et al. 2013).
With the large surveys fromSpitzer, several criteria of infrared colors have been developed
in order to select transition disk candidates from surveys, which have been tested against sources with full IRS spectra available (e.g. Brown et al. 2007; Hernández et al. 2007; Cieza et al. 2010; Merín et al. 2010). In this thesis we present a study of a large transition disk candidate sample, using color criteria on theSpitzercatalogs.
Modeling transition disks For a proper assessment of the disk structure and its cavity,
SED modeling with a radiative transfer code is required, such as RADMC, MCFOST and McMAX (Dullemond & Dominik 2004; Pinte et al. 2006; Min et al. 2009). These codes calculate the expected dust emission based on a given 2D density structure by computing the dust temperature at all locations in the disk from the scattering and absorption of photons from a central star. The density structure of a transition disk is usually assumed to be a radially decreasing surface density law with a sharp cavity in the inner part of the disk and, if required by near-infrared excess, an inner disk close to the star (see Figure 1.6). The vertical structure (flaring or settling) is either calculated from hydrostatic equilibrium or parametrized. The vertical structure is particularly important. A flaring disk intercepts more radiation in the outer part of the disk, while a high scale height in the inner disk and at the wall edge can cast a shadow on the outer disk, lowering the temperature and thus the emission at far-infrared and longer wavelengths. Dust opacities are a key ingredient for any radiative transfer model and require assumptions about the dust composition and grain size distribution. Silicate and polyaromatic hydrocarbon (PAH) features that are sometimes seen in the mid-infrared spectrum set constraints on the dust composition (e.g. Kessler-Silacci et al. 2006). Transition disks have been successfully fit with SED modeling, in particular those SEDs for which IRS spectra with fluxes between 5-35µm were available (Brown et al. 2007; Merín et al. 2010).
Figure 1.6:Typical dust density structure for modeling a transition disk.
of dust in the inner disk, which influence the derived cavity size.
Time domain studies of SEDs have shown so-called ‘seesaw’ variability in some transition disks where the slope of the infrared spectrum changes with time on time scales of weeks up to years. This suggests changes in the inner disk structure with time although it remains unclear what causes this behaviour (Muzerolle et al. 2009; Espaillat et al. 2011).
1.3.2
Gas observations
Whereas the dust distribution in disks has been studied to great detail, observational con-straints on the gas distribution are rather limited, while the gas is considered to be dominating the disk properties such as mass and dynamical processes. In particular, the clearing mecha-nisms for transition disks described above have similar effects on the dust distribution, while
the gas is affected in completely different ways and provides thus a way to distinguish between
them (see Figure 1.3). Photoevaporation removes the gas and dust simultaneously, a compan-ion would lower the gas density and trap the millimeter-sized dust at the edge and instabilities (and grain growth) would not significantly change the gas density inside the cavity at all. In particular, in case of a companion, planet-disk interaction models have shown that knowing the depth and shape of the gas gap could set constraints on the disk viscosity and planet mass (Crida et al. 2006; Pinilla et al. 2012a). Measuring the gas density inside and outside the dust cavity is thus a crucial step in understanding the transition disks, which is the main topic of this thesis.
Molecular line observations The reasons for the limited amount of gas observations to date
are the low line sensitivity compared to continuum sensitivity for most instruments, confusion with surrounding envelope material (for single dish observations) and lack of direct density tracers. While the bulk of the gas mass is in H2, its molecular lines cannot be used as mass
challenging. CO rotational emission cannot be translated directly into mass for several rea-sons. First, the12CO and13CO lines are usually optically thick. Second, the gas temperature
is decoupled from the dust temperature, especially in the higher layers in the disk. Third, the CO abundance is not constant with respect to H2: in the surface layers CO is
photodis-sociated by stellar radiation; in the mid-plane the CO freezes out onto the dust grains due to the low temperatures; and the chemical formation/destruction of CO depends strongly on the
local density, temperature and radiation conditions (van Zadelhoffet al. 2001; Woitke et al.
2009). Even though the gas motion is Keplerian, the line-of-sight velocity is confused by contributions from different parts of the disk and it is almost impossible to derive mass
infor-mation from unresolved spectra alone. Spatially resolved observations in combination with a physical-chemical modeling tool for proper interpretation of the emission are thus required for study of the gas density distribution.
The physical-chemical modeling tool developed for the purpose of interpreting molecular line emission in disks and in particular transition disks in this thesis is DALI (Dust And LInes) (Bruderer et al. 2012; Bruderer 2013). The DALI code first solves the dust radiative transfer in 2D for a given density structure and stellar radiation field. With the derived dust temperatures as starting point, the heating-cooling balance of the gas and chemistry are solved simultane-ously to determine the gas temperature, molecular abundances and molecular excitation. All effects discussed above are thus taken into account. Special attention is paid to the chemistry
and heating inside the dust-free cavities (Jonkheid et al. 2006). The resulting CO abundance in the disk in combination with the gas temperature determine the intensity and profile of the CO line emission in the final step, the ray tracer. The code is summarized in Figure 1.7. For CO isotopologues it was shown that isotope-selective photodissociation plays an important role: without the inclusion of this effect the column density based on C18O observations can
be severely underestimated (Miotello et al. 2014). In this thesis we have used DALI to analyze the gas structure in several transition disks.
Density structure Stellar spectrum
Chemistry: abundance
Excitation levels
Thermal balances Continuum radiative transfer
Raytracing molecular lines dust temperatures
abundances & gas temperatures
Figure 1.7:DALI modeling structure. The input of the model is a 2D density structure and a stellar spectrum. Using dust radiative transfer (based on RADMC), the dust temperatures are calculated. DALI then solves the heating-cooling balance of the gas to determine molecular abundances, temperatures and excitation before raytracing spectra and spectral line cubes.
comparable approach as DALI. Other codes to interpret gas line emission are e.g. ANDES (Akimkin et al. 2013) and the code developed by Gorti & Hollenbach (2004).
Gas inside the cavity The presence of accretion in the majority of the transition disks
sug-gests that some gas must still be present inside the dust cavities. This gas is hotter than in the outer disk and can be traced by ro-vibrational and atomic lines, which can reveal the pres-ence and kinematics of molecules, but no global density information. Ro-vibrational CO line observations at 4.7µm of several bright transition disks reveal Keplerian gas down to radii
smaller than the dust cavity radius using the spectroastrometry technique for e.g. Oph IRS 48, SR 21 and HD135344B (Pontoppidan et al. 2008; Brown et al. 2012a), which are key targets in this thesis. For other disks, the CO line observations are often single-peaked, con-sistent with a photoevaporative wind (Bast et al. 2011; Brown et al. 2013), previously seen in [Ne II] line emission (Pascucci et al. 2007; Lahuis et al. 2007). However, although these results are promising, they do not indisputably reveal the gas surface density structure and thus the mechanism responsible for the transition disk. The ALMA observations presented in this thesis reveal deep drops in the gas density inside the dust cavity, where the gas cavity is smaller than the dust cavity, hinting directly at the presence of embedded planets. The proper interpretation was possible due to the use of the DALI model.
Disk chemistry The chemical composition of planet atmospheres is related to the chemical
composition of the disk. Emission originating from the outer disk from simple molecules such as HCO+, CS, HCN, CN, H2CO, N2H+and H2O have been detected in several disks in
rotational line emission (Dutrey et al. 1997; Thi et al. 2004; Dent et al. 2005; Öberg et al. 2011; Hogerheijde et al. 2011, e.g.). Herschel observations reveal the presence of highJH2O, CO,
[O I], OH, CH+and [C II] lines originating from the hot surface layers of the disk (Meeus et al.
2012; Fedele et al. 2013). An interesting aspect is that the chemical complexity is observed to be higher for T Tauri stars compared to Herbig stars despite their lower stellar brightness: the larger FUV luminosities of the Herbig stars leads to more efficient photodissociation of
molecules. Complex organic molecules in disks form the building blocks of life on planets. However, the chemical variation in disks detected to date is rather low: apart from the simple molecules mentioned above, slightly more complex molecules c-C3H2(Qi et al. 2013a) and
CH3CN (Öberg et al. 2015) have only recently been detected in transition disks by ALMA.
This is surprising, as the presence of a cavity allows a view into the normally hidden mid-plane composition. Many complex molecules are expected to be formed and locked up in ices in a disk, but the directly UV irradiated wall in a transition disk should result in increased photodesorption of these ices (Cleeves et al. 2011).
1.3.3
Millimeter observations
Interferometry Resolved imaging of the dust continuum at (sub)millimeter wavelengths in
2012). The quality of the images was also low because of the limitedu,v-coverage (spatial
scales) of the observations, due to the small number of antennas. With the larger number of antennas of ALMA the issues of sensitivity andu,v-coverage are largely resolved for imaging
these disks.
The analysis of the pre-ALMA data, using radiative transfer codes, was performed on the interferometric visibilities, which show a Bessel function in case of a ring, where the first "null" (crossing of zero) is a measure of the ring size. The basic modeling structure was a surface density with a sharp dust cavity wall with cavity radii of ∼15-75 AU and an empty dust gap, but the dynamic range of the images was limited and the inner disk was set by the SED with all its caveats. Alternative models suggested that a smooth cavity wall fits equally well (Isella et al. 2012) and that some dust may still be present inside the gap (Isella et al. 2010a; Mathews et al. 2012). For some disks it was already known that gas was present inside the cavities as well (e.g. Pontoppidan et al. 2008).
It is important to recognize that modeling disk structure was (and is) not dictated by theo-retical models of disk clearing mechanisms, but by a simple parametrization based directly on the observations with limited parameter space due to the large number of uncertainties, both in the data and in the modeling assumptions. However, the deep millimeter cavities could rule out grain growth in the inner part of the disk as a transition disk mechanism: although grain growth in the inner part of the disk results in a dip in the SED, the grains do not grow sufficiently large to stop emitting at millimeter wavelengths (Birnstiel et al. 2012).
Interfero-metric imaging was very time expensive; multiple nights in different array configuration were
required to cover sufficient spatial scales and the sensitivity was limited to observations of the
brightest disks. With the large number of antennas of ALMA it is now possible to get high S/N images of the millimeter-dust structure within hours.
Dust opacity Millimeter continuum emission is usually optically thin and originates from
the cold outer disk. The dust opacityκν represents the level of warm dust emissivity per unit mass, depending on composition, porosity and size distributionn(a)of the dust grains. In generalκν ∼ νβ, where the spectral indexβis sensitive to the maximum particle size in
n(a)(Draine 2006). The small dust grains in the interstellar medium have a typical value of
β∼1.7. For a dusty disk with a power-law size distribution and a maximum grain size of∼1
millimeter this results inβvalues lower than 1. At a specific observing wavelengthλobs, the
emission is sensitive to dust particles up to 3λobs. Althoughβcan not be measured directly,
in the Rayleigh-Jeans tail of the SED (where the dust is optically thin), the spectral slopeαmm given byFν ∼ναmm can be used to deriveβusingβ≈αmm−2. The observational parameter
αmmcan thus be used as a probe of dust growth.
Observing dust growth The detection of multi-wavelength millimeter emission with low
values ofβhas confirmed dust growth up to at least millimeter-sized grains in protoplanetary
disks as the start of planet formation (e.g. Beckwith & Sargent 1991; Andrews & Williams 2005, 2007a; Rodmann et al. 2006; Lommen et al. 2009; Ricci et al. 2010a,b). Dust evolution models predict that in absence of pressure maxima the continuum emission will be radially concentrated due to the radial drift (Birnstiel & Andrews 2014). This has been observed several protoplanetary disks in spatially resolved millimeter observations, indicating a radially increasing spectral slopeβ(r)(Guilloteau et al. 2011; Pérez et al. 2012). The global value of
βin transition disks is higher than in normal disks due to the removal of large grains inside
2013). This effect is studied in this thesis for three transition disks using ALMA and VLA
observations.
1.3.4
Infrared observations
Infrared imaging has been used to probe the small dust grains in the hot surface layers of the inner part of the disk. The brighter Herbig disks are most suitable for these observations, al-though some T Tauri stars have been imaged as well. Scattered light or polarimetric imaging in the near-infrared is a particularly useful tool for high spatial resolution images. Polari-metric imaging of transition disks has been done with VLT/NACO (e.g. Quanz et al. 2011;
Garufi et al. 2013) and in the SEEDS survey with Subaru/HiCIAO (e.g. Thalmann et al. 2010;
Muto et al. 2012; Follette et al. 2013) in H and K bands. These observations have revealed a large variety of features in the small dust distribution: spiral arms, warps, gaps and dips. Remarkably, the dust gap seen at infrared wavelengths, if present, is often smaller than the millimeter-dust cavity. In some cases no gap is seen, although it could simply be smaller than the mask that is used to block the stellar light. Future observations with SPHERE and GPI are expected to reveal even more detail, at< 0.1” spatial resolution. Dust filtration/trapping by
a planetary companion has been suggested as a possible reason for the discrepancy between the millimeter/micrometer-sized dust grain cavities (Dong et al. 2012; de Juan Ovelar et al.
2013).
At longer infrared wavelengths the thermal radiation of the cavity wall dominates the dust emission. Mid-infrared imaging with e.g. the VLT/VISIR instrument has resolved dust
cavi-ties of several bright transition disks (Geers et al. 2007; Maaskant et al. 2013), including IRS 48, which is used in this thesis as a comparison between small grains and large millimeter grains seen by ALMA. Infrared interferometry with VLTI and the Keck Interferometer pro-vides only limited imaging due to the lowu,v-coverage, but by modeling the visibilities it was
found that the gaps of a handful of transition disks were indeed largely depleted of dust (Olof-sson et al. 2011) and evidence was found for a smooth rather than sharp cavity edge (Mulders et al. 2013).
The combination of infrared and millimeter observations and theoretical models in the last decade have thus shown several hints for dust trapping in transition disks. However, it was not until spatially resolved observations of gas and dust became available with ALMA that clear evidence for dust trapping was found.
1.4
This thesis
The advent of ALMA has revolutionized our view on transition disks, giving unprecedented spatial resolution and sensitivity in (sub)millimeter observations. For the first time, the sen-sitivity is sufficient to resolve the dustand the gas at high S/N, connecting the dots in the
complex framework of transition disks. The main questions we aim to answer in this thesis are: What is the gas density structure inside transition disk cavities? What does that tell us about their origin and the properties of any embedded planets? Can we find observational evidence for dust trapping in these disks? What can statistical studies of a broad sample of transition disks tell us about their role in evolution?
could now finally be quantified through ALMA CO rotational line observations and the mod-eling program DALI. The first disk studied was Oph IRS 48, a Herbig star in the star forming region Ophiuchus (d=120 pc) with a known micrometer-dust ring at 55 AU from mid-infrared
observations. PAHs are found inside this dust cavity and a hot CO gas ring is seen at 30 AU. Subsequently a sample of 7 other disks have been observed and modeled to draw more general conclusions.
• In Chapter 2, the discovery of an azimuthally asymmetric dust trap in IRS 48 is pre-sented through ALMA Band 9 observations of the 690 GHz continuum and the12CO
6–5 lines. The azimuthal asymmetry came as a total surprise, as the millimeter-dust continuum was only a by-product of the requested line observations. The millimeter-sized dust shows peanut-shaped emission on one side of the disk at 60 AU radius, in contrast with the CO and the mid-infrared emission which are consistent with ring-like emission. The system could be modeled as a disk with a vortex, caused by a Rossby-wave instability of a radial pressure bump generated by a massive planet.
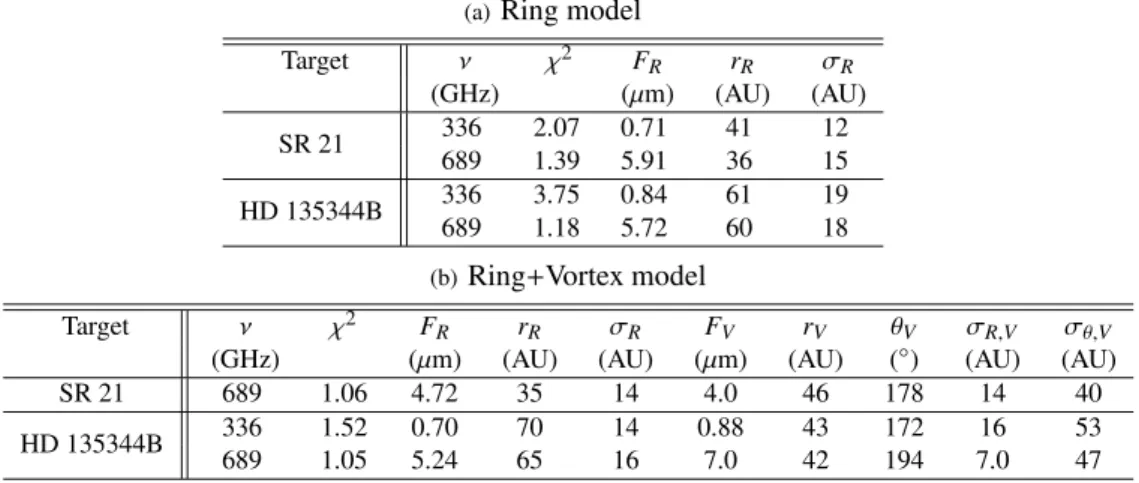
• Chapter 3 and 4 continue the exploration of the dust trap scenario: the concentration of dust grains inside the IRS 48 dust trap is confirmed through spatially resolved VLA observations of centimeter grains. Chapter 4 presents spectral index variations in SR 21 and HD135344B from 345 and 690 GHz ALMA observations, which are compared with dust evolution models to test the validity of the trapping model for these transition disks.
• In Chapter 5, the12CO 6-5 observations of IRS 48 are modeled in more detail using the physical-chemical modeling code DALI. The gas disk is found to have two drops in the density distribution: one within 20 AU and one within 60 AU, suggesting the presence of multiple planets.
• In Chapter 6 ALMA Early Science observations of six other well studied transition disks are analyzed with DALI to derive the gas and dust density structures. The dust surface density and in particular the cavity size is constrained by a simultaneous fit of the SED and the 690 GHz continuum visibilities. The density drop of the dust inside the cavity is at least a factor of 1000 for all disks. Assuming a gas-to-dust ratio of 100 in the outer disk, the12CO 6–5 line data are fit using the same surface density model, but
with different drops in the gas density inside the cavity. For five of the disks, the drop
in gas density is found to be less deep than the drop in dust density, which is consistent with the planet clearing scenario.
• Chapter 7 continues the analysis of gas inside cavities through spatially resolved13CO and C18O observations of four disks: IRS 48, DoAr 44, SR 21 and HD 135344B. The
last two disks were also part of the12CO analysis of Chapter 6. The CO isotopologues
suffer less from optical depth and are more direct column density tracers. For three of
these disks, the CO observations clearly show gas cavities smaller than the dust cavities, which is a direct hint of clearing by planets. The observations are compared with the outcome of planet-disk interaction models to estimate the mass of the embedded plan-ets. Also, in this analysis the isotope-selective CO photodissociation model is applied, resulting in a more robust derivation of the disk mass through C18O emission.
• Chapter 8 zooms in on the chemistry in IRS 48. We present the discovery of warm H2CO in the IRS 48 disk from ALMA observations and set an upper limit on the
abun-dance of this molecule with respect to H2of 10−8. Upper limits for several other
• Finally, in the last chapter, a large SED survey of 200Spitzer-selected transition disk
candidates is presented. The candidates are selected using color criteria derived by Merín et al. (2010) from theSpitzercatalogs and spectroscopy of nearby star-forming
regions. SEDs are constructed from optical, 2MASS andSpitzerphotometry,
comple-mented by newWISE,Herscheland (sub)millimeter data. Spectral types are derived
from a large optical spectroscopy program. Using RADMC modeling, the SEDs are modeled to infer the cavity sizes. The survey has resulted in at least 70 new candidate transition disks with large inner cavities, that can be followed up by ALMA observa-tions.
Each chapter ends with its conclusions based on the presented data. Overall the main conclusions from this thesis are:
• The first unambiguous evidence for a dust trap in a transition disk has been found through combined micrometer, millimeter and centimeter observations (Chapter 2,3). This discovery confirms theoretical predictions that have been made in the last three decades. This conclusion is strengthened by spatial variations in the millimeter spectral index (Chapter 4).
• All transition disks that have been studied with CO observations in this thesis show that gas is present inside the dust cavity. The gas cavity is smaller than the dust cavity and the gas density drops by a factor of 100-1000. This indicates that planets are embedded in these disks which have cleared their orbit and trapped the millimeter dust in a ring around it (Chapter 5,6,7).
• Color criteria provide a robust method to select good transition disk candidates with large dust cavities fromSpitzercatalogs (Chapter 9).
1.5
Outlook
ALMA has revolutionized our view of transition disks, making a direct connection with dust trapping models and zooming in on the gas structure inside the dust cavities. The observations presented in this study were taken in ALMA Early Science, with baselines of less than 1 kilometer. In the coming years observations will be taken with very long baselines up to 10-15 kilometers, providing spatial resolution of milliarcseconds, such as shown in the astonishing image of dust rings in the HL Tau disk (ALMA Partnership et al. 2015).
Observing other transition disks at such high resolution will allow us to measure the gas structure to much better detail, constraining the shape of the gaps to the precision of theoret-ical disk models and resolving dust and gas cavities as small as a few AU. Direct detection of planets inside disks remains challenging, but has been done in a few cases (Huélamo et al. 2011; Kraus & Ireland 2012; Quanz et al. 2013; Reggiani et al. 2014; Quanz 2015). Mea-suring the shape of the gas cavity will allow us to determine properties of embedded planets indirectly, leading to the earliest view on these recently formed planets. The high spatial res-olution will allow the detection of circumplanetary disks as well, another indirect method of detecting planets in a disk. ALMA also has the sensitivity to observe less massive transition disks, so the sample is no longer restricted to the brightest known disks studied so far. Measur-ing cavities down to a few AU radius and disk masses down to less than a Jupiter mass means a much more complete picture of transition disks, which will give us a better understanding of their origin. Are multiple mechanisms responsible for the cavities? Are there different classes
Multi-wavelength observations of the dust continuum at high spatial resolution will give further constraints on dust growth in disks, by measuring spectral index variations as a func-tion of posifunc-tion in the disk. The Band 9 observafunc-tions that were used in this thesis to show spectral index variations have the limitation that the dust is likely optically thick at this wave-length. With the longer baselines of ALMA, high spatial resolution can be achieved also at longer wavelengths where the dust becomes optically thin. The ongoing Disks@EVLA key program will observe 66 disks at centimeter wavelengths, which can be compared directly with millimeter observations. The multi-wavelength approach provides information on dust grain sizes in disks, which is crucial for dust evolution theories and understanding the start of planet formation.
Large disk surveys of Class II and Class III objects with ALMA in gas and dust may finally connect the link between the gas-rich primordial disks and gas-poor debris disks: ALMA observations of a handful of bright debris disks have already revealed that gas is still present in some of these disks, possibly second-generation gas due to icy planetesimal collisions (e.g. Kóspál et al. 2013; Dent et al. 2014). Perhaps transition disks and debris disks are more closely linked than previously thought.
Finally, the ALMA sensitivity will increase further, and some complex molecules are ex-pected to be detected in disks in the coming years (Öberg et al. 2015). Knowing the chemical composition of disks will answer important questions about the composition of exoplanet at-mospheres and, ultimately, the origin of life.
Other telescopes and instruments will also contribute to an even better understanding of transition disks. The VLT SPHERE instrument has just started operations, creating beautiful scattered light images of the small dust grains in disks at less than 0.1" resolution that can be compared directly to the millimeter dust in ALMA observations. Infrared spectroscopic observations with future facilities such as the James Webb Space Telescope, theEuropean Extremely Large Telescope and the Thirty Meter Telescope will zoom in on the hot inner
2
A major asymmetric dust trap
in Oph IRS 48
van der Marel, N.; van Dishoeck, E. F.; Bruderer, S.; Birnstiel, T.; Pinilla, P.; Dullemond, C. P.; van Kempen, T. A.; Schmalzl, M.; Brown, J. M.; Herczeg, G. J.; Mathews, G. S.; Geers, V.
A Major Asymmetric Dust Trap in a Transition Disk.2013, Science, 340, 1199V
Abstract
The statistics of discovered exoplanets suggest that planets form efficiently. However, there
are fundamental unsolved problems, such as excessive inward drift of particles in protoplan-etary disks during planet formation. Recent theories invoke dust traps to overcome this prob-lem. We report the detection of a dust trap in the disk around the star Oph IRS 48 using observations from the Atacama Large Millimeter/submillimeter Array (ALMA). The
0.44-millimeter-wavelength continuum map shows high-contrast crescent-shaped emission on one side of the star originating from millimeter-sized grains, whereas both the mid-infrared image (micrometer-sized dust) and the gas traced by the CO 6-5 rotational line suggest rings centered on the star. The difference in distribution of big grains versus small grains/gas can be modeled
2.1
Main article
Although the ubiquity of planets is confirmed almost daily by detections of new exoplanets (Batalha et al. 2013), the exact formation mechanism of planetary systems in disks of gas and dust around young stars remains a long-standing problem in astrophysics (Armitage 2011). In the standard core-accretion picture, dust grains must grow from submicrometer sizes to rocky cores of∼10 MEarthwithin the∼10 million year lifetime of the circumstellar disk. However, this growth process is stymied by what is usually called the radial drift and fragmentation barrier: Particles of intermediate size (∼1 m at 1 AU, or∼1 mm at 50 AU from the star) acquire high drift velocities toward the star with respect to the gas (Whipple 1972; Weiden-schilling 1977). This leads to two major problems for further growth (Brauer et al. 2008): First, high-velocity collisions between particles with different drift velocities cause
fragmen-tation. Second, even if particles avoid this fragmentation, they will rapidly drift inward and thus be lost into the star before they have time to grow to planetesimal size. This radial drift barrier is one of the most persistent issues in planet formation theories. A possible solution is dust trapping in so-called pressure bumps: local pressure maxima where the dust piles up. One example of such a pressure bump is an anticyclonic vortex which can trap dust particles in the azimuthal direction (Barge & Sommeria 1995; Klahr & Henning 1997; Birnstiel et al. 2013; Casassus et al. 2013).
Using the Atacama Large Millimeter/submillimeter Array (ALMA), we report a highly
asymmetric concentration of millimeter-sized dust grains on one side of the disk of the star Oph IRS 48 in the 0.44 millimeter (685 GHz) continuum emission (Figure 2.1). We argue that this can be understood in the framework of dust trapping in a large anticyclonic vortex in the disk. The young A-type star Oph IRS 48 [distance∼120 pc] has a well-studied disk with a large inner cavity (a deficit of dust in the inner disk region), a so-called transition disk. Mid-infrared imaging at 18.7µm reveals a disk ring in the small dust grain (size∼50µm) emission
at an inclination of∼50◦, peaking at 55 AU radius or 0.46 arcsec from the star (Geers et al.
2007). Spatially resolved observations of the 4.7µm CO line, tracing 200 to 1000 K gas, show
a ring of emission at 30 AU radius and no warm gas in the central cavity (Brown et al. 2012a). This led to the proposal of a large planet clearing its orbital path as a potential cause of the central cavity.
Although these observations provide information about the inner disk dynamics, they do not address the bulk cold disk material accessible in the millimeter regime. The highly asym-metric crescent-shaped dust structure revealed by the 0.44-mm ALMA continuum (Figure 2.1) traces emission from millimeter-sized dust grains and is located between 45 and 80 AU (±9 AU) from the star. The azimuthal extent is less than one third of the ring with no detected flux at a 3σlevel (2.4 mJy per beam) in the northern part (Figure 2.3). The peak emission has a
very high signal-to-noise ratio of∼390 and the contrast with the upper limit on the opposite side of the ring is at least a factor of 130. The complete absence of dust emission in the north of IRS 48 and resulting high contrast make the crescent-shaped feature more extreme than earlier dust asymmetries (Andrews et al. 2011; Casassus et al. 2013). The spectral slopeαof
the millimeter fluxesFν(0.44 mm combined with fluxes at lower frequenciesν(see Section 2.2) is only 2.67±0.25 (Fν ∝ να), suggesting that millimeter-sized grains (Draine 2006) dominate the 0.44 mm continuum emission. However, the gas traced by the12CO 6-5 line