BENEFITS OF MITIGATING CHILDHOOD LEAD EXPOSURES ASSOCIATED WITH PRIVATE WELLS: IMPLEMENTATION OF A POPULATION INTERVENTION MODEL IN WAKE
COUNTY, NORTH CAROLINA
Sarah Katherine Colley
A Master’s Technical Report submitted to the faculty at the University of North Carolina at Chapel Hill in partial fulfillment of the requirements of the degree of Master of Science in Public
Health in the Department of Environmental Sciences and Engineering in the Gillings School of Global Public Health.
Chapel Hill 2020
© 2020
ABSTRACT
Sarah Katherine Colley: Benefits of mitigating childhood lead exposures associated with private wells: Implementation of a population intervention model in Wake County, North Carolina
(Under the direction of Jacqueline MacDonald Gibson)
Drinking water is an increasingly important mediator of children’s blood lead levels (BLL) in the United States; however, few studies have focused on childhood lead exposures arising from private well water specifically. This research estimated select health and economic benefits of connecting private well households to regulated community water systems. A population intervention model was used to predict the change in children’s BLLs associated with the intervention for a cohort of Wake County, North Carolina children (n=11,010). We also
ACKNOWLEDGEMENTS
My thanks first and foremost go to my advisor, Dr. Jacqueline MacDonald Gibson. Her guidance and advocacy through my master’s degree has been invaluable—I am deeply grateful for the opportunity to work with her and learn from her. I would like to thank my committee members, Dr. George Van Houtven and Dr. Dale Whittington, for their thoughtful feedback and
contributions to this work.
Many thanks to current and former members of the MacDonald Gibson group, including Kennedy Holt, Peter Kane, Sydney Lockhart, Riley Mulhern, Dr. Javad Roostaei, Dr. Frank Stillo, and Erica Wood, for their friendship and collaboration.
TABLE OF CONTENTS
LIST OF FIGURES ... vi
LIST OF TABLES ... vii
LIST OF EQUATIONS ... viii
LIST OF ABBREVIATIONS ... ix
1. Introduction ... 1
1.1. Overview of lead exposures and toxicology ... 1
1.2. Characteristics of childhood blood lead levels in the United States ... 4
1.3. Lead exposures from drinking water and private wells ... 4
1.4. Lead and children’s cognitive function: health and economic implications ... 7
1.5. Overview of blood lead level modeling, population intervention models and prior research ...10
2. Methods ...12
2.1. Health impact assessment: prediction of blood lead levels ...13
2.2. Comparison of the population intervention model to an existing blood lead modeling approach ...17
2.3. Health benefit assessment: estimation of avoided IQ loss ...18
2.4. Economic benefit assessment: estimation of avoided earnings loss ...21
3. Results ...23
3.1. Health impact assessment: prediction of blood lead levels ...23
3.2. Comparison of the population intervention model to an existing blood lead level modeling approach ...24
3.3. Health benefit and economic benefit estimations: avoided IQ loss and avoided earnings loss ...24
4. Discussion ...25
4.1. Considerations for public policy and future research ...25
4.2. Performance of the population intervention model in blood lead level modeling ...30
4.3. Limitations ...32
5. Conclusion ...34
LIST OF FIGURES
LIST OF TABLES
Table 1: Inputs for population intervention model predicting the natural log of blood lead levels
for children in the modeled cohort ...15
Table 2: Inclusion criteria for modeled cohort ...16
Table 3: Selected descriptive statistics for modeled cohort ...16
Table 4: Calculated effect parameters for selected dose-response functions ...19
Table 5: Inputs for economic benefit estimation ...22
LIST OF EQUATIONS
Eq. 1 Regression equation used in population intervention model ...14
Eq. 2 Relative change in predicted blood lead levels ...18
Eq. 3 General form of logarithmic dose-response function ...18
Eq. 4 General form of piecewise linear dose-response function ...18
Eq. 5 Calculation of avoided IQ loss ...20
LIST OF ABBREVIATIONS
ADME – absorption, deposition, metabolism and excretion ATSDR – Agency for Toxic Substances and Disease Registry
BLL – blood lead level, typically reported in μg/dL (micrograms of lead per deciliter of blood) CBA – cost-benefit analysis
CDC – United States Centers for Disease Control and Prevention CEA – cost-effectiveness analysis
ETJ – extraterritorial jurisdiction
IEUBK – Integrated Exposure Uptake Biokinetic Model, a blood lead level model from USEPA IQ – intelligence quotient, a common measurement of cognitive function
LCR – Lead and Copper Rule
NHANES – National Health and Nutritional Examination Survey Pb – symbol for lead, atomic number 82
POU – point of use (e.g. customer tap)
1. Introduction
1.1. Overview of lead exposures and toxicology
Lead (Pb) is a well-established toxicant with no useful biologic function in humans1,2. The soft,
malleable metal has anti-corrosive and low-conductivity properties1,2. These physiochemical
properties have facilitated its widespread use—both currently and historically—in industry, manufacturing, batteries, electronics, gasoline, glass, ceramics, folk medicine, and paint1,2.
Given this extensive usage, Pb is a ubiquitous environmental contaminant; all humans have some level of internal Pb-burden2. Human exposures primarily occur through inhalation and
ingestion pathways, while dermal exposures are typically negligible2. Common exposure
scenarios include occupational exposures (or familial-occupational exposures), ingestion of Pb-contaminated dust, soil, food, or water, or exposure to Pb-Pb-contaminated consumer products.
Pb absorption, deposition, metabolism, and excretion (ADME) processes are primarily governed by the specific exposure pathway, the health-status of the individual, and the age of the
individual2. Pb rapidly enters the bloodstream following inhalation or ingestion—approximately
99% of absorbed Pb binds to red blood cells, while 1% remains in the plasma1. Distribution
throughout the body includes soft tissues (e.g. kidney, liver, muscle, brain) perfused by the Pb-bearing blood and bone, in which Pb gradually replaces calcium ions (Ca2+) in the
hydroxyapatite mineral2. Importantly, Pb can cross the blood-brain barrier and the placenta. An
by ADME processes to and from the bone reservoir2. Bone typically constitutes more than 90%
of an adult’s total Pb body burden and more than 70% of a child’s body burden3.
Elimination of Pb is governed by a multi-compartment model, with a half-life of one to two months in soft tissues and a half-life of years to decades in bone1—this is generally thought of
as a ‘fast turnover pool’ and a ‘slow turnover pool,’ respectively. Seventy percent of excreted Pb is via urinary elimination, while bile (feces), skin, hair, nails, sweat, and breast milk comprise important secondary elimination pathways1. Biomarkers of recent Pb exposure typically consist
of whole blood sampling, which reflects Pb burdens in soft tissues1. Longer term biomarkers of
exposure involve x-ray-fluorescence-based measurements of Pb in bone1,2. The correlation
between blood-Pb and bone-Pb is typically poor due to the different exposure timeframes captured by these biomarkers. Blood-Pb (or blood lead level; BLL) is the most common biomarker of exposure.
Health effects associated with Pb are multisystemic and can involve every organ system3; major
endpoints broadly include neurological, neurobehavioral, cardiovascular, renal, and reproductive outcomes in both adults and children4–9. Pb can disrupt numerous metabolic and cellular
processing pathways, likely contributing to the diverse set of adverse health impacts associated with Pb-exposure. Pb has been shown to alter calcium homeostasis throughout the body, disrupt normal protein functioning through the displacement of metal enzymatic cofactors, create oxidative stress, and induce mitochondrial disfunction2. These changes can be
associated with cellular toxicity and apoptosis, disfunction of cell signaling, disfunction of ion transport, disfunction of neurotransmitter storage and release, disruption of enzymatic function and protein expression, and disruption of energy metabolism2. Pb-induced disruption of Ca2+
Children and pregnant women are considered particularly vulnerable populations with respect to Pb exposures10. Pb, even at low levels, is considered a causal risk factor for numerous adverse
outcomes related to childhood development and behavior, including inhibited cognitive function, lower intelligence quotients (IQ), and higher rates of attention deficit disorders, depression and anxiety, antisocial behavior, and juvenile delinquency1–3,5,6,11–14. The reasons for childhood Pb-susceptibility are manifold. First, children’s ADME processes differ markedly from adults’, particularly with respect to gastrointestinal absorption; adults typically absorb 10-15% of
ingested Pb whereas children absorb 40-50% of ingested Pb1,2, resulting in much higher internal
burdens in children. Second, early childhood is a period of rapid and critical neurodevelopment that is already vulnerable to disruption; however the blood-brain barrier remains immature, causing the neurologic system to be particularly susceptible to damage3. Third, children are
more prone to hand-to-mouth activities that can increase the ingestion of Pb-contaminated dust or paint and exposure to Pb-bearing toys3.
A robust body of literature linking adverse health effects to Pb has moved the Centers for Disease Control and Prevention (CDC) to steadily lower the definition of what constitutes an ‘elevated BLL,’ from the initial level of 60μg/dL in the 1960s15 to the current level of 5μg/dL,
revised in 2012. The CDC’s definition for elevated BLL is not a health-based standard—the CDC’s current thresholds are linked to the 97.5th-percentile childhood BLL, a reference value
determined by the National Health and Nutritional Examination Survey (NHANES)16,17. The
National Toxicology Program has concluded there is “sufficient” evidence of adverse health effects associated with BLLs of <5μg/dL—that is, there is “an association…between the
exposure [BLL <5μg/dL] and health outcomes in studies in which chance, bias, and confounding
could be ruled out with reasonable confidence.”7 There is, in fact, no observed ‘safe’ threshold
for Pb exposure3,11. The Agency for Toxic Substances and Disease Registry (ATSDR) has
cognitive function in children)”3. Although acute Pb-poisoning (>45μg/dL) can be treated through
chelation therapy, there are no therapeutic interventions for low BLLs, and adverse health effects are irreversible. Thus, primary prevention of any Pb-exposure is critical, particularly during childhood.
1.2. Characteristics of childhood blood lead levels in the United States
Childhood BLLs generally follow a lognormal distribution in the general population. Geometric mean (GM) BLLs rapidly decreased in the United States following several milestone regulatory interventions that addressed numerous exposure pathways, including the ban on lead paint in 1978, the ban on lead plumbing in 1986, the Lead Contamination Control Act of 1988, the Lead and Copper Rule (LCR) of 1991, and the ban on lead solder in food cans in 199511. The GM
childhood BLL decreased precipitously following the phaseout of lead from gasoline, from >15μg/dL in in the mid-to-late 1970s to <5μg/dL by the late 1980s. More recently, national trends have seen a sustained and statistically significant decrease of GM BLLs, from 1.7μg/dL in the early 2000s to 0.8μg/dL in 201418.
Sociodemographic and housing characteristics are risk factors for elevated BLLs19,20;
consequently, BLLs exhibit marked disparities among children in the United States and present serious implications for environmental justice. Despite the substantial progress in decreasing BLLs over the past forty years, low-income children, non-Hispanic Black children, and children living in older homes remain at higher risk for elevated BLLs19–21.
1.3. Lead exposures from drinking water and private wells
As regulations have successfully reduced exposures to airborne Pb and Pb-bearing products, drinking water has assumed an increasingly important role in mediating BLLs. Drinking water constitutes a significant proportion of an individual’s total Pb exposure, ranging from
water have received more examination in recent years, particularly in light of events such as the crisis in Flint, Michigan18,23,24.
Corrosion of water distribution service lines (i.e. lead service lines) and household plumbing components (e.g. brass faucets, lead solder) constitute the most common sources of Pb in drinking water in the United States3,25–27. Pb-bearing plumbing or service lines are typically more common in older homes28. Corrosion potential is largely governed by water chemistry (e.g. pH,
alkalinity, mineral content, temperature etc.) and the amount of Pb in contact with the water (e.g. Pb content, Pb-bearing surface area, duration of contact, protective scaling, etc.)29. Federal,
state, and local governments have taken steps to minimize Pb-exposures from drinking water. Of these, the Safe Drinking Water Act (SDWA) and the LCR promulgated under the SDWA have been among the most significant. The SDWA regulates the maximum allowable Pb content in plumbing and solder, while the LCR mandates corrosion control30,31.
Under the LCR, community water systems must control for corrosion potential and must take further action to control for Pb if more than 10% of the system’s point of use (POU; e.g. customer’s tap water) samples exceed the action level of 15 parts per billion (ppb). These regulatory protections—corrosion control, regular testing, and corrective action—only cover community water systems serving more than 25 households. Households relying on private wells are therefore solely responsible for testing, treating, and maintaining their water supplies. This lack of regulatory protection may put a significant proportion of private well users—an estimated 42 million Americans32—at increased risk for corrosive water and lead exposures.
Private well households typically do not have the robust Pb-monitoring programs or corrosion-control systems that are mandated for community water systems33. In fact, few private well
households regularly test their water34–38. This suggests these households may not fully
also present additional opportunities for the presence of Pb-bearing components, such as submersible pumps, well casing, drop pipes, and pressure tanks39,40.
Indeed, a prior study of over 2,000 private wells throughout Virginia found 19% exceeded the United States Environmental Protection Agency’s (USEPA) regulatory action level of 15 ppb and a Pennsylvania study found 12% of tested private wells exceeded the action level33,41. A study
of private wells in Wake County, North Carolina (NC) found elevated water-Pb prevalence comparable to the Flint water crisis26. In comparison, <4% of community water systems have
exceeded the action level since 200042. Although the 15 ppb action level is a current regulatory
benchmark for community water systems and is used as a comparison level to evaluate private wells, it is not a health-based standard. Health-based standards generally represent the
concentration at which no adverse effects would be expected. Even below the regulatory action level, private well households appear to be at greater risk for lead exposure. USEPA has set a non-enforceable, health-based goal (i.e. maximum contaminant level goal) of 0 ppb in drinking water and the American Academy of Pediatrics has recommended children’s drinking water levels should not exceed 1 ppb11,43. Prior research conducted by Stillo et al. in 2016 found Wake
County, NC private wells had an average water-Pb concentration of 8.2 ppb, compared to 2.8 ppb in community water system POU samples from Tier 1 households—Tier 1 households are identified as having the highest risk of Pb exposure in a community water system26. Therefore,
1.4. Lead and children’s cognitive function: health and economic implications
Extending community water infrastructure is a potential intervention that can provide consistent access to regulated water to support the public health of communities currently relying on regulated private wells; however, capital improvements projects, such as water line extensions, are costly. Unfortunately, restricted municipal budgets mean resource allocation decisions must be made by local makers. Cost-benefit analyses (CBA) are one tool used by decision-makers to evaluate the favorability of a proposed project; typically, the benefits should outweigh the costs of a policy/intervention such that there are positive net benefits. In CBA, both costs and benefits are reported in monetary terms and net benefits can be readily compared across proposed projects or interventions. Wake County, NC provides an excellent case study for evaluating potential benefits of connecting private well households to community water supplies, given that extensive research has been conducted on various public health considerations of private wells within Wake County36,44–48. A largely unexplored benefit of connecting unregulated private well households to community water supplies is lower water-Pb concentrations,
subsequently lower BLLs of current or future children living in private well households, and downstream health and economic benefits associated with lower BLLs.
Although there is strong evidence for numerous adverse neurological and neurobehavioral effects associated with childhood Pb exposures, the relationship between BLL and cognitive function is among the best-established of the aforementioned health outcomes3,7. This
relationship has been consistently observed at various BLLs and among prospective cohorts, retrospective cohorts, and cross-sectional studies3,5,6,14,49–51. IQ is an indicator for cognitive function and, despite critiques52,53, it remains a commonly used measurement tool in research
economic evaluations26,57. Lanphear et al., in addition to several other studies58,59 , suggest a
clear supralinear relationship with the greatest change in IQ occurring at the lowest BLLs; however, most dose-response studies have not specifically investigated the effects of BLLs <1μg/dL—a clear data gap given the
rapid progress made in reducing childhood BLLs and the lack of an apparent threshold value. A benchmark dose (BMD) is an alternative perspective when there is no established threshold59,60. A BMD is the dose at
which a defined health effect (a benchmark dose response; BMDR) occurs. A BMD study by Budtz-Jørgensen et al. tested numerous dose-response functions to estimate the internal dose (i.e. BLL)
associated with a BMDR of 1 IQ point loss. The authors’ models were typically associated with a 1 IQ point loss occurring at BLLs ranging from 0.1 to 1.0 μg/dL—that is, a 1 IQ point loss could be associated with even the very lowest BLLs. This reaffirms the consensus that there is no safe BLL. Avoiding IQ loss associated with Pb exposures has population benefits61,62, although to our
knowledge, quantifying the benefits associated with specific interventions to prevent low level exposures is a
largely unexplored area; these benefits should be quantified to aid decision-making and
facilitate future CBAs related to private well communities and infrastructure decisions. Non-fatal endpoints, such as IQ loss, typically do not have readily available willingness-to-pay (WTP) data that are commonly used in CBA. One prior WTP study of childhood IQ loss related to
Reliance on unregulated private
wells
Corrosion of lead-bearing plumbing
components
Childhood lead exposures from domestic water use
IQ loss associated with childhood lead exposures Reduced lifetime earnings associated with IQ
loss
Figure 1: Conceptual model for earnings
loss associated with childhood lead exposures from private wells
Lack of corrosion-control or testing
polychlorinated biphenyl exposure found a parental stated preference WTP of approximately $585 per IQ point ($2017), while a separate study found a parental stated preference of approximately $2930 per IQ point ($2017). A human capital approach is an alternative method of estimating benefits when WTP data are scarce or otherwise not appropriate. A human capital approach estimates the loss in lifetime economic productivity due to a disability-state—that is,
income loss associated with lower IQ levels. Although a decrease in IQ may not necessarily constitute a disability, “anything that reduces individuals’ employment and earning capacity,
even if not associated with overt disability, has an adverse economic impact on overall societal productivity”63. This is particularly pertinent for population-level pseudo-disability-states, such as
decreased IQ. The body of literature examining IQ loss from a human capital approach is extensive, although the IQ-earnings relationship remains complex and open to expert
interpretation. Several notable studies and systematic reviews have estimated between 0.5% and 3% higher lifetime earnings per IQ point gained63–67 . A recent review by Zhou and Grosse estimated the IQ-earnings relationship to be between 1.3% and 2.2% higher lifetime earnings per IQ point gained, as revised based on critiques and limitations of prior studies63.
Cognitive ability affects “school performance, educational attainment, and success in the labor market, and hence is positively associated with earnings”61. When quantifying potential benefits
1.5. Overview of blood lead level modeling, population intervention models and
prior research
To estimate the health and economic benefits of connecting private wells to community water supplies, the expected change in BLLs must first be predicted, as this is an upstream health impact. The USEPA’s Integrated Exposure Uptake Biokinetic (IEUBK) Model for Lead in Children is a commonly used BLL modeling approach that focuses on the prediction of early childhood (<7 years old) BLLs. The IEUBK model represents the human body as compartments and mathematically models ADME processes throughout the compartments, thereby
representing Pb circulation and fate within the body. It was originally developed in the late 1980s and 1990s for risk assessment at Superfund sites and relies on the well-understood ADME processes of Pb. The software can be run using site-specific values (e.g. known Pb-concentrations in environmental media, exposure frequencies, etc.) or run using default values. Inputs to the IEUBK model are considered single, time-averaged point estimates; model outputs include the mean predicted BLL for the population of children who experience those inputs and the probability that a hypothetical child would exceed a user-defined BLL (e.g. >5μg/dL) under a given exposure scenario71,72. The IEUBK model can also be used to predict the relative effect on
BLLs given a change in an exposure medium. The IEUBK model cannot be used to predict the BLL of a single child experiencing a specific exposure scenario73. The IEUBK is also known to
overpredict BLLs74–76.
An alternative approach—one based on health surveillance data and measured BLLs rather than pharmacokinetic modeling—could be considered for estimating childhood BLLs. A population intervention model (PIM) may be one such method. PIMs are causal inference models that can estimate the change in an outcome of interest when a risk factor for the
to estimate the impact of interventions related to depression in low-income women in Mexico78
and acute gastrointestinal illness (AGI) in private well owners in North Carolina48.
This research is built on the implementation of a PIM to evaluate the downstream benefits associated with switching children from unregulated private wells to regulated community water supplies. In this case, the outcome of interest is a child’s BLL, the risk factor is the child’s water source, and the intervention is moving the child from higher-risk private wells to lower-risk community water supplies. The downstream benefits examined in this analysis focus on the avoided costs of IQ loss and lifetime earnings loss associated with Pb exposures. Outputs from the PIM are used in conjunction with published literature to estimate the IQ loss avoided and the economic benefits associated with extending community water supplies to a cohort of Wake County children on private well water.
The role of private wells in mediating children’s BLLs is an emerging area of research20, and the
benefits associated with interventions to minimize this specific exposure pathway are largely undefined.
This research has four primary objectives:
1. Implement a population intervention model (PIM) to predict the blood lead levels (BLLs) of children under status quo (i.e. well water) and counterfactual (i.e. community water) scenarios,
2. Compare the PIM performance to an existing BLL modeling method,
3. Estimate the health and economic benefits of extending community water supplies to private well households with children, whereby benefits relate to IQ and lifetime earnings, and
2. Methods
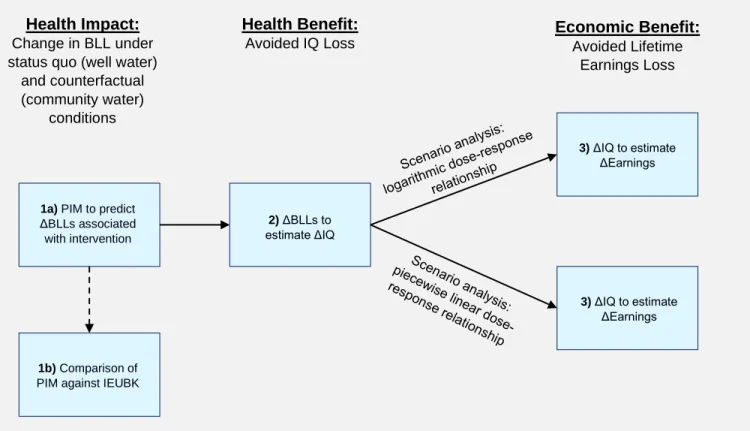
The methods follow three key steps:
1. Health Impact Assessment (objectives 1-2):
a. Use the PIM to predict the change in BLLs expected for a cohort of Wake County children by switching them from private wells to community water supplies
b. Compare the predictions of the PIM to those from the IEUBK model
2. Health Benefit Assessment(objective 3): Estimate the avoided IQ loss associated with the change in BLLs from the PIM in Step 1a; conduct a scenario analysis to test the sensitivity of results to the selection of dose-response relationship
3. Economic Benefit Assessment (objective 3): Estimate the avoided lifetime earnings loss associated with the avoided IQ loss from Step 2
A model was constructed in Analytica (Windows v.5.1)79 to probabilistically evaluate each of the
three key steps, with statistical distributions around the model parameters to propagate
2.1. Health impact assessment: prediction of blood lead levels
BLL predictions were developed based on prior research by MacDonald Gibson, et al.; full database and model development is described elsewhere20 and briefly described herein.
MacDonald Gibson et al. developed a database of Wake County children that included blood-Pb surveillance data and factors known to be associated with blood-Pb. The North Carolina
Childhood Lead Poisoning Prevention Program provided blood-Pb surveillance data for children screened in Wake County between 2002 and 2017. The database also includes publicly
available sociodemographic data and residential parcel data for Wake County children.
Individual blood-Pb surveillance data were merged at the address-level with residential property parcel data to obtain information on household water source (private well or community system), home age, home value, and other attributes of each child’s residence. Sociodemographic data
1a) PIM to predict ΔBLLs associated with intervention
2) ΔBLLs to estimate ΔIQ
1b) Comparison of PIM against IEUBK
3) ΔIQ to estimate ΔEarnings
3) ΔIQ to estimate ΔEarnings Health Benefit:
Avoided IQ Loss Economic Benefit: Avoided Lifetime Earnings Loss Health Impact:
Change in BLL under status quo (well water)
and counterfactual (community water)
conditions
Figure 2: Summary of major methods steps.
were obtained at the U.S. Census block group level and were assigned to individual observations. After data cleaning, MacDonald Gibson et al. obtained 59,483 records
corresponding to 41,871 unique addresses in Wake County. The authors fit a multi-level Tobit regression model to the data, which accommodates the left-censored data and allows the prediction of log-transformed blood lead levels. The final regression form is given by:
Eq. 1 𝑙𝑛(𝐵𝐿𝐿)𝑖 = 𝛼 + 𝛽1𝐶𝑤𝑒𝑙𝑙,𝑖+ 𝛽2𝐶𝑚𝑎𝑙𝑒,𝑖+ 𝛽3𝐶𝑣𝑎𝑙𝑢𝑒,𝑖+ 𝛽4𝐶𝐸𝑇𝐽,𝑖+𝛽5𝐶𝑦𝑒𝑎𝑟,𝑖+𝛽6𝐶𝑎𝑟𝑒𝑎,𝑖+ 𝛽7𝐶𝑑𝑟𝑎𝑤,𝑖+
𝛽8𝑃𝑜𝑝𝐵𝑙𝑎𝑐𝑘,𝑗+𝛽9𝑃𝑜𝑝𝐻𝑖𝑠𝑝𝑎𝑛𝑖𝑐,𝑗𝛽10𝑃𝑜𝑝𝑖𝑛𝑐𝑜𝑚𝑒,𝑗+ 𝛽11𝐶𝑎𝑔𝑒,𝑖+ 𝛽12𝐶𝑐𝑜𝑛𝑠𝑡𝑟𝑢𝑐𝑡𝑖𝑜𝑛,𝑖
Where,
ln(𝐵𝐿𝐿)𝑖 is the natural log of the blood lead level for child i
𝛼 is the regression constant
𝐶𝑤𝑒𝑙𝑙,𝑖 is the water source for child i
𝐶𝑚𝑎𝑙𝑒,𝑖 is the gender of child i
𝐶𝑣𝑎𝑙𝑢𝑒,𝑖 is the natural log of the home value of child i’s residence
𝐶𝐸𝑇𝐽,𝑖 is whether child i was born in an extraterritorial jurisdiction1
𝐶𝑦𝑒𝑎𝑟,𝑖 is the natural log of the blood draw year for child i
𝐶𝑎𝑟𝑒𝑎,𝑖 is the area of the home of child i, in square feet
𝐶𝑑𝑟𝑎𝑤,𝑖 is the blood draw type for child i
𝑃𝑜𝑝𝐵𝑙𝑎𝑐𝑘,𝑗 is the population proportion identifying as African American in block
group j
𝑃𝑜𝑝𝐻𝑖𝑠𝑝𝑎𝑛𝑖𝑐,𝑗 is the population proportion identifying as Hispanic in block group j
𝑃𝑜𝑝𝑖𝑛𝑐𝑜𝑚𝑒,𝑗 is the natural log of the median household income in block group j
𝐶𝑎𝑔𝑒,𝑖 is the age of child i, in months, at the time of the blood draw
𝐶𝑐𝑜𝑛𝑠𝑡𝑟𝑢𝑐𝑡𝑖𝑜𝑛,𝑖 is the year the home of child i was built
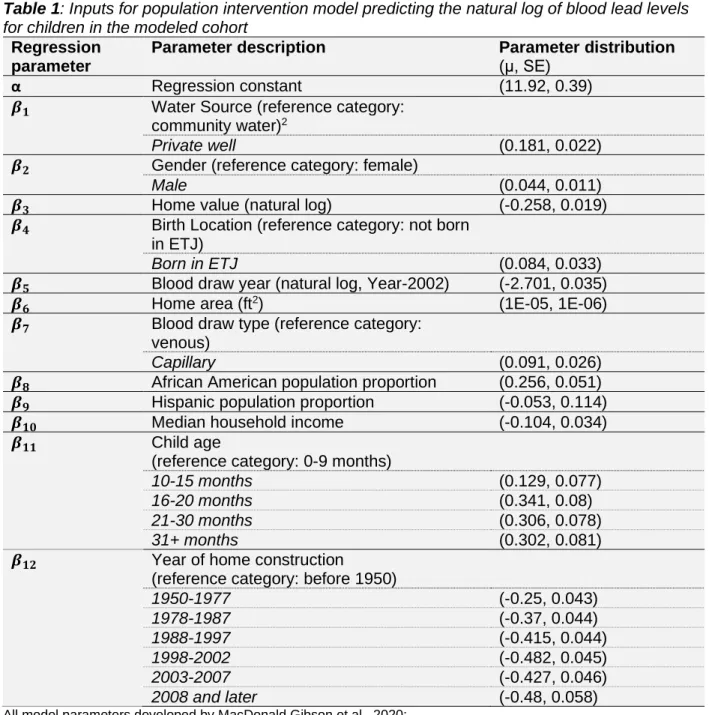
The exponentiated regression coefficients from MacDonald Gibson et al. were log-transformed and recorded as normal distributions in Analytica. The transformed regression coefficients and standard errors are provided in Table 1.
1 Extraterritorial jurisdictions (ETJs) are unincorporated areas near city limits without access to typical municipal services, such as
Table 1: Inputs for population intervention model predicting the natural log of blood lead levels
for children in the modeled cohort
Regression parameter
Parameter description Parameter distribution
(μ, SE)
α Regression constant (11.92, 0.39)
𝜷𝟏 Water Source (reference category:
community water)2
Private well (0.181, 0.022) 𝜷𝟐 Gender (reference category: female)
Male (0.044, 0.011)
𝜷𝟑 Home value (natural log) (-0.258, 0.019)
𝜷𝟒 Birth Location (reference category: not born
in ETJ)
Born in ETJ (0.084, 0.033)
𝜷𝟓 Blood draw year (natural log, Year-2002) (-2.701, 0.035)
𝜷𝟔 Home area (ft2) (1E-05, 1E-06)
𝜷𝟕 Blood draw type (reference category:
venous)
Capillary (0.091, 0.026)
𝜷𝟖 African American population proportion (0.256, 0.051)
𝜷𝟗 Hispanic population proportion (-0.053, 0.114)
𝜷𝟏𝟎 Median household income (-0.104, 0.034)
𝜷𝟏𝟏 Child age
(reference category: 0-9 months)
10-15 months (0.129, 0.077) 16-20 months (0.341, 0.08) 21-30 months (0.306, 0.078)
31+ months (0.302, 0.081)
𝜷𝟏𝟐 Year of home construction
(reference category: before 1950)
1950-1977 (-0.25, 0.043)
1978-1987 (-0.37, 0.044)
1988-1997 (-0.415, 0.044)
1998-2002 (-0.482, 0.045)
2003-2007 (-0.427, 0.046)
2008 and later (-0.48, 0.058)
All model parameters developed by MacDonald Gibson et al., 2020; μ – mean, SE – standard error, ETJ – extraterritorial jurisdiction
A cohort of Wake County children who rely on private wells and participated in blood-Pb screening was selected for inclusion in a modeled cohort. The modeled cohort eligibility criteria are presented in Table 2.
2 The β
1 parameter (water source) is the critical variable in the regression model and can be broadly interpreted as: exp(β1) = 1.20.
Table 2: Inclusion criteria for modeled cohort
Inclusion Criteria Exclusion Criteria
Household water source Private Well Community Water
Age at time of blood draw 0 – 6 years old > 6 years old
Blood draw year 2017 Other year
Missing data status Data missing for < 3 variables Data missing for > 3 variables
The most recent test year available was 2017, which was selected to generate the most up-to-date results. We chose the 0-6 age range to capture all relevant database records identified in the 2017 test year and based on the CDC’s testing criteria and definitions of at-risk
populations10,80. If the child had data missing for three or more variables, the child was excluded
from the modeled cohort. If a child’s data was missing for fewer than three variables, then the missing data were replaced with median cohort value for that variable. The final modeled cohort included 633 children, eight of which had missing values replaced with medians. Descriptive statistics of selected characteristics for the modeled cohort are provided in Table 3.
Table 3: Selected descriptive statistics for modeled cohort
Cohort characteristic Value(s)
Cohort Size (n=) 633
Proportion male 48.3%
Average age at blood draw (min,
max) 16 months (0 months, 63 months)
Geometric mean measured blood
lead level† (min, max) 1.08 μg/dL (1 μg/dL, 13 μg/dL)
†Measured blood lead levels are left-censored due to surveillance reporting limits—minimum reported blood lead
level is 1μg/dL
Relevant data were extracted for each child in the modeled cohort. These data were used in the model to predict individual-level ln(BLL) under two scenarios:
2. a counterfactual scenario, in which the private well variable was set to zero—that is, the child was theoretically switched to a regulated community water system
Individual BLLs were obtained by exponentiating the results.
2.2. Comparison of the population intervention model to an existing blood lead
modeling approach
A key distinction this study provides is the use of a PIM rather than a pharmacokinetic model to predict BLLs. Pharmacokinetic modeling, such as the IEUBK model, has been used in other economic evaluations to estimate downstream benefits associated with a change in BLLs24. In
this study, the IEUBK model (Windows v1.1, Build 11)81 was used to broadly gauge our PIM’s
performance against widely accepted approaches for modeling BLLs. The environmental media, exposure frequencies, and biokinetic inputs were left as default in the IEUBK model, except for the water-Pb concentration. The IEUBK model was run similarly to the PIM, with a status quo scenario and a counterfactual scenario. In the status quo scenario, the water-Pb concentration was input as 8.2 ppb (the mean Wake County private well water concentration estimated by Stillo et al.) and the counterfactual scenario had a water-Pb input of 2.8 ppb (the mean concentration in Wake County Tier-1 houses estimated by Stillo et al.)26
Eq. 2 𝑷𝒆𝒓𝒄𝒆𝒏𝒕 𝑪𝒉𝒂𝒏𝒈𝒆 = 𝑩𝑳𝑳𝒄𝒐𝒖𝒏𝒕𝒆𝒓𝒇𝒂𝒄𝒕𝒖𝒂𝒍 𝑩𝑳𝑳 − 𝑩𝑳𝑳𝒔𝒕𝒂𝒕𝒖𝒔 𝒒𝒖𝒐
𝒔𝒕𝒂𝒕𝒖𝒔 𝒒𝒖𝒐 𝒙 𝟏𝟎𝟎
Where:
𝐵𝐿𝐿𝑠𝑡𝑎𝑡𝑢𝑠 𝑞𝑢𝑜 is the BLL predicted under the status quo scenario for any given
model, and
𝐵𝐿𝐿𝑐𝑜𝑢𝑛𝑡𝑒𝑟𝑓𝑎𝑐𝑡𝑢𝑎𝑙 is the BLL predicted under the counterfactual scenario for any
given model
Having performed a basic comparison of the PIM’s performance against an accepted
pharmacokinetic modeling approach, we proceeded with our PIM’s health impact output (i.e. BLL reduction estimates) in calculating downstream benefits.
2.3. Health benefit assessment: estimation of avoided IQ loss
IQ loss associated with Pb exposure from private well water was estimated under the status quo scenario and the counterfactual scenario by integrating the previously predicted BLLs from Section 2.1 with a BMD study by Budtz-Jørgensen et al. In the BMD study, the relationship between BLLs and IQ loss was developed from seven international prospective cohort studies (n=1,333 children)60. Given the uncertainty of the effects of Pb at low levels, a scenario analysis
was conducted using two separate dose-response models estimated in the prior BMD study: a logarithmic model and a piecewise linear model, with general forms:
Eq. 3 𝒇(𝒅) = 𝜷 ∗ 𝒍𝒏(𝒅 + 𝜸)
Where:
𝑓(𝑑) is the IQ point loss at dose d, 𝑑 is the concurrent BLL in μg/dL, 𝛽 is the effect parameter, and 𝛾 is a free parameter
Eq. 4 𝒇(𝒅) = 𝜷𝒅
Where:
Of the tested dose-response models, Budtz-Jørgensen found a logarithmic relationship where γ=0.806 was the best-fitting model; however, this optimal curve fit the data “only marginally better than the curve with γ=1”. To avoid spurious negative effects at very low BLLs (i.e. dose <0.194μg/dL), the logarithmic relationship where γ=1 was selected. A piecewise linear
relationship with a breakpoint at 7.5μg/dL was also used to test the robustness of this project’s
results with respect to the selection of dose-response relationships. To use the selected
relationships from Budtz-Jørgensen while accounting for uncertainty in parameter estimates, we estimated3 the mean effect parameters and standard errors from data provided by the authors.
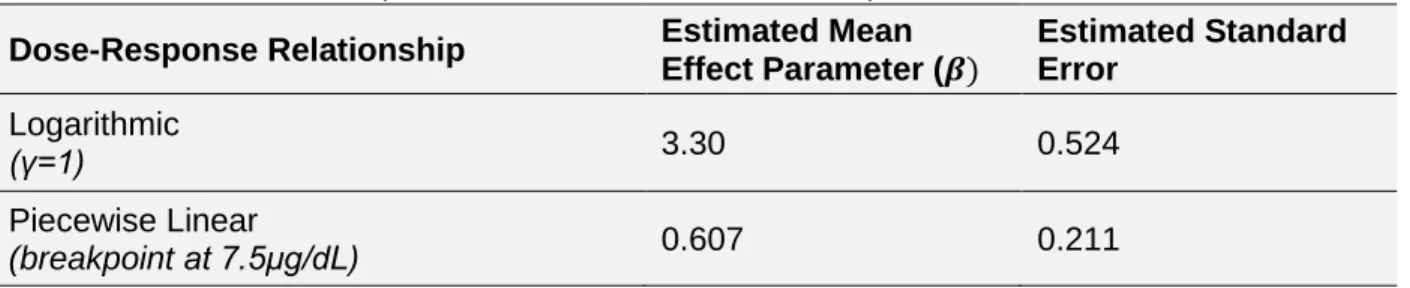
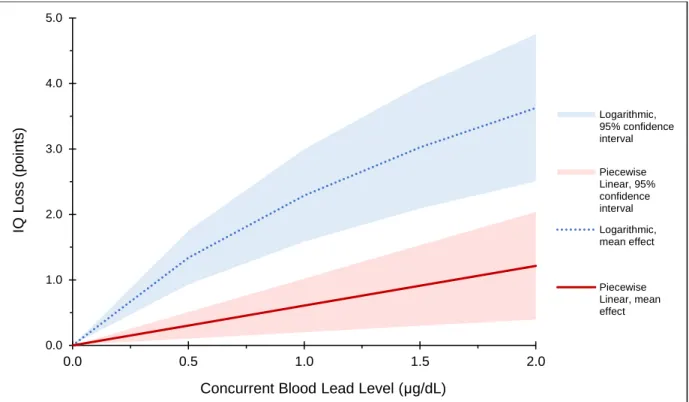
These parameters were represented as normally distributed in Analytica. The estimated parameters are provided in Table 4 and a modified version of the selected low-level dose-response relationships with probability bounds (derived from Budtz-Jørgensen et al.) is presented in Figure 3.
Table 4: Calculated effect parameters for selected dose-response functions
Dose-Response Relationship Estimated Mean
Effect Parameter (𝜷)
Estimated Standard Error
Logarithmic
(γ=1) 3.30 0.524
Piecewise Linear
(breakpoint at 7.5μg/dL) 0.607 0.211
All model parameters developed by Budtz-Jørgensen et al, 2012
3 Mean effect parameters were estimated using the general dose-response equation forms, the authors’ BMDs, and benchmark
Figure 3: Two low-level dose-response relationships (logarithmic and piecewise linear) with
calculated 95% probability bounds.
IQ loss increases with increasing blood lead levels; predicted IQ loss associated with a given blood lead level is dependent on the form of the selected dose-response function, which has implications for downstream benefits estimations. Modified from Budtz-Jørgensen et al., 2012.
The difference between IQ points lost under the status quo scenario and counterfactual scenario are the IQ points maintained—that is, avoided IQ loss attributable to the intervention. Avoided IQ loss was modeled for each child in Analytica using both of the selected dose-response functions (Eq. 5).
Eq. 5 𝜟𝑰𝑸𝒊 = 𝒇(𝒅𝒊,𝒘𝒆𝒍𝒍) − 𝒇(𝒅𝒊,𝒄𝒐𝒎𝒎𝒖𝒏𝒊𝒕𝒚)
Where:
𝛥𝐼𝑄𝑖 is the avoided IQ loss for child i, given the counterfactual scenario
𝑑𝑖,𝑤𝑒𝑙𝑙 is the predicted BLL under the status quo scenario for child i,
𝑑𝑖,𝑐𝑜𝑚𝑚𝑢𝑛𝑖𝑡𝑦is the predicted BLL under the counterfactual scenario for child i, and
𝑓(𝑑) is IQ loss experienced under a given scenario and given dose-response function 0.0 1.0 2.0 3.0 4.0 5.0
0.0 0.5 1.0 1.5 2.0
IQ Lo s s ( po ints )
Concurrent Blood Lead Level (μg/dL)
2.4. Economic benefit assessment: estimation of avoided earnings loss
Grosse et al.61 previously developed a human capital framework for the quantification of
economic benefits associated with improved BLLs in the United States. The authors calculated the expected increase in worker productivity related to improved IQ, which was estimated from NHANES BLL data (cycle years 1976-1999) and economic literature. This framework was adapted for use in our study context and is given by:
Eq. 6 ∆𝑬𝒊= ∆𝑰𝑸𝒊×( ∆𝑬
𝑬⁄∆𝑰𝑸)× 𝑬
Where:
∆𝐸𝑖 is the change in expected earnings for child i associated with moving from
private wells to community water supplies,
𝛥𝐼𝑄𝑖 is the avoided IQ loss for child i associated with moving from a private well to
community water supplies (∆𝐸
𝐸⁄∆𝐼𝑄) is the percent change in earnings per IQ point, and
𝐸 is the discounted lifetime earnings for any given child in the cohort
A recently updated IQ-earnings relationship from Zhou and Grosse estimated between 1.3% and 2.2% higher lifetime earnings per IQ point63. This range was recorded as a uniform
distribution in the Analytica model. Present value lifetime productivity values were obtained from the literature82 and inflated to our study year—estimated between $1.21M and $1.50M ($2017),
under annual real earnings growth rates of 0.5% and 1%, respectively. This range was also recorded as a uniform distribution in Analytica. Given recent deviations from the historical 1% real earnings growth rate82,83, we felt it was appropriate to incorporate a range of present value
The modeled cohort only represents children who underwent blood-Pb testing in 2017 and were successfully matched in the database. Therefore, the modeled cohort only represents a small portion of the true population of Wake County children who rely on private wells. The expected change in lifetime earnings was summed for all children in the modeled cohort and was
extrapolated to the broader 2017 cohort of Wake County children (<6 years) on private wells. The full 2017 Wake County cohort was estimated based on 2017 well-reliance prevalence (13.9%) from the database developed by MacDonald Gibson et al. and the total number of children <6 years in Wake County in 2017 (n=79,210)85, for an estimated total cohort of 11,010
children.
The model inputs for the economic benefit component of the analysis are provided in Table 5. Other potential benefits, such as avoided environmental investigations, chelation therapy, special education interventions, etc. were not estimated due to the low predicted BLLs (see Results section).
Table 5: Inputs for economic benefit estimation
Full Wake County cohort size (n=)*
Change in earnings per IQ point†
Present Value Lifetime Earnings ($2017)†
11,010 1.3%, 2.2% $1.21M, $1.50M
*Constant value
3. Results
3.1. Health impact assessment: prediction of blood lead levels
The PIM predicted the GM BLL for the modeled cohort was approximately 0.31 μg/dL under the status quo scenario and 0.26 μg/dL under the counterfactual scenario, a change of about 0.05 μg/dL. Cumulative distributions of BLLs predicted under the status quo and counterfactual scenarios are presented in Figure 4.
Figure 4: Cumulative distributions of blood lead levels predicted under the status quo scenario
(private wells) and the counterfactual scenario (community water system) for the modeled cohort of Wake County children.
The y-axis represents the probability that the blood lead level variable takes on a value less than or equal to x.
0 0.1 0.2 0.3 0.4 0.5 0.6 0.7 0.8 0.9 1
0.00 0.25 0.50 0.75 1.00 1.25
Cum u la ti v e Dis tri b u ti o n , P(X < x)
Predicted Blood Lead Level, μg/dL
Status Quo
3.2. Comparison of the population intervention model to an existing blood lead
level modeling approach
The IEUBK model predicted BLLs would decrease by 13.3% when moving from the approximate water-Pb concentrations of private wells to the water-Pb concentrations of community water supplies. The PIM predicted BLLs would decrease by approximately 16.5% (95%CI: 12.8%, 20.1%) under the same intervention.
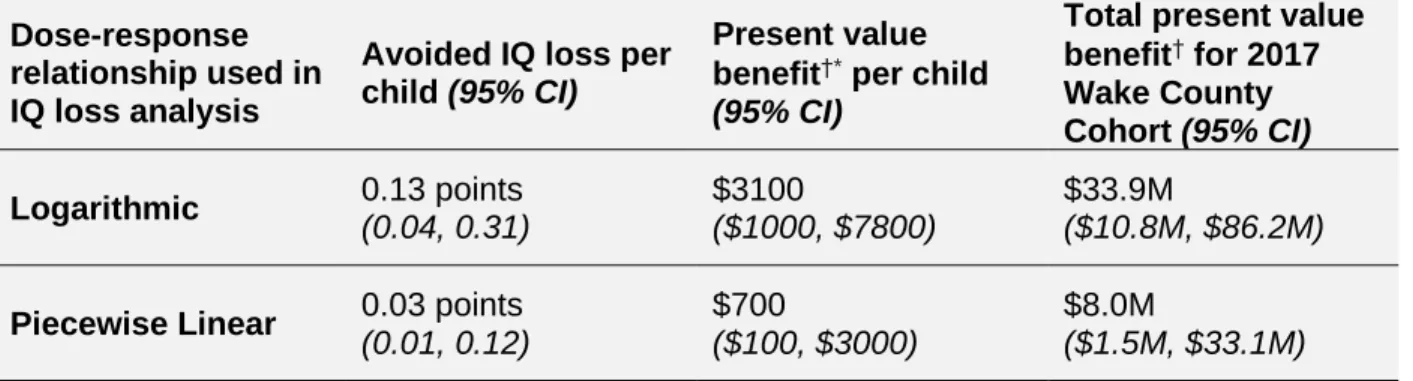
3.3. Health benefit and economic benefit estimations: avoided IQ loss and avoided
earnings loss
Using predicted BLL outputs from the PIM in conjunction with the BMD study by
Budtz-Jørgensen, the median avoided IQ loss for a child in the modeled cohort was 0.13 points under the logarithmic relationship (95%CI: 0.04, 0.31), and 0.03 points under the piecewise linear relationship (95%CI: 0.01, 0.12).
Table 6: Summary of health and economic benefits associated with switching Wake County
children from private well water to community water supplies under a scenario analysis using two different dose-response models
4. Discussion
4.1. Considerations for public policy and future research
We predicted that connection to community water supplies would decrease children’s BLLs by 16.5%. Depending on the dose-response relationship used, the improved BLLs would yield a per-child benefit ranging from $700 to $3100.
The predicted BLLs were lower than the observed BLLs in the health surveillance database (refer to Table 3). This is because the observed data have a detection limit of 1 μg/dL—that is, children with BLLs <1 μg/dL are recorded as having BLLs equal to 1 μg/dL. Thus, the observed data are left-censored. The Tobit regression model corrects for this left censoring and will therefore yield lower estimates than the observed data. The predicted BLLs in this study are generally in accordance with a prior Wake County study that had more sensitive detection limits74. Komandur et al. found a GM BLL of 0.34 μg/dL (n=22) in a Wake County cohort with
similar attributes74, suggesting the Tobit regression model appropriately accounts for
left-censoring. Dose-response relationship used in IQ loss analysis
Avoided IQ loss per child (95% CI)
Present value benefit†* per child
(95% CI)
Total present value benefit† for 2017 Wake County Cohort (95% CI)
Logarithmic 0.13 points
(0.04, 0.31)
$3100
($1000, $7800)
$33.9M
($10.8M, $86.2M)
Piecewise Linear 0.03 points
(0.01, 0.12)
$700
($100, $3000)
$8.0M
($1.5M, $33.1M)
†Benefits reported in $2017
The PIM-predicted BLLs were low under both the status quo and counterfactual scenarios; however, even low-level Pb exposure is a causal risk factor for adverse cognitive effects11,21.
Although the exact dose-response relationship between BLL and IQ is not known, evidence suggests the relationship is non-linear, with the steepest IQ losses occurring at the lowest BLLs6,58,60. Thus, improvements on the margins of BLLs could produce population benefits.
Indeed, Muenning stated that “differences in IQ associated with low to moderate levels of lead exposure are generally small and may be difficult to detect” although “when aggregated across millions of individuals, even small differences in IQ can make a major impact”62. Similarly, the
American Academy of Pediatrics stated that “focusing efforts on children who have [elevated blood lead concentrations] (>5μg/dL) is efficient but will fail to preserve the majority of lost IQ points in US children”11. In fact, 80% of Pb-associated IQ points lost among US children occur
among children without elevated BLLs11. Given that medical interventions do not currently exist
to reverse the effects of blood-Pb at low levels, interventions to prevent any childhood Pb-exposure are critical and could yield population benefits.
Even when considering the maximum benefit of the least conservative scenario (i.e. upper 95th% bound associated with the logarithmic dose-response relationship), it is unlikely the
benefits associated with connection to community water would outweigh the costs of the intervention. The cost of extending community water services are highly site-specific and depend on factors such as zoning, distance to existing water infrastructure, and housing density, among many other factors. Prior graduate work conducted at the University of North Carolina at Chapel Hill estimated connecting Wake County private well households to
community water supplies had a present value cost-per-household ranging from $14,500 to $44,000 ($2017)86–89. These studies primarily investigated the costs of connecting extraterritorial jurisdiction (ETJ) neighborhood households to community water supplies. Such study areas likely represent lower-bound costs for an infrastructure-based intervention in Wake County, given that the study households were already near existing infrastructure and were in relatively densely populated neighborhoods. Even when considering a scenario with best-case benefits and best-case costs, it would still require two children per household to obtain positive net benefits. Under the median estimated benefits and median estimated costs, it would require nine children per household under the logarithmic dose-response relationship and 38 children per household under the piecewise linear relationship. It is therefore reasonable to conclude connection to community water service is likely not a cost-effective intervention to minimize childhood Pb exposure, particularly when other interventions—including potentially lower cost interventions, such as water filters—are available.
delinquency7,57. Adult population benefits could feasibly relate to reduced hypertension,
cardiovascular disease, or all-cause mortality2,4,8. Such outcomes are difficult to quantify and
monetize given the current literature and BLLs but could be considered in a full CBA or cost-effectiveness analysis (CEA) in the future. The quantification of non-Pb-related benefits associated with connection to community water supplies has been investigated by other researchers, including reduced cases of acute gastrointestinal illness (AGI), improved water security, and reduced coping costs related to well maintenance or poor well performance47,48,90.
Although it was outside the scope of this research, integrating our identified benefits with others’
could demonstrate monetized intervention benefits that yield more favorable results when using a CBA perspective. Connection to municipal water may also have quality of life benefits that are more difficult to quantify and may not lend themselves to CBA perspectives90.
Connection to municipal water, although costly, may provide additional advantages over other interventions to mitigate Pb-exposures from private well water. Connection to regulated water supplies is considered a non-behavioral intervention, given that households no longer need to perform maintenance or testing on their own water supplies after the connection occurs—these costs and actions are then undertaken by the municipality under their regulatory requirements. Other potential interventions, such as filter systems, are considered behavioral interventions because they require the household to properly use, maintain, and replace filter components in accordance with the manufacturer. Such interventions would also require households to
costs should be evaluated in future research to determine cost-effectiveness of various interventions to support private well households.
Connection to community water supplies may also have environmental justice benefits.
Previous research has documented racial disparities associated with access to regulated water infrastructure in the American South26,45,91,92.In Wake County specifically, MacDonald Gibson et
al. found increasing odds of exclusion from community water supplies as the proportion of Black residents increased. This could create a disproportionate burden of exposure to water-Pb among predominantly Black communities. Given the role of cognitive ability on educational attainment93, and in turn, the role of educational attainment on lifetime earnings94, exclusion
from municipal services and subsequent Pb-exposure from well water could be a largely unexplored pathway for the perpetuation of racial and socioeconomic inequities. Thus, connection to consistent, regulated water supplies may be a step forward in addressing decades of inequities and could provide health, socioeconomic, and quality of life benefits for historically marginalized communities.
Many economic evaluations have quantified the holistic costs of childhood lead exposure57,61,62,
although few evaluations have examined the costs of Pb exposure arising from drinking water specifically. When drinking water is specifically evaluated, the focus primarily remains on lead service line replacement or other hazard controls for community water system users24. One
study found that lead service line replacement was associated with a productivity benefit of $1800 to $5600 per child, depending on the assumptions for the initial water-Pb
concentrations24. Another study evaluated two Pb drinking water interventions and found a
benefit of approximately $2000 to $4000 per child for Pb-bearing fixture/solder replacement and an additional $2000 to $4000 benefit for lead service line replacement95. Despite the difference
to our study’s estimates. To our knowledge, our study is the first benefits estimate conducted for the population of private well households specifically.
Furthermore, many Pb economic evaluations do not capture the rapid progress made in
decreasing GM BLLs in the United States and may not reflect the costs of low BLLs. Muenning conducted an economic evaluation of a scenario in which no child in the United States
exceeded a BLL of 1 μg/dL and found benefits on the order of trillions of dollars62. Given recent
progress in decreasing GM BLLs, this appears to be an achievable goal; however, achieving it will take concerted efforts on the margins of already low BLLs. This will include identifying and remedying largely overlooked exposure pathways, such as private well water. That is, private wells could present a persistent contribution of Pb to population GM BLLs if no interventions are undertaken. Thus, additional research is required to identify where resources might be
effectively allocated in mitigating previously unexplored Pb-exposure pathways such that these considerable population benefits can be realized.
This research could be used in future public policy analyses to inform infrastructure decision-making and/or public-health decision-decision-making. It could be used as a benefits input in a CBA/CEA when fully evaluating the connection of private well households to community water, in
conjunction with the range of other expected health and economic benefits (e.g. reduced cases of AGI, improved water security, reduced well ownership costs etc.). It could also be used as a comparator for evaluating several hazard control options to support private well households in minimizing their Pb-exposures (e.g. connection to community water, flushing protocols, filters, well water treatment systems, supplementary bottled water, etc.).
4.2. Performance of the population intervention model in blood lead level
modeling
found a different modeling approach, a PIM, yielded similar results with respect to the predicted relative change in BLLs arising from the same intervention—the IEUBK model predicted BLLs would decrease by 13.3% and the PIM predicted a decrease of 16.5%. The point estimate for the relative change generated by the IEUBK model was within the 95% confidence interval for the relative change generated by our PIM. Given that the two methodologies arrived at similar relative results despite different underlying mechanisms (i.e. pharmacokinetics vs.
sociodemographic/built environment characteristics), this suggests our PIM generally performs in accordance with widely accepted BLL modeling methods. The smaller relative change generated by the IEUBK model is likely due to our use of water-Pb concentrations from Tier-1 (i.e. higher Pb-risk) households in the counterfactual scenario—typical community water system POU samples would likely have lower water-Pb concentrations, yielding larger relative changes between the status quo and counterfactual BLLs.
Although this PIM and the estimated downstream benefits are tailored to Wake County and are not necessarily generalizable to different populations, it could provide a framework of methods for BLL modeling and benefits estimations with more readily available surveillance, census and parcel data rather than the resource-intensive environmental sampling required to develop population-specific inputs for IEUBK modeling. Prior research by Schultz et al. has similarly demonstrated validated sociodemographic/built environment methods for modeling BLLs, although water sources (i.e. private wells) were not considered96. Our PIM reaffirms the concept
4.3. Limitations
This project is primarily an integration of existing research and thus draws on the strengths and limitations of the underlying studies, the way we have chosen to assemble their data, and what we have chosen to omit in this project.
The underlying PIM was developed from sociodemographic and built environment data rather than directly from water-Pb concentrations; however, the relationship between water source and BLLs developed by MacDonald Gibson et al. was highly statistically significant (p<0.001) when controlling for other covariates known to be associated with BLLs. The BLL surveillance data used to build the underlying regression model by MacDonald Gibson et al. is not a random draw from the population of Wake County children and there may be some level of selection bias. Children in the North Carolina Lead Prevention Surveillance Program are “more likely to be economically disadvantaged or otherwise ‘at risk’ for lead exposure”97. This type of bias may
affect the extrapolation of modeled individual benefits to the broader Wake County cohort; however, 45.6% of Wake County children aged 12-24 months were tested in 201798, suggesting
reasonable testing penetrance for targeted age groups in the county.
The BMD study that underpins the IQ loss estimations relies on older data sets, which may not reflect the relationship of BLLs and IQ at levels currently observed in the United States’
population. In general, predicting the health effects expected at “the lowest measurable levels is difficult”60, which introduces uncertainty in the final results, as previously described.
Furthermore, low predicted BLLs generally precludes the quantification of other benefits associated with Pb-control (e.g. avoided environmental investigation costs, avoided attention deficit-spectrum treatment, etc.), as the evidence base does not appear to be sufficiently developed to extrapolate these costs to very low BLLs. Therefore, this study could be
known spectrum of benefits is wide. It may also be conservative given potential outlier cases that were not captured in this modeling exercise. For example, Pieper et al. documented cases of children on private well water in Macon County, NC in which previously unexplained elevated BLLs (5.6μg/dL to 10.5μg/dL) were eventually traced to the household’s private well; the
children’s BLLs decreased after well water Pb-control measures were employed39. Such
extreme cases likely exist in Wake County, NC and their connection to community water supplies would yield substantial benefits.
Our modeling assumptions and inputs will influence the final results. For instance, we obtained present value lifetime earnings estimates under wage growth conditions ranging from 0.5% to 1%, although the period from 2004-2016 saw average annual wage growth between 0.3% and 0.5%83. Future productivity may be outside of our chosen bounds. Given the magnitude of
5. Conclusion
This research used a population intervention model to predict the change in blood lead levels expected under an intervention to mitigate lead exposures arising from private well water. Our evaluated public health intervention involved simulating the effect of moving a cohort of Wake County, NC children from unregulated private well water to regulated community water supplies. We used the results of the population intervention model to estimate expected health and economic benefits of the intervention. Based on our results, we anticipate connection to community water supplies will likely be unfavorable from a cost-benefit perspective when only considering IQ loss and lifetime earnings associated with lead exposure; however, there are numerous other intervention benefits that were not considered in this analysis, including other health effects associated with lead exposure, reduced cases of acute gastrointestinal illness, and improved water security. Therefore, this research could be used as an input for a broader economic evaluation of the intervention. Our expected benefits might also be used as a comparator to evaluate several public health interventions available for mitigating lead exposures from private well water.
Works Cited
1. Lewis, R. & Kosnett, M. Metals. in Current Diagnosis & Treatment: Occupational & Environmental Medicine (eds. LaDou, J. & Harrison, R.) (McGraw-Hill Education, 2014). 2. American Conference of Governmental Industrial Hygienists. BEI: Lead and inorganic
compounds. 1–16 (2017).
3. ATSDR. Toxicological Profile for Lead (Draft for Public Comment). ATSDR’s Toxicol. Profiles 1–561 (2019). doi:10.1201/9781420061888_ch106
4. Lanphear, B. P., Rauch, S., Auinger, P., Allen, R. W. & Hornung, R. W. Low-level lead exposure and mortality in US adults: a population-based cohort study. Lancet Public Heal.3, e177–e184 (2018).
5. Canfield, R. L. et al. Intellectual impairment in children with blood lead concentrations below 10 μg per deciliter. N. Engl. J. Med.348, 1517–1526 (2003).
6. Lanphear, B. P. et al. Low-level environmental lead exposure and children’s intellectual function: An international pooled analysis. Environ. Health Perspect.113, 894–899 (2005).
7. National Toxicology Program. Monograph on the health effects of low-level lead. NTP Monogr. (2012).
8. Zheutlin, A. R. et al. Low-level cumulative lead and resistant hypertension: A prospective study of men participating in the veterans affairs normative aging study. J. Am. Heart Assoc.7, 1–8 (2018).
9. Almeida Lopes, A. C. B. De et al. Association between blood lead and blood pressure: A population-based study in Brazilian adults. Environ. Heal. A Glob. Access Sci. Source16, 1–10 (2017).
10. Centers for Disease Control and Prevention. At-Risk Populations. Childhood Lead Poisoning Prevention (2019). Available at:
https://www.cdc.gov/nceh/lead/prevention/populations.htm?CDC_AA_refVal=https%3A% 2F%2Fwww.cdc.gov%2Fnceh%2Flead%2Ftips%2Fpopulations.htm. (Accessed: 28th November 2019)
11. American Academy of Pediatrics Council on Environmental Health. Prevention of Childhood Lead Toxicity. Pediatrics138, (2016).
12. Sampson, R. J. & Winter, A. S. Poisoned Development: Assessing Childhood Lead Exposure As a Cause of Crime in a Birth Cohort Followed Through Adolescence. Criminology56, 269–301 (2018).
13. Winter, A. S. & Sampson, R. J. From lead exposure in early childhood to adolescent health: A chicago birth cohort. Am. J. Public Health107, 1496–1501 (2017).
14. Kordas, K. et al. Deficits in cognitive function and achievement in Mexican first-graders with low blood lead concentrations. Environ. Res.100, 371–386 (2006).
16. Wheeler, W., Brown, M. J. Blood Lead Levels in Children Aged <5 Years - United States, 2007-2013. Morb. Mortal. Wkly. Rep. 62, 245–248 (2013).
17. Centers for Disease Control and Prevention. Blood Lead Levels in Children. (2019). Available at: https://www.cdc.gov/nceh/lead/prevention/blood-lead-levels.htm. 18. Tsoi, M. F., Cheung, C. L., Cheung, T. T. & Cheung, B. M. Y. Continual Decrease in
Blood Lead Level in Americans: United States National Health Nutrition and Examination Survey 1999-2014. Am. J. Med.129, 1213–1218 (2016).
19. Jones, R. L. et al. Trends in blood lead levels and blood lead testing among US children aged 1 to 5 years, 1988 2004. Pediatrics123, (2009).
20. MacDonald Gibson, J., Fisher, M., Clonch, A., Macdonald, J. M. & Philip, J. Children Drinking Private Well Water Have Higher Blood Lead Than Those with City Water. Proc. Natl. Acad. Sci. U. S. A. 1–22
21. Centers for Disease Control and Prevention. Low Level Lead Exposure Harms Children: A Renewed Call for Primary Prevention. (2012).
22. United States Environmental Protection Agency. Basic Information about Lead in Drinking Water. (2019). Available at: https://www.epa.gov/ground-water-and-drinking-water/basic-information-about-lead-drinking-water.
23. Hanna-Attisha, M., LaChance, J., Sadler, R. C. & Schnepp, A. C. Elevated blood lead levels in children associated with the flint drinking water crisis: A spatial analysis of risk and public health response. Am. J. Public Health106, 283–290 (2016).
24. Health Impact Project. 10 Policies to Prevent and Respond to Childhood Lead Exposure: A report from the Health Impact Project. (2017).
25. Levin, R. et al. Lead exposures in U.S. children, 2008: Implications for prevention. Environ. Health Perspect.116, 1285–1293 (2008).
26. Stillo, F. & Gibson, J. M. Racial disparities in access to municipal water supplies in the American south : Impacts on children’s health. 10, 309–323 (2018).
27. Triantafyllidou, S. & Edwards, M. Lead (Pb) in tap water and in blood: Implications for lead exposure in the United States. Crit. Rev. Environ. Sci. Technol.42, 1297–1352 (2012).
28. Centers for Disease Control and Prevention. Lead in drinking water and human blood lead levels in the United States. Morb. Mortal. Wkly. Rep.61, 1–9 (2012).
29. Pieper, K. J., Kriss, R., Tang, M., Edwards, M. A. & Katner, A. Understanding lead in water and avoidance strategies: A United States perspective for informed decision-making. J. Water Health17, 540–555 (2019).
30. U.S. Environmental Protection Agency. Use of Lead Free Pipes, Fittings, Fixtures, Solder and Flux for Drinking Water. Groundwater and Drinking Water Available at:
https://www.epa.gov/sdwa/use-lead-free-pipes-fittings-fixtures-solder-and-flux-drinking-water.
31. U.S. Environmental Protection Agency. Lead and Copper Rule. Drinking Water Requirements for States and Public Water Systems Available at: