THE CONTRIBUTION OF TEMPERATE PHAGES TO COLIPHAGE NUMBERS DETECTED BY PLAQUE ASSAY
Sharon Jiang
A thesis submitted to the faculty at the University of North Carolina at Chapel Hill in partial fulfillment of the requirements for the degree of Master of Science in the Department of Environmental Sciences and Engineering in the Gillings School of Global Public Health.
Chapel Hill 2017
Approved by:
Jill Stewart
Mark Sobsey
ii © 2017 Sharon Jiang
iii
ABSTRACT
Sharon Jiang: The contribution of temperate phages to coliphage numbers detected by plaque assay
(Under the direction of Jill Stewart)
Coliphages are potential indicators of human fecal contamination and enteric viruses in
ambient water, but current detection methods may underestimate counts by overlooking effects
of temperate phages that may reside within the cells of native bacteria. This study evaluated the
contribution of temperate phages to male-specific and somatic coliphages numbers from diluted
sewage detected by EPA Method 1602, the single agar layer plaque assay. Twenty-two parallel
assays were run with and without induction using mitomycin C or ultraviolet light as inducing
agents. Ultraviolet light appeared to have toxic effects but coliphage counts of samples exposed
to mitomycin C were significantly higher (Wilcoxon signed rank, p < 0.05) than non-induced counts for both somatic and male-specific coliphages. The difference between induced and
non-induced counts tended to be small but could affect regulatory decisions for counts close to
iv
ACKNOWLEDGEMENTS
I would like to thank my thesis advisor, Dr. Jill Stewart for her support and guidance
throughout the course of my undergraduate and graduate work. I would also like to thank my
committee members Dr. Louise Ball and Dr. Mark Sobsey for their valuable contributions to this
thesis. This work was also supported by the advice and assistance of Sarah Rhodes, Claire
Tipton, Emily Bailey, Collin Coleman, Yvonne Yuen, and the rest of the members of the Stewart
and Sobsey lab groups. I am also grateful to KS Anderson for his aid with ultraviolet dose
calculations and assumptions. This accomplishment would not have been possible without the
help and support from all mentioned.
v
TABLE OF CONTENTS
LIST OF TABLES ... vii
LIST OF FIGURES ... viii
LIST OF ABBREVIATIONS ... ix
CHAPTER 1: INTRODUCTION ... 1
CHAPTER 2: OBJECTIVES ... 3
CHAPTER 3: REVIEW OF LITERATURE ... 4
Coliphages as fecal indicators ... 4
The lytic and lysogenic life cycles ... 7
Prophage and prophage-related entities ... 9
Inducing agents ... 10
Mitomycin C. ... 10
Ultraviolet radiation. ... 12
Current knowledge of lysogenic contribution in environmental samples ... 13
Marine environments. ... 13
Fecally-contaminated waters. ... 14
Study design concerns. ... 14
Coliphages and water quality guidelines. ... 15
CHAPTER 4: METHODS ... 17
vi
Enumeration of coliphages by the single agar layer procedure ... 17
Preparation of stock solutions. ... 18
Preparation of coliphage stock and host bacteria stock cultures. ... 18
Day one: Preparation of overnight E. coli host cultures. ... 20
Day two: Sample collection and processing. ... 20
Day three: Interpretation of single agar layer results. ... 22
Statistical methods... 23
CHAPTER 5: RESULTS ... 25
Descriptive statistics: Assays of somatic coliphages ... 25
Descriptive statistics: Assays of male-specific coliphages ... 27
Comparison of assays of non-induced and induced coliphages ... 32
Ongoing precision and recovery results ... 38
CHAPTER 6: DISCUSSION ... 39
CHAPTER 7: CONCLUSION ... 45
APPENDIX A. UV DOSE CALCULATION ... 47
APPENDIX B: MALE-SPECIFIC COLIPHAGE COUNT DATA ... 48
APPENDIX C: SOMATIC COLIPHAGE COUNT DATA ... 49
vii
LIST OF TABLES
Table 1. Attribute comparison of Enterococci, E. coli, and coliphages as indicators
of fecal contamination in water ... 7
Table 2. Ultraviolet (254 nm) doses used in selected prophage induction studies ... 12
Table 3. Statistical measures of coliphage counts from assays of somatic coliphages... 26
Table 4. Statistical measures of coliphage counts from assays of male-specific coliphages ... 28
Table 5. Kruskal-Wallis test results for somatic and male-specific coliphage assays ... 32
Table 6. Comparison of assays run with and without exposure to inducing agents for counts of somatic and male-specific coliphages estimated using EPA Method 1602... 33
viii
LIST OF FIGURES
Figure 1. The reductive activation cascade of mitomycin C resulting in interstrand
crosslinking of DNA ... 11
Figure 2. Sample distributions of coliphage counts from assays of somatic coliphages ... 27
Figure 3. Sample distributions of coliphage counts from assays of male-specific coliphages ... 29
Figure 4. Comparison of somatic coliphage counts from diluted sewage with and without exposure to inducing agents (NON – non-induced, MMC –
mitomycin C-induced, UV – UV-induced) ... 31
Figure 5. Comparison of male-specific coliphage counts from diluted sewage with and without exposure to inducing agents (NON – non-induced, MMC –
mitomycin C-induced, UV – UV-induced) ... 31
Figure 6. Differences between induced and non-induced counts of somatic
coliphages using mitomycin C as an inducing agent ... 35
Figure 7. Differences between induced and non-induced counts of male-specific
coliphages using mitomycin C as an inducing agent ... 35
Figure 8. Linear regression of non-induced coliphages as the independent variable and mitomycin C-induced coliphages as the dependent variable,
for somatic coliphages (Black line is line of equivalence where y = x) ... 37
Figure 9. Linear regression of non-induced coliphages as the independent variable and mitomycin C-induced coliphages as the dependent variable, for
ix
LIST OF ABBREVIATIONS
CI Confidence interval
DAL Double agar layer
DNA Deoxyribonucleic acid
EPA Environmental Protection Agency
FIB Fecal indicator bacteria
MMC Mitomycin C
NRC National Research Council
OD Optical density
PBS Phosphate-buffered saline
PFU Plaque-forming units
PSI Pounds per square inch
RNA Ribonucleic acid
SAL Single agar layer
UWRRC Urban Water Resources Research Council
1
CHAPTER 1: INTRODUCTION
Fecal indicator organisms, such as thermotolerant coliforms and Escherichia coli (E. coli), are easy-to-measure microorganisms that indicate the presence of fecal contamination in environmental media. When these organisms are detected, they imply the presence of pathogens
and are considered the best available practical alternative to direct monitoring for fecal
pathogens (Ashbolt et al. 2001; UWRRC 2014). The validity of an effective fecal indicator
organism depends on its similarity in characteristics to fecal pathogens such as having similar
survival and multiplication rates in the environment and similar physical, chemical and
morphological properties. Because fecal indicator bacteria, a widely-used indicator group, are
poor surrogates in representing and detecting human enteric viruses in water, coliphages,
bacteriophages of E. coli bacteria, have been proposed as better indicators of viruses in fecally-contaminated water (EPA Office of Water 2015; Jofre et al. 2016).
Currently, somatic and male-specific coliphages are approved indicators for source water
and shellfish monitoring in the United States (EPA 2009; NSSP 2011) and for Type 2 reclaimed
water in North Carolina (NCAC 2011). Somatic coliphages are DNA viruses that infect by
attaching to receptor sites located on the cell wall of E. coli. Male-specific coliphages are single-stranded RNA (Leviviridae group) and DNA (Inoviridae group) viruses that infect by attaching to receptor sites located on the fertility fimbriae of male strains of E. coli (NRC 2004). Recently, coliphages have begun to be reviewed as ambient water quality indicators due to the need for a
viral indicator of recreational water quality (EPA Office of Water 2015). A limitation to their
2
microflora of warm-blooded animals, through lytic infection and lysogenic induction. Wiggins
and Alexander found that different coliphages require different E. coli densities to replicate, usually between 103 and 104 colony-forming units per milliliter (CFU mL-1) (1985). Similarly,
Woody and Cliver suggested that F-specific RNA coliphage cannot replicate in nutrient-poor
environments when host cell density is below 104 CFU mL-1 (1997). However they found that
the addition of Enterococcus to the host cell culture resulted in increased phage yields, suggesting that the addition of Enterococcus supplies a factor that enhances phage replication (Woody and Cliver 1997). These two studies suggest that coliphages are not likely to replicate in
environmental waters of interest such as groundwater because the host cell density is not high
enough to support replication. Otherwise information is sparse on whether there is an
underestimation of coliphages from environmental samples by current detection methods
because they may neglect the impact of temperate phages, bacteriophages that have the ability to
enter the lysogenic life cycle. Rather than immediately lysing the host bacteria they infect,
temperate phages can integrate into the genome of their hosts as a prophage or occur as an
extrachromosomal plasmid within the host bacterium. The host bacterium continues to function
and reproduce normally until the lytic cycle is triggered by an induction event.
This study aims to evaluate the significance of the contribution of temperate phages to
male-specific and somatic coliphages counts from diluted raw sewage detected by EPA Method
1602. Prophage induction on native bacteria from diluted sewage was done by mitomycin C and
ultraviolet radiation. If the contribution of temperate phages is significant enough to surpass
coliphage criteria levels set by government regulations, then it would suggest that more research
3
CHAPTER 2: OBJECTIVES
1. To compare plaque counts of somatic coliphages from diluted sewage samples with and
without induction of lysogenic bacteriophages.
2. To compare plaque counts of male-specific coliphages from diluted sewage samples with
4
CHAPTER 3: REVIEW OF LITERATURE
Historically, fecal indicator bacteria (FIB) have been used to detect and determine the
level of fecal contamination in environmental waters in order to protect the general population
from water-related pathogens associated with human excreta (EPA 2006; EPA Office of Water
2015). However, FIB are poor indicators of waterborne pathogens that are not bacteria such as
enteric viruses which have been suggested as significant causative agents of recreational
waterborne illnesses (Sinclair et al. 2009; Soller et al. 2010). Instead of FIB, bacteriophages
(phages), or viruses which infect bacteria, have been proposed as potentially valuable indicators
for enteric viruses from fecal contamination because they share fundamental characteristics with
viral pathogens such as structure, composition, morphology, size, and site of replication (Grabow
2001; Ashbolt et al. 2001; EPA Office of Water 2015). Another advantage of using phages as
fecal indicators is that they are relatively easy, quick, and inexpensive to cultivate in laboratories.
Coliphages, in particular male-specific and somatic coliphages, have been given the most
attention in the United States as an indicator of human viral pathogens. Currently, coliphages are
one of the approved fecal indicator microorganisms that can be used to monitor microbial water
quality in public groundwater systems (EPA 2006).
Coliphages as fecal indicators
An ideal fecal indicator should be correlated to health risk, have similar or greater
survival to fecal pathogens, have similar or greater transport to fecal pathogens, be present in
greater numbers than fecal pathogens, and be specific to a fecal source or an identifiable source
5
attributes because they are specific to and numerous in the gastrointestinal tract of humans and
other warm-blooded animals (Grabow 2001). In one gram of human feces, there can be up to 104
coliphages (Fortier and Sekulovic 2013). Coliphages also survive in similar ways as other enteric
viruses because they are non-enveloped viruses, making them more resistant to degradation and
inactivation in the environment (Grabow 2001).
Currently, somatic and male-specific coliphages are considered approved indicators for
monitoring shellfish and source water quality (EPA 2009; NSSP 2011). Somatic coliphages are
DNA viruses that infect by attaching to receptor sites located on the cell wall of E. coli. Male-specific coliphages are single-stranded RNA (Leviviridae group) and DNA (Inoviridae group) viruses that infect by attaching to receptor sites located on the fertility fimbriae of male strains of
E. coli (NRC 2004). These fertility fimbriae are produced only when the temperature is above 30°C. Because of this temperature requirement, male-specific coliphages are unlikely to replicate
in the environment, further supporting their ability as surrogates for many enteric viruses which
also fail to multiply in the environment (Grabow 2001). A subgroup of male-specific coliphages
is the male-specific RNA coliphage group. Male-specific RNA coliphages in particular have
physical structures, composition, and morphology that closely resemble those of many human
enteric viruses, making them attractive viral indicator candidates (Grabow 2001). Male-specific
RNA coliphages can be further divided into four groups, through serotyping or genotyping, by
whether they are of human or animal origin, although there is some overlap of the groups (NRC
2004).
Some studies indicate that somatic coliphages numbers may exceed those of
male-specific coliphages in fecally-contaminated water, and may be more persistent in warmer water
6
overall, coliphages can be considered equally persistent as or more persistent than enteric viruses
(EPA Office of Water 2015). Although there have been many disparate results, there exists
epidemiological evidence suggesting a relationship between coliphages and gastrointestinal
illness in humans from recreational exposure (Colford et al. 2007; Abdelzaher et al. 2011; EPA
Office of Water 2015; Griffith et al. 2016; Jofre et al. 2016). Even without a clear correlation
between coliphage densities and human viruses in water, there is evidence that somatic and
male-specific coliphages are more strongly associated with pathogenic viruses than traditional
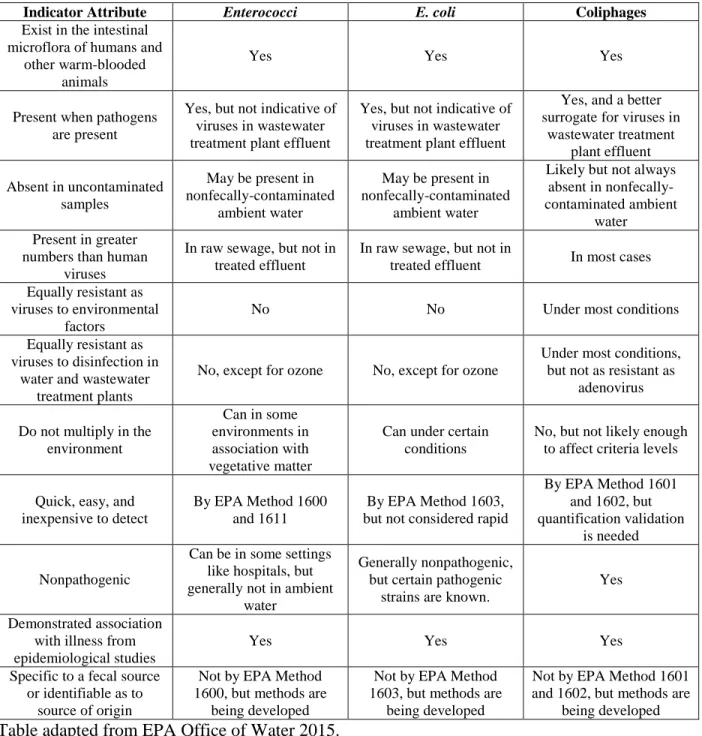
FIB (EPA Office of Water 2015; Jofre et al. 2016). A summary of how coliphages compare to
Enterococci and E. coli, traditional fecal indicator bacteria, in terms of ideal indicator attributes can be found in Table 1.
According to Table 1, coliphages meet or exceed Enterococci and E. coli in many indicator attributes, supporting coliphages as fecal indicator microorganisms. However, a
potential objection to the use of coliphages as indicators of ambient water quality is their
potential replication within E. coli cells that may occur in aquatic systems (EPA Office of Water 2015; Jofre et al. 2016). Coliphages can replicate in the environment by the lytic and lysogenic
7
Table 1. Attribute comparison of Enterococci, E. coli, and coliphages as indicators of fecal contamination in water
Indicator Attribute Enterococci E. coli Coliphages
Exist in the intestinal microflora of humans and
other warm-blooded animals
Yes Yes Yes
Present when pathogens are present
Yes, but not indicative of viruses in wastewater treatment plant effluent
Yes, but not indicative of viruses in wastewater treatment plant effluent
Yes, and a better surrogate for viruses in
wastewater treatment plant effluent
Absent in uncontaminated samples
May be present in nonfecally-contaminated
ambient water
May be present in nonfecally-contaminated
ambient water
Likely but not always absent in nonfecally-contaminated ambient
water Present in greater
numbers than human viruses
In raw sewage, but not in treated effluent
In raw sewage, but not in
treated effluent In most cases
Equally resistant as viruses to environmental
factors
No No Under most conditions
Equally resistant as viruses to disinfection in
water and wastewater treatment plants
No, except for ozone No, except for ozone
Under most conditions, but not as resistant as
adenovirus
Do not multiply in the environment
Can in some environments in association with vegetative matter
Can under certain conditions
No, but not likely enough to affect criteria levels
Quick, easy, and inexpensive to detect
By EPA Method 1600 and 1611
By EPA Method 1603, but not considered rapid
By EPA Method 1601 and 1602, but quantification validation
is needed
Nonpathogenic
Can be in some settings like hospitals, but generally not in ambient
water
Generally nonpathogenic, but certain pathogenic
strains are known.
Yes
Demonstrated association with illness from epidemiological studies
Yes Yes Yes
Specific to a fecal source or identifiable as to
source of origin
Not by EPA Method 1600, but methods are
being developed
Not by EPA Method 1603, but methods are
being developed
Not by EPA Method 1601 and 1602, but methods are
being developed Table adapted from EPA Office of Water 2015.
The lytic and lysogenic life cycles
The two main lifecycle categories of phages are virulent and temperate phages. While
virulent phages can only replicate through a lytic cycle, temperate phages can replicate through a
8
phage genome into the host occurs. If the phage follows the lytic life cycle, then the genome of
the virulent phage is immediately replicated and packaged into virions using the replication
mechanism of the host cell. The host cell bursts, or lyses, and the newly-created virions are
released into the environment. The alternative to the lytic cycle is the lysogenic cycle, where
lytic multiplication is repressed and the temperate phage genome is incorporated into the genome
of the host. The repressed phage DNA, or prophage, is passed on to daughter cells every time the
host cell undergoes cell division (Golais et al 2013; Bondy-Denomy and Davidson 2014). A
lysogen, or lysogenic bacterium, is a bacterial cell that contains prophage, which is usually
integrated into the host bacteria’s genome. Although different individuals of a specific temperate
phage always have the same integration site on the phage chromosome, the integration of phage
DNA doesn’t necessarily occur at the same site in a bacterial chromosome. For example in E.
coli, phage λ DNA usually integrates at one site while phage Mu DNA integrates randomly into
host DNA (Casjens 2003). Sometimes rather than integrating, the prophage can be present as or
in an extrachromosomal plasmid within the host bacterium.
Prophages are one of the main sources of genetic diversity and strain variation of E. coli
(Fortier and Sekulovic 2013). Ubiquitous and numerous in bacterial communities, prophages can
constitute up to 20% of a bacterial genome. However, some of these prophages can be defective
or undergoing mutational decay (Paepe et al. 2016). Such prophages that may still contain
functional genes but are unable to cause the full phage replication cycle are referred to as
defective or cryptic prophages (Casjens 2003). If the prophage remains fully functional, lysogeny
is typically maintained through a phage repressor binding to phage operator sequences to repress
early promoters of the lytic cycle (Fortier and Sekulovic 2013). The lysogenic cycle can lead to
9
environmental trigger such as exposure of the host bacterium to a chemical or physical stressor.
An induction event usually requires proteolytic cleavage and displacement of the phage
repressor, causing prophage genes required for lytic growth to be turned on (Fortier and
Sekulovic 2013). In a laboratory setting, proper prophage induction depends on factors such as
the concentration of the inducing agent and temperature of incubation to protect against mortality
of bacteria that are not lysogens (Raya and Hébert 2009). In the environment, induction rates are
usually too low to be considered a cost to host bacteria communities. Instead, prophages and
other prophage-related entities can provide a competitive advantage for the remaining lysogenic
population (Casjens 2003).
Prophage and prophage-related entities
Besides fully functional and defective prophages, there are three other types of
prophage-related entities: satellite prophages, bacteriocins, and gene transfer agents. Rather than carrying
their own virion structural genes, satellite prophages have evolved to rely on being encapsidated
by the virion proteins of other phages. Bacteriocins are bacterially-produced proteins that kill or
inhibit the growth of other bacteria. Gene transfer agents are bacterially-produced phage-like
particles that mediate horizontal gene transfer. The universal presence and the evolutionary
stability of prophage-related bacteriocins and gene transfer agents suggests that there may be a
positively-selected function associated with such entities (Casjens 2003). Sometimes fully
functional prophage gene products expressed by the lysogen are also advantageous to the
bacterial host. In the λ genome, the products of the bor gene expressed during lysogeny become
10
sensitivity (Barondess and Beckwith 1995). Such genes that are expressed from the prophage in
a lysogen and alter the properties of the lysogen are called lysogenic conversion genes.
Inducing agents
In bacteriophage λ, lysis and lysogeny depend on the relative expression of regulatory
proteins CI (promotes lysogeny) and Cro (promotes lysis). The CII protein, which represses
transcription from the lytic promoters and positively regulates its own synthesis, depends on
factors that measure the cellular energy level of the host. In low nutrient conditions, the signaling
molecule cyclic AMP (cAMP) is high, promoting CII stabilization and lysogeny. Under
sufficient nutrient conditions, cAMP levels are reduced within the host which also reduces the
level of lysogenization. The lysogenic induction, also known as prophage induction, occurs when
the SOS system of the host bacterium is activated in response to DNA damage. The SOS
response activates a protein that degrades the CI repressor (the lysogeny promoter), allowing for
the excision of the prophage and the recommencement of the lytic cycle (Raya and Hébert 2009).
As DNA-damaging agents, mitomycin C (hereafter referred to as MMC, although MC is another
common abbreviation) and ultraviolet (UV) radiation are often used for activating the SOS
system of the host bacterium, resulting in prophage induction (Raya and Hébert 2009; Fortier
and Sekulovic 2013).
Mitomycin C. After observing that the impaired DNA synthesis of E.coli B cells treated with MMC could be restored by infection with phage T2r2, Otsuji et al. found that MMC could also induce the development of active phages in the lysogenic strain of E. coli K-12 (1959). Since then MMC has been used to induce prophages from a variety of bacteria, including
11
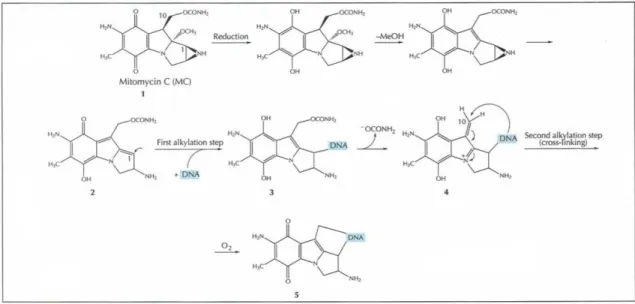
It can form crosslinks between complementary DNA strands, which can lead to mutagenesis,
apoptosis, the inhibition of DNA synthesis, and the initiation of DNA repair events. Rather than
MMC reacting directly with DNA, it is only after a reductive activation cascade of MMC,
culminating in the opening of an aziridine ring, that the activated MMC can covalently react to
DNA and create cross links, see Figure 1 (Tomasz 1995).
The suggested concentration of MMC that should be used for prophage induction ranges
from 0.1 to 2 µg mL-1, as higher concentrations can be toxic for bacterial cells (Raya and Hébert
2009). The use of MMC as an inducing agent for prophages from water samples can be found in
many studies on lysogenic bacteria, strengthening its status as a commonly used inducing agent
along with ultraviolet radiation (Jiang and Paul 1996; Jiang and Paul 1997; Muniesa and Jofre
2007).
Figure 1. The reductive activation cascade of mitomycin C resulting in interstrand crosslinking of DNA
12
Ultraviolet radiation. UV radiation is form of electromagnetic radiation involving the wavelength region between 100 and 480 nm. The most energetic UV wavelengths, wavelengths
between 100 and 200 nm, are referred to as vacuum UV or Schumann UV. UV-C radiation
involves wavelengths between 200 and 280 nm, while UV-B and UV-A radiation involves
wavelengths from 280 to 315 nm and 315 to 380 nm, respectively. UV radiation, particularly in
the UV-B and UV-C regions, is absorbed by DNA, which leads to photoproducts such as
pyrimidine dimers. Photoproducts directly related to exposure to UV-C radiation include
DNA-protein cross-links and DNA single-strand breaks. (Kiefer 2007). DNA-DNA-protein cross-links
caused by UV radiation activates cellular repair systems, including the RecA protein degradation
of a repressor that suppresses lysis which allows a prophage to excise and begin the lytic cycle
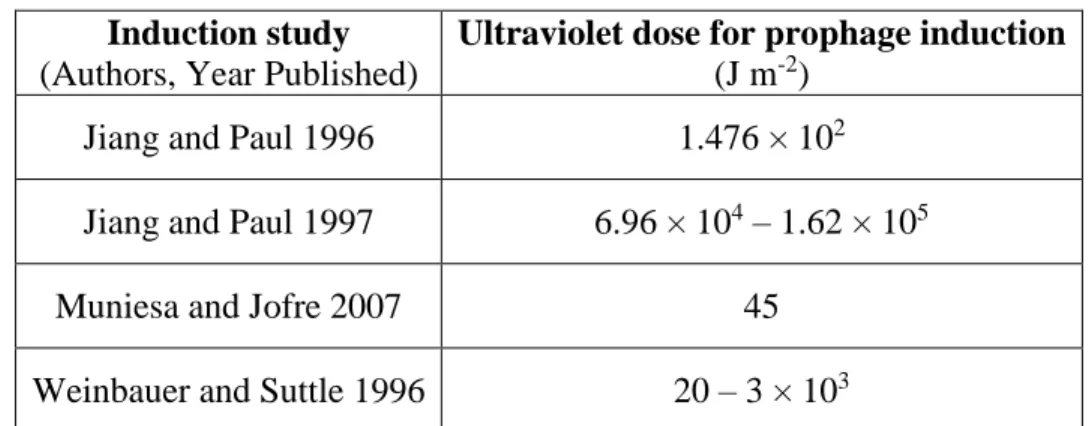
(Weinbauer and Suttle 1996). Many studies use UV-C to induce prophages, though the final UV
dose can vary substantially, see Table 2 (Jiang and Paul 1996; Weinbauer and Suttle 1996; Jiang
and Paul 1997; Muniesa and Jofre 2007). The variation in UV doses likely depends on the
volume of sample that was subjected to UV radiation and the length of time the induced sample
was incubated afterward.
Table 2. Ultraviolet (254 nm) doses used in selected prophage induction studies
Induction study
(Authors, Year Published)
Ultraviolet dose for prophage induction
(J m-2)
Jiang and Paul 1996 1.476 × 10²
Jiang and Paul 1997 6.96 × 10⁴ – 1.62 × 10⁵
Muniesa and Jofre 2007 45
Weinbauer and Suttle 1996 20 – 3 × 10³
13
Currently, there are relatively few studies on the potential contribution of temperate
phages to coliphage numbers in fecally-contaminated water. Several past studies on lysogeny
and coliphages have focused on the contribution with regards to marine samples and native
bacteria, not specifically coliphages. The following subsections will focus on the currently
available literature on lysogenic contribution to bacterial numbers.
Current knowledge of lysogenic contribution in environmental samples
It is theorized that lysogeny is the preferred lifecycle when the host bacteria population is
too low for the maintenance of continued lytic infections. This theory has found support by
observations that demonstrate an increased prevalence of lysogeny in oligotrophic environments
where there is a low density of slow-growing bacteria, but also contradiction from studies
finding no significant difference between the percentage of lysogenic cells in oligotrophic and
eutrophic environments (Weinbauer and Suttle 1996; Jiang and Paul 1997; Chibani-Chennoufi et
al. 2004).
Marine environments. Study results on marine environments are highly varied concerning the incidence of lysogenic bacteria in marine environments and whether they are an important
source of phage production. Weinbauer and Suttle (1996) reported that lysogenic bacteria
induced by MMC ranged from 0.07 to 4.4% of the total bacterial community while Jiang and
Paul found that 43% of their studied bacterial community was lysogenized (1996). Although
these percentages vary significantly, both studies concluded that under normal conditions,
lysogenic viral production does not contribute significantly to the total population (Weinbauer
and Suttle 1996; Jiang and Paul 1997). Weinbauer and Suttle also noted that induction with
MMC seemed most efficient although no statistical significance could be established (1996). In
14
bacterial community that lysogenic bacteria constitutes is highly variable, but overall are not
considered to contribute significantly to viral counts in the environment.
Fecally-contaminated waters. Muniesa and Jofre found that prophages did not
significantly contribute to the numbers of free somatic coliphages in a variety of environmental
samples including raw sewage, river water, and sea water (2007). Although they found that
induced samples were significantly different from non-induced ones (Students’ t-test, p < 0.05), in most samples the ratio between the numbers of induced phages and non-induced phages
approached 1, meaning the difference was small. Using the Most Probable Number method, the
authors estimated that in a sample containing more than 105E. coli cells there were 6.5 [3.5, 12] MMC-inducible cells per mL, 4.2 [1.7, 10.2] ciprofloxacin-inducible cells per mL and 1.4 [0.5,
4.0] UV-inducible cells per mL (Muniesa and Jofre 2007). Similar to Weinbauer and Suttle
(1996), the authors noted that induction with MMC seemed most efficient but could not establish
a significant difference due to the overlap of the lower and upper limit ranges (Muniesa and Jofre
2007). Muniesa and Jofre concluded that the induction of prophages, whether from
contamination or from native bacteria, does not significantly contribute to the numbers of free
somatic coliphages in environmental waters (2007).
Study design concerns. It is possible that studies searching for the effect of prophage induction may result in a minimum number of functional prophages because they depend on
successful induction and use of permissive indicator strains (Casjens 2003). On the other hand, it
is also possible that laboratory-induced prophage numbers could be higher than the numbers that
are induced in the environment due to the controlled and ideal conditions set during the specific
search of prophages. Additionally, commonly used inducing agents such as MMC and UV-C are
15
lysogenic bacteria are likely a small source of phage numbers (1997). In short, there is likely a
difference between the number of prophages that exist in the environment, the number that is
naturally induced in the environment, and the number that is detected and induced in a laboratory
setting. Jiang and Paul noted that lysogenic production of viruses may have a delayed
amplification effect, where progenies of the originally infected bacterium after an induction
event may produce in turn a larger number of viruses (1997). Finally, the variety of modeling
methods and statistical tests were used to understand prophage induction data may also affect the
reported results. For example, in a study done by Muniesa and Jofre, Student’s t-test was applied to understand the difference between assays of non-induced and induced coliphages (2007).
However, an assumption of Student’s t-test is that there is an underlying Normal distribution, which may not be the case for coliphages in the environment.
Coliphages and water quality guidelines. Because many regulatory water quality
guidelines are based on threshold levels, even small differences in indicator concentrations may
affect whether or not waters are in compliance. For example, according to the National Shellfish
Sanitation Program, emergency-closed shellfish growing areas cannot be reopened for harvest if
male-specific coliphage counts exceed background levels or a level of 50 coliphages per 100
grams of shellfish sample (NSSP 2011). It may be possible for a growing area to be falsely
opened to harvest because temperate phages are not being detected with current plaque assay
methods. Another example of a regulation that involves coliphage threshold levels is the
regulation of Type 2 reclaimed water in North Carolina. In North Carolina, Type 2 reclaimed
water is highly treated wastewater reclaimed water that can be used for indirect contact irrigation
of food crops that do not need to be peeled, skinned, cooked, or thermally processed before
16
coliphages as well as a monthly geometric mean of less than or equal to 5 plaque-forming units
per 100 milliliters and a daily maximum of less than or equal to 25 plaque-forming units per 100
milliliters (NCAC 2011). While lysogenic contribution may be small in native bacterial
communities, the contribution may be significant in compliance situations based on such
threshold levels where the addition of a few coliphages may result in a significantly different
compliance status. Thus, more research is required to better understand the contribution of
temperate phages to counts from plaque assays that may be used for determining water quality
17
CHAPTER 4: METHODS
Sample collection and processing
The raw sewage samples used in these experiments came from the Mason Farm
Wastewater Treatment Plant run by the Orange County Water and Sewer Authority, a public,
non-profit agency that services the southern Orange County area of North Carolina. The grab
samples were collected in autoclaved bottles in the morning, usually between 7:00 and 9:00AM,
and stored on ice until processing which occurred within eight hours of collection. Samples were
collected from October 19, 2016 to February 16, 2017. The samples for somatic coliphage
detection were diluted 100-fold for processing while the samples for male-specific coliphage
detection were diluted 10-, 50-, or 100-fold in order to achieve countable dilutions.
Enumeration of coliphages by the single agar layer procedure
The standard single agar layer (SAL) plaque assay method (EPA 2001) was used to
quantify male-specific and somatic coliphages from the diluted raw sewage samples. For
practical reasons, 60 mL of sample water was processed using EPA Method 1602. The sewage
samples were diluted with sterile 0.01M phosphate-buffered saline (PBS), up to a hundred-fold,
for readable plate counts. Each experiment consisted of a standard SAL assay on non-induced
coliphages, an assay of MMC-induced coliphages, and an assay of ultraviolet-induced
coliphages. Duplicates were run for each assay. Overall, the SAL assay required three days to
complete, not including experimental preparations. Preparation of stock solutions, coliphage
stock, and host bacteria stock cultures were prepared in advance when possible. Preparation of
18
on the second day, and assay results were read on the third and final day. These processes are
detailed in the subsequent sections.
Preparation of stock solutions. The antibiotic stock solutions, stock magnesium chloride, and MMC stock solution were prepared in advance whenever possible. Stock nalidixic acid for
the growth of E. coli CN-13 was prepared by dissolving 1 g of nalidixic acid sodium salt in 100 mL of autoclaved deionized water and filtering the solution through a sterile, 0.22-µm-pore-size
membrane filter assembly. Stock ampicillin/streptomycin for the growth of E. coli Famp was prepared by dissolving 0.15 g of ampicillin sodium salt and 0.15 g streptomycin sulfate in 100
mL of autoclaved deionized water and filtering the solution through a sterile, 0.22-µm-pore-size
membrane filter assembly. For long-term storage, 10 mL aliquots of the antibiotic stocks were
labeled, dated, and stored at -20°C. Prior to use, the antibiotic stocks were thawed at room
temperature and vortexed well.
Stock magnesium chloride (80×, 4M) was prepared by adding 300 mL deionized water to
814 g of magnesium chloride hexahydrate (MgCl2·6H2O). After all of the MgCl2·6H2O was
dissolved, the stock solution was brought to a final volume of 1 L with additional deionized
water, mixed thoroughly, and autoclaved for 15 minutes at 121°C and 15 psi. The stock
magnesium chloride was stored at 4°C. Stock MMC (C15H18N4O5) was prepared by dissolving 2
mg of solid MMC in 5 mL of autoclaved deionized water (0.4 mg mL-1). The stock MMC was
stored in the dark at 4°C. Prior to use, the stock magnesium chloride and MMC were mixed or
vortexed well.
Preparation of coliphage stock and host bacteria stock cultures. Preparation of coliphage stock requires three consecutive days. The frozen coliphage stocks that were prepared were MS2
19
must be prepared on the first day: E. coli Famp (ATCC® 700891TM) for MS2 coliphage and E. coli CN-13 (ATCC® 700609TM) for phi-X 174 coliphage. On the second day, log-phase host bacteria culture must be prepared using the overnight culture. Detailed steps on making the
overnight and log-phase host culture can be found in the subsequent sections. In an autoclaved
shaker flask, 1 mL of the log-phase host bacteria was added to 50 mL half-strength tryptic soy
broth along with 500 µL antibiotic (ampicillin/streptomycin for MS2, nalidixic acid for phi-X
174), 625 µL 4M MgCl2, and 10 µL frozen virus stock. The flask was then incubated overnight
(18 to 20 hours) at 36°C ± 1.0°C with the shaker set to 100 rpm. After incubation, the overnight
coliphage stock was poured into a sterile 50 mL conical centrifuge tube along with 5 mL of
chloroform (CHCl3), vortexed for two minutes, and then centrifuged at 4°C and 3000 rpm for 30
minutes. After centrifugation, the supernatant was extracted from the conical centrifuge tube and
pipetted into a 100 mm sterile petri plate, all the while being careful not to disturb the chloroform
layer or the pellet at the bottom of the tube. The plate with the supernatant was then left open
inside a laminar flow hood for about thirty minutes to allow any remaining chloroform to
off-gas. The coliphage stock was then pipetted into a new sterile 50 mL conical centrifuge tube
along with a 40% glycerol solution in a 1:1 ratio. The coliphage stock was divided into 1 mL
aliquots, labelled, dated, and stored in cryogenic storage vials at -80°C. Prior to use, the
coliphage stock was thawed at room temperature and vortexed well. The double agar layer
plaque assay procedure was used to enumerate stock suspensions of MS2 and phi-X 174 for use
in spiking the positive controls for ongoing precision and recovery.
To create frozen host bacteria stock cultures of E. coli Famp and E. coli CN-13, a reference host bacterial culture of each strain was streaked onto a 1.5% tryptic soy agar plate with the
20
and incubated overnight at 36°C ± 1.0°C. After incubation, an individual colony was picked,
inoculated into tryptic soy broth with the appropriate antibiotic, and allowed to grow to log
phase. The log-phase host bacteria broth was harvested by mixing sterile glycerol and broth in a
ratio of 1:4 in 2 mL cryogenic freezer vials which were labeled, dated, and stored at -80°C until
use.
Day one: Preparation of overnight E. coli host cultures. An overnight E. coli host culture was used to create the log-phase culture because an inoculum from the overnight culture reaches
log phase faster than an inoculum from frozen stock (EPA 2001). In a sterile shaker flask, a
loopful of E. coli frozen stock culture was added to 25 mL of tryptic soy broth and 250 µL of appropriate antibiotic (ampicillin/streptomycin for E. coli Famp, nalidixic acid for E. coli CN-13). The flask was then capped, labeled, and secured in a shaker and incubated at 36°C ± 1.0°C and
100 rpm overnight (18 to 20 hours). After incubation, the flasks containing overnight E. coli Famp and E. coli CN-13 cultures were chilled on ice until ready for use.
Day two: Sample collection and processing. After returning from sample collection, the raw sewage samples were kept at 4°C until use. The overnight E. coli Famp and E. coli CN-13 cultures were used to inoculate log-phase E. coli Famp and E. coli CN-13 cultures. In a sterile shaker flask, 0.7 mL of overnight E. coli Famp was added to 50 mL tryptic soy broth and 500 µL ampicillin/streptomycin stock solution. In a separate sterile shaker, 0.9 mL of overnight E. coli
CN-13 was added to 50 mL tryptic soy broth and 500 µL nalidixic acid stock solution. More E. coli CN-13 was inoculated into its log-phase flask relative to the E. coli Famp log-phase flask because it was observed that E. coli CN-13 took slightly longer time compared to E. coli Famp to reach a similar absorbance reading as an estimate of concentration. The flasks were capped and
21
each flask was dispensed into a cuvette for absorbance reading at 520 nm. An absorbance
reading between 0.1 and 0.5 optical density (OD) is an indication of log-phase growth (EPA
2001). After an hour, the absorbance reading at 520 nm for both flasks was between 0.2 and 0.3
OD. While the log-phase host bacteria cultures were growing, 850 mL of double-strength agar
was prepared in two bottles by dissolving and heating 25.5 g tryptic soy broth and 7.65 g agar in
deionized water. The double-strength agar was then autoclaved for 15 minutes at 121° and 15
psi. After autoclaving, the bottles containing double-strength agar were placed on stir plates to
cool.
Bottles containing 0.01 M PBS as diluent were prepared for the raw sewage dilutions.
Because duplicates of each assay were done, a total of twelve 250 mL bottles were used for
sample analysis. The somatic bottles contained 59.4 mL of diluent for a one-hundred-fold
dilution while the male-specific bottles contained 58.8 mL diluent for a one-fiftieth-fold dilution.
After the log-phase cultures were confirmed ready for use by the absorbance readings, the
diluted sewage sample (600 µL for somatic bottles, 1200 µL for male-specific bottles) was added
to the bottle of diluent along with 750 µL magnesium chloride and 1200 µL appropriate
antibiotic (final concentration of 100 µg mL-1 of nalidixic acid for somatic coliphages; and 15 µg
mL-1 of streptomycin and 15 µg mL-1 of ampicillin for male-specific coliphages). To the MMC
bottles, 75 µL of stock MMC was added so that the concentration in the sample, before the
addition of double-strength tryptic soy agar, was 0.05 µg mL-1, a concentration known to induce
prophages (Raya and Hébert 2009). Before being combined with double-strength tryptic soy
agar, the raw sewage of UV sample bottles was first subjected to a UV dose equivalent to 45 J m
-2. This was achieved by pipetting raw sewage into a 90 mm sterile petri dish 10 in beneath a
22
been previously used by Muniesa and Jofre (2007) to induce coliphages in a similar study and
the UV dose has been previously evaluated by O’Brien et al. (1984) to induce lysogenic
bacteriophage 933W at similar rates to a final concentration of 0.5 ug mL-1 MMC. To see how
the UV dose was calculated, refer to Appendix A.
Once all sample bottles contained diluted sewage, antibiotics, and magnesium chloride,
they were placed into a water bath of 45° to 48°C for 5 minutes. The double-strength agar bottles
were also kept in the same water bath to keep the agar molten. Next, 6 mL of the appropriate
log-phase E. coli host (E. coli Famp for male-specific and E. coli CN-13 for somatic) and 60 mL double-strength agar was added to the sample bottle and gently mixed before being poured into
three labelled, sterile 150×15 mm petri dishes, about 40 mL per dish. During this procedure, the
sample and host bacteria remained in contact for at least three but no more than ten minutes
before plating to prevent replication of phages (EPA 2001). Laboratory prototype bacteriophage
strains MS2 and phi-X 174 were spiked into sterile 0.01M PBS as positive controls for
male-specific and somatic coliphages, respectively. Sterile 0.01M PBS was used as the negative
control. The controls were processed and plated in the same way as the samples, with
magnesium chloride, double-strength agar, and the appropriate log-phase host bacterial culture
and antibiotic. After allowing the agar to harden, the plates were covered, inverted, and
incubated for 16 to 24 hours at 36°C ± 1.0°C.
Day three: Interpretation of single agar layer results. On the third day of analysis, circular zones of clearing, typically 1 to 10 mm in diameter, in the lawn of host bacteria are
considered to be plaques (EPA 2001). All plaques were assumed to be caused by lytic coliphages
and not by other agents or sources of lysis such as from bacteriocins. All plaques per plate series
23
Because the samples analyzed were in 60 mL rather than 100 mL volumes, PFU per 100 mL
were calculated from the recorded results.
Statistical methods
The distributions of the raw data and the log10-transformed data were investigated to
determine whether a parametric or non-parametric method should be used. Once it was
determined that a non-parametric method should be chosen, the Kruskal-Wallis test was used for
testing whether the samples originate from the same distribution. Post hoc analysis was done using Dunn’s multiple comparisons test, a non-parametric pairwise multiple comparisons
procedure, and Wilcoxon signed rank test, a non-parametric equivalent to the one-sample paired
t-test, to determine whether the phage numbers from the assays of induced coliphages were different from those of the assays of non-induced coliphages at p < 0.05. Four pairs of Wilcoxon signed rank tests were done, comparing the assays of non-induced and MMC-induced somatic
coliphages, of non-induced and UV-induced somatic coliphages, of non-induced and
MMC-induced male-specific coliphages, and of non-MMC-induced and UV-MMC-induced male-specific coliphages.
Additionally, the probability of superiority was calculated for each inducing agent.
The average difference between the induced and non-induced counts and the average of
the non-induced counts were used to calculate the average percent increase between non-induced
and induced counts. Linear regression on counts from induced assays versus counts from
non-induced assays was also done to investigate this percent increase. The results from the two
methods was compared. The probability of superiority, PSdep is the probability that in a randomly sampled pair of scores (one matched pair of scores) the score from Condition B, the condition
which most frequently has the higher score, will be greater than the score from Condition A, the
24
Condition B refers to induction and Condition A refers to no induction. These calculations were
done using Statistical Analysis System (SAS® 9.4) software (Cary, NC) and GraphPad InStat 3
25
CHAPTER 5: RESULTS
Descriptive statistics: Assays of somatic coliphages
A total of eleven experiments were completed, resulting in twenty-two assays per
induction group. However, the assays of UV-induced coliphages did not begin until the second
experiment, resulting in twenty, rather than twenty-two, UV-induced coliphage counts for the
assays of somatic and male-specific coliphages (n = 20). Because it was more than five times greater than the average and not observed in duplicate, it was considered an extreme outlier, one
induced somatic coliphage count was dropped, resulting in a total of twenty-one
MMC-induced somatic coliphage counts (n = 21). If the outlier had been included in the analysis, it likely would have resulted in misleadingly inflated results regarding the distribution of
MMC-induced somatic coliphages. The skewness, kurtosis, and Shapiro-Wilk test p-values of each
distribution was examined for evidence of non-Normality to support the use of non-parametric
statistical tests. The descriptive statistics of each induction group for the assays of somatic
coliphages are presented in Table 3.
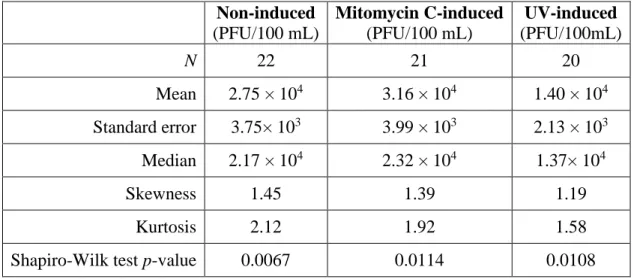
Of the three groups, the MMC-induced counts have the greatest mean (3.16 × 10⁴
PFU/100 mL ± 3.75× 10³ PFU/100 mL) coliphage counts while the UV-induced counts have the
lowest mean (1.40 × 10⁴ PFU/100 mL ± 2.13× 10³ PFU/100 mL) coliphage counts. The higher
skewness and kurtosis values of all groups and the low p-values of the Shapiro-Wilk tests (p < 0.05) support the necessity of a non-parametric statistical test when comparing the assays of
26
Table 3. Statistical measures of coliphage counts from assays of somatic coliphages
Non-induced
(PFU/100 mL)
Mitomycin C-induced
(PFU/100 mL)
UV-induced
(PFU/100mL)
N 22 21 20
Mean 2.75 × 10⁴ 3.16 × 10⁴ 1.40 × 10⁴
Standard error 3.75× 10³ 3.99 × 10³ 2.13 × 10³
Median 2.17 × 10⁴ 2.32 × 10⁴ 1.37× 10⁴
Skewness 1.45 1.39 1.19
Kurtosis 2.12 1.92 1.58
Shapiro-Wilk test p-value 0.0067 0.0114 0.0108
The positive skewness of the distribution of coliphage counts of non-induced somatic
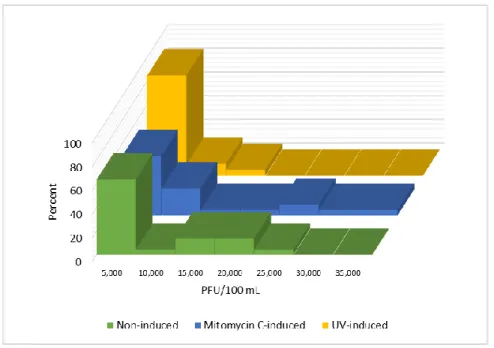
coliphages (Figure 2) visually supports the premise that the data have a non-Normal distribution.
The distribution of the non-induced counts seems to peak between 1 × 10⁴ and 2 × 10⁴ PFU/100
mL. Like the distribution of the somatic non-induced coliphage counts, the distribution of the
MMC-induced counts appears to be non-Normal with observable positive skewness. The upper
coliphage counts of the UV-induced somatic coliphages is a little more than half that of the upper
coliphage counts of the non-induced and MMC-induced counts. The distribution of the
UV-induced somatic coliphage counts also appears non-Normal. The positive kurtosis values for all
induction groups mean that all three distributions have heavier tails and sharper peaks compared
27
Figure 2. Sample distributions of coliphage counts from assays of somatic coliphages
Overall, the non-Normality of the distributions supports the use of non-parametric
statistical tests. However, it is often the case that non-Normal microbial concentrations require
log10-transformation to result in Normal distributions. Although log10-transforming the data
improved the skewness, kurtosis, and Shapiro-Wilk test p-values of some groups, the success was inconsistent between group types. For example, the log10-transformed UV-induced somatic
coliphages still had a high kurtosis value (Kurtosis = -1.32) and significant statistical evidence
that the distribution was non-Normal (Shapiro-Wilk test p-value = 0.099). The inconsistency was even more pronounced for the log10-transformed male-specific data, with the transformed
MMC-induced and UV-MMC-induced data still violating Normality (detailed in the subsequent section on
descriptive statistics of assays of male-specific coliphages).
Descriptive statistics: Assays of male-specific coliphages
Again, a total of eleven experiments were completed, resulting in twenty-two assays of
28
descriptive statistics of each induction group for the assays of male-specific coliphages are
presented in Table 4.
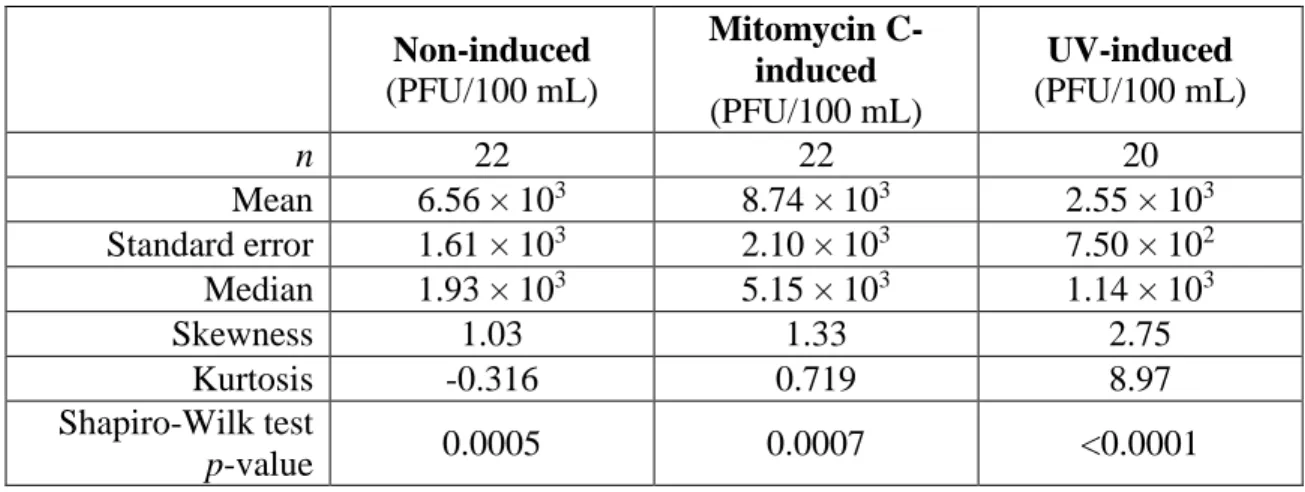
Table 4. Statistical measures of coliphage counts from assays of male-specific coliphages
Non-induced
(PFU/100 mL)
Mitomycin C-induced
(PFU/100 mL)
UV-induced
(PFU/100 mL)
n 22 22 20
Mean 6.56 × 10³ 8.74 × 10³ 2.55 × 10³
Standard error 1.61 × 10³ 2.10 × 10³ 7.50 × 10²
Median 1.93 × 10³ 5.15 × 10³ 1.14 × 10³
Skewness 1.03 1.33 2.75
Kurtosis -0.316 0.719 8.97
Shapiro-Wilk test
p-value 0.0005 0.0007 <0.0001
Similar to the somatic counts, the MMC-induced male-specific counts have the greatest
mean (8.74E × 103 PFU/100 mL ± 2.10 × 10³ PFU/100 mL) coliphage counts while the
UV-induced assays have the lowest mean (2.55 × 10³ PFU/100 mL ± 7.50 × 10² PFU/100 mL)
coliphage counts. While the somatic induction groups had similar skewness and kurtosis values,
the values of the assays of male-specific coliphages are more variable, with the UV-induced
distribution being the most extreme. The high positive skewness and kurtosis values of the
UV-induced male-specific coliphage counts points to a non-Normal distribution. Further support for
29
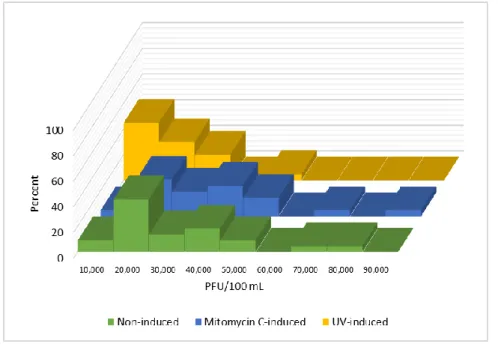
Figure 3. Sample distributions of coliphage counts from assays of male-specific coliphages
In Figure 3, around sixty percent of the male-specific non-induced coliphage counts are
between 0 and 5 × 10³ PFU/100 mL, constituting the major peak in the distribution. The
relatively high skewness and kurtosis values of the male-specific non-induced coliphage counts
along with the significant Shapiro-Wilk test p-value (p < 0.05) suggests a non-Normal distribution. Around fifty percent of the MMC-induced male-specific coliphage counts are
between 0 and 5 × 10³ PFU/100 mL, noticeably less than the non-induced coliphage counts, but
with a greater percentage (around twenty percent) of counts residing between 5 × 10³ and 1 × 10⁴
PFU/100 mL. While the higher coliphage counts for the non-induced assays were around 2.5×
104 PFU/100 mL, the MMC-assay counts ranged up to 3.5 × 10⁴ PFU/100 mL. Finally, around
eighty-five percent of the UV-induced male-specific coliphage counts are between 0 and 5 × 10³
PFU/100 mL, significantly more than non-induced and MMC-induced counts. The higher
coliphage counts from the UV-induced assays only ranged up to 1.5 × 10⁴ PFU/100 mL. Thus it
can be noted that for somatic and male-specific coliphage counts, the upper range detected in
30
MMC-induced assays. Like the somatic coliphage counts, the distribution of the male-specific
coliphages points to using a non-parametric statistical method.
To reiterate, it is often the case that non-Normal microbial concentrations require log10
-transformation to result in Normal distributions. Although log10-transforming the data improved
the skewness, kurtosis, and Shapiro-Wilk test p-values of the non-induced and MMC-induced groups for somatic coliphages, it only improved the Normality indicators of the non-induced
group for male-specific coliphages, and even then the Kurtosis value (Kurtosis = -1.30) and
Shapiro-Wilk test p-value (Kurtosis = -1.3; Shapiro-Wilk, p = 0.1182).provided moderate evidence against Normality for the non-induced group. After log10 transformation, the skewness
and kurtosis values for the MMC-induced group was -2.08 and 6.30 respectively, greater than
those of the untransformed data, with a Shapiro-Wilk test p-value of 0.0008 providing strong evidence against Normality (p < 0.05). After log10 transformation, the skewness and kurtosis values for the UV-induced group was -2.20 and 7.16 respectively, also greater than those of the
untransformed data, with a Shapiro-Wilk test p-value of 0.0005 providing strong evidence against Normality (p < 0.05). Because log10-transforming the data did not consistently result in Normally-distributed data, non-parametric statistical methods were used on the untransformed
data, beginning with the Kruskal-Wallis test.
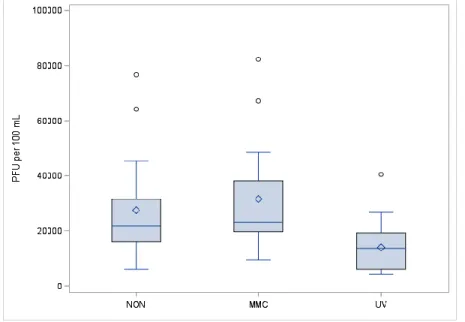
For visual side-by-side comparison, Figures 4 and 5 depict box plots of all assays of
somatic and male-specific coliphages, respectively. In all cases, the median coliphage counts are
greater than the mean coliphage counts. The non-induced and MMC-induced somatic coliphage
box plots have similar means, though the distribution of the MMC-induced coliphages is greater,
resulting in a more elongated box. For both the assays of somatic and male-specific coliphages,
31
PFU/100 mL ranges. The male-specific non-induced and MMC-induced box plots have long
upper whiskers, indicating the positive skew of the distributions.
Figure 4. Comparison of somatic coliphage counts from diluted sewage with and without exposure to inducing agents (NON – non-induced, MMC – mitomycin C-induced, UV –
UV-induced)
Figure 5. Comparison of male-specific coliphage counts from diluted sewage with and without exposure to inducing agents (NON – non-induced, MMC – mitomycin C-induced, UV –
32
Comparison of assays of non-induced and induced coliphages
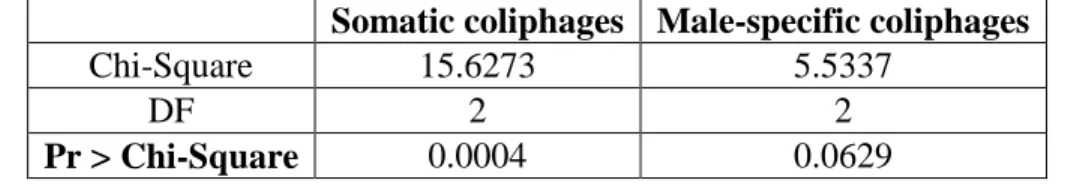
The results of the Kruskal-Wallis test for somatic and male-specific coliphage asays are
available in Table 5. A significant Kruskal-Wallis test indicates that at least one of the samples
stochastically dominates one other sample, but does not identify where or for how many pairs of
groups this dominance occurs. According to Table 5, there is significant evidence of dominance
among somatic coliphages (p < 0.05) and moderate evidence of dominance among male-specific coliphages (p = 0.06).
Table 5. Kruskal-Wallis test results for somatic and male-specific coliphage assays
Somatic coliphages Male-specific coliphages
Chi-Square 15.6273 5.5337
DF 2 2
Pr > Chi-Square 0.0004 0.0629
The previous section revealed that UV-induced counts were always less than non-induced
counts for somatic and male-specific coliphages, suggesting an issue with UV prophage
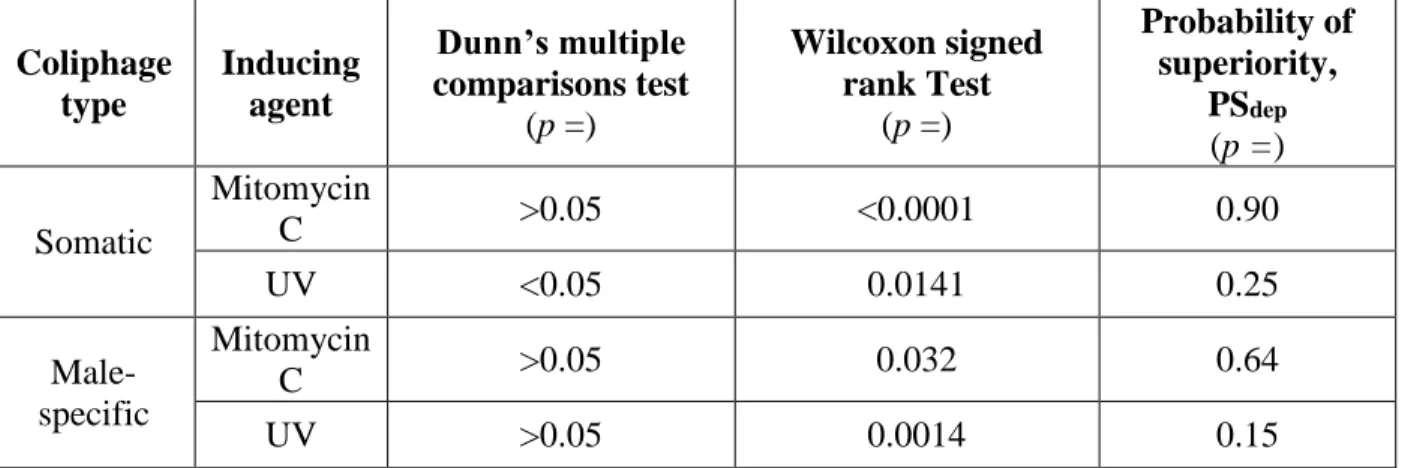
induction. Because of this, post hoc analysis was done using Dunn’s multiple comparisons test.
Wilcoxon signed rank tests were also done between non-induced and MMC-induced assays only
for somatic and male-specific coliphages to reveal information on prophage induction. The
Wilcoxon signed rank test gives a p-value only, providing evidence that population medians differ, and provides no direct estimate of the magnitude of any effect. The Dunn’s multiple
comparisons test p-values are the p-values for the comparison of the induced counts versus the non-induced counts. The p-values of the two tests are given in Table 6 along with the
probabilities of superiority. The probability of superiority, PSdep is the probability that in a randomly sampled pair of scores (one matched pair scores) the score from Condition B, the
33
Condition A, the condition which most frequently has the lower score (Grissom and Kim 2012).
In this case, Condition B is the MMC-induced assay and Condition A is the non-induced assay.
Because of the difficulty in determining power and effect size for non-parametric, paired data, it
is recommended to report PSdep instead (Grissom and Kim 2012).
Table 6. Comparison of assays run with and without exposure to inducing agents for counts of somatic and male-specific coliphages estimated using EPA Method 1602
Coliphage type Inducing agent Dunn’s multiple comparisons test
(p =)
Wilcoxon signed rank Test
(p =)
Probability of superiority,
PSdep (p =)
Somatic
Mitomycin
C >0.05 <0.0001 0.90
UV <0.05 0.0141 0.25
Male-specific
Mitomycin
C >0.05 0.032 0.64
UV >0.05 0.0014 0.15
Using Dunn’s multiple comparisons test, only UV-induced somatic coliphage counts
were significantly different from its corresponding non-induced counts (p < 0.05).For all other induced versus non-induced comparisons, the p-values were greater than the alpha level of 0.05, meaning that Dunn’s multiple comparisons test provides no strong evidence that the coliphage
counts differ with induction. However, the software used to run the Dunn’s multiple comparisons
test (GraphPad Instat 3) does not report the exact p-value if the value is greater than the alpha level of 0.05. If the p-values are not too much greater than 0.05, then there may be moderate evidence that the induced counts do differ from the non-induced ones. Thus the Wilcoxon signed
rank test was done using SAS 9.4 to continue the exploration for statistical evidence that the
induced counts differ from the non-induced ones. Using Wilcoxon signed rank test, all induced
34
0.05). The PSdep for the MMC-induced somatic and male-specific coliphage counts is 0.90 and 0.64, respectively. This means that MMC-induced somatic coliphage counts were higher than the
non-induced counts 90% of the time while the MMC-induced male-specific coliphage counts
were higher than the non-induced counts 64% of the time. The PSdep for the UV-induced somatic and male-specific coliphage counts is 0.25 and 0.15, respectively.
Samples exposed to mitomycin C had consistently higher counts of somatic coliphages
than samples not exposed to an inducing agent (Figure 6). The MMC-induced samples had
higher counts in 19 of 21 trials (90%) and the non-induced samples had higher counts in two
trials (9.5%). The average difference between MMC-induced counts and non-induced counts was
3.6×10³ PFU/100 mL. To get the average percent increase of MMC-induced somatic coliphage
counts from induced counts, the average difference was divided by the mean of the
non-induced somatic coliphages (2.75 × 10⁴ PFU/100 mL). Using this method, the average percent
increase between MMC-induced and non-induced somatic coliphage counts is 13%.
Out of 22 tests for male-specific coliphages, 16 (73%) had higher counts in the
MMC-induced samples and six (27%) had higher counts in the non-MMC-induced samples (Figure 7). The
average difference between the MMC-induced counts and the non-induced counts was 2.2×10³
PFU/100 mL. The mean non-induced male-specific coliphage count was 6.6 × 10³ PFU/100 mL,
35
Figure 6. Differences between induced and non-induced counts of somatic coliphages using mitomycin C as an inducing agent
Figure 7. Differences between induced and non-induced counts of male-specific coliphages using mitomycin C as an inducing agent
A linear regression was used as a second method to calculate percent increase from
36
represent the non-induced coliphage counts for somatic and male-specific coliphages
respectively while the y-axes represent the MMC-induced coliphage counts for somatic and
male-specific coliphages respectively. The linear regression equations and coefficient of
determination (R2) are presented in each figure in the left-hand corner. The black line is the line
of equivalence (y = x).
The high R2 values of both regression models indicate a strong goodness of fit.
Additionally the residual plots of both linear regression models did not indicate any noticeable
pattern, suggesting that errors are homoscedastic and randomly distributed and that our linear
equations are appropriate models for the given data. According to the regression coefficient
(slope) from Figure 8, for a 100 mL sample of diluted sewage in this study, a 1 PFU increase in
the non-induced somatic coliphage counts is associated with an expected 1.006 increase in the
MMC-induced somatic coliphage counts. Thus, inducing the sample with MMC results in a 0.6%
increase in somatic coliphages. This was calculated by subtracting 1 from 1.006 and multiplying
the difference by 100. For somatic coliphages, the 90% confidence interval (CI) of the slope is
[0.9358, 1.075]. Because the 90% CI includes the null value of 1, this means that there is not
enough evidence given by the linear regression model to statistically support the 0.6% increase
in somatic coliphage counts after induction by MMC. According to the slope from Figure 9, for a
100 mL sample of diluted sewage in this study, a 1 PFU increase in the non-induced
male-specific coliphage counts is associated with an expected 1.196 increase in the MMC-induced
male-specific coliphage counts. Thus, inducing the sample with MMC results in a 20% increase
in male-specific coliphages. For male-specific coliphages, the 90% CI of the slope is [1.001,
1.391]. Because the 90% CI does not include the null value of 1, this suggests that there is
37
Figure 8. Linear regression of non-induced coliphages as the independent variable and mitomycin C-induced coliphages as the dependent variable, for somatic coliphages (Black line is
line of equivalence where y = x)
Figure 9. Linear regression of non-induced coliphages as the independent variable and mitomycin C-induced coliphages as the dependent variable, for male-specific coliphages (Black
line is line of equivalence where y = x)
The average percent increase between non-induced and MMC-induced coliphage counts
calculated from Figures 6 and 7 result in higher values than the percent increase values
calculated from the linear regression model. The results of both methods are summarized in
38
linear regression model, the linear regression model includes 90% CIs which gives insight on the
precision of the parameter estimate (in this case the parameter estimate is the slope). For
example, the 90% CI of the slope of the regression of male-specific coliphages suggests that the
unobservable true percent increase is potentially between 0.1% and 39%.
Table 7. Comparison of percent increase from non-induced counts to MMC-induced counts calculated by two methods
Type of coliphage
Method
Average percent increase
Percent increase calculated from the linear regression model
Somatic coliphages 13% 0.6%
Male-specific
coliphages 33% 20%
Ongoing precision and recovery results
Ongoing precision and recovery from the positive control assays showed a 118 percent
recovery for male-specific and 114 percent recovery for somatic, which is within the acceptable
39
CHAPTER 6: DISCUSSION
There is a small but significant difference between non-induced and MMC-induced
coliphage counts for assays of somatic and male-specific coliphages (Wilcoxon signed rank, p = 0.05). Overall, the high positive skewness values in nearly all assay groups suggests that the
incidences of higher, induced coliphage counts inflates the coliphage means, meaning that the
medians are likely the better measures of central tendency for this dataset. This supports the
decision to use a non-parametric, paired statistical test for the analysis of the results.The natural
variability of coliphages in diluted sewage resulted in large standard errors and standard
deviation. This, coupled with non-Normality, lowers the power of the statistical test and reduces
the ability to estimate the magnitude of an effect. The UV-induced assays frequently resulted in
lower coliphage counts than the non-induced assays, meaning that either the experimental setup
for UV failed to detect the true coliphage population, free and induced, or the UV dose was too
great and resulted in sample mortality. It is likely that the UV induction step, adapted from
Muniesa and Jofre, requires improvement rather than the UV dose was too great because the UV
dose used was based on literature values and was relatively small in comparison to other studies
(2007). Further work should use a collimated beam UV dosing system, unavailable during this
study, to improve UV dose accuracy and precision by limiting heterogeneity of the delivered UV
dose (Bolton and Linden 2003). If a collimated beam UV dosing system is not available, an
alternative step would be to focus on improving the UV induction step with a bench lamp to