website: www.jdsu.com/test
Key Benefits
JDSU Triple Play Analyzer Software
The JDSU Triple Play Analyzer (TPA) lets network professionals troubleshoot, monitor, analyze, maintain, and optimize real-time voice, data, and video services over next-generation converged Internet protocol (IP) networks. TPA now integrates with the revolutionary new JDSU PacketPortal solution to redefine network troubleshooting. PacketPortal removes obstacles to traditional probing and analysis systems by deploying SFPprobes throughout the network, providing on-demand reach and visibility so providers can ensure the highest possible QoE/QoS. The combined solution lets providers save costs while enhancing customer service. When analyzing a converged triple-play network, it is critical to deploy a single solution that can analyze the performance of IP video (IPTV), video on demand (VoD), voice over IP (VoIP), and broadband data applications simultaneously to get an accurate representation of the end user’s overall experience. QoE is not solely a function of network bandwidth, voice and video transport stream metrics, and/ or traffic characteristics, but is rather a function of how all features and services interact with each other from the end user’s perspective.
A PacketPortal-enabled SFProbe can replace virtually any Gigabit SFP to feed voice, video, and signaling packets to the TPA application for analysis. Supporting over 500 network protocols, the TPA application let providers isolate the root of problems quickly and easily. Now, providers can have the visibility they need to solve the most complex, costly, and difficult-to-find network problems—all from a central location.
• Integrates with innovative JDSU PacketPortal™ — captures data from packet-analysis probes anywhere in the network • Saves time and money by quickly resolving difficult video,
voice, and data network problems
• Increases efficiency with one platform, one user interface, and all three services
• Increases cost-effectiveness: more intuitive and deeper combined measurements reduce CapEx and OpEx costs • Combines full protocol analysis with end-user QoE for true
visibility into network anomalies
• Provides powerful signaling and media QoE analysis that can drill down to root causes
• A complete triple-play solution in one platform reduces training time
Applications
• In-depth IP video and Microsoft® Mediaroom™ analysis
• IP-converged voice, video, and data services analysis
• Manage performance and SLAs • Network security and intrusion • Lawful intercept
• Enable service and media quality assurance
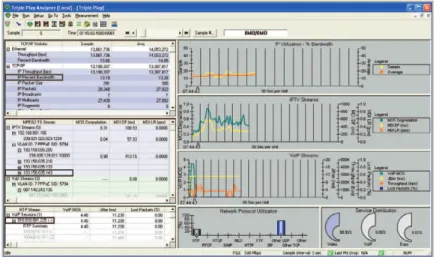
Figure 1. The Triple Play Analyzer dashboard shows traffic distributions and top-level performance for voice, video, and data services
Overview
The JDSU J6900A Triple Play Analyzer (TPA) is the most complete analysis and troubleshooting tool for network equipment manufacturers (NEMs) and com-munication service providers who develop, install, monitor, and troubleshoot voice, video, and data applications. Figure 2 illustrates where the solution connects within the network.
Built on award-winning JDSU protocol analysis and network troubleshooting platforms, the TPA allows in-depth triple-play analysis and troubleshooting for all aspects of a converged service in real time. Coupled with powerful PacketPortal-enabled SFProbes, the TPA solution unleashes the power of extensive data analysis capabilities with real-time signaling and QoE measurements. The combined voice, video, and data analysis solution is ideal for:
• R&D engineers
• system test and integration labs
• tier 2 and 3 field technicians and engineers • equipment designers
• deployment trials • operational monitoring • service verification.
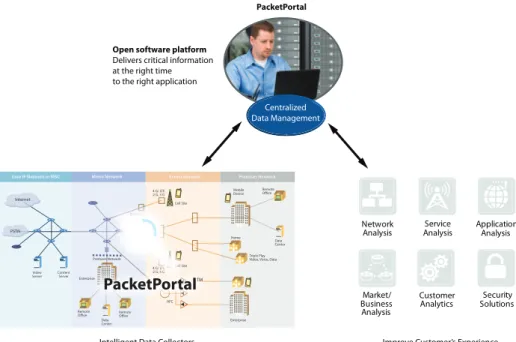
Figure 2. Connect virtually anywhere in the network to quickly isolate problems
Internet
Core IP Network or MSC Metro Network Access Network Premises Network
Video Server ContentServer
4 G/ LTE 2 G, 3 G 4 G/ LTE 2 G, 3 G Cell Site Backhaul Cell Site HFC PSTN Enterprise Enterprise Premises Network Remote Office Remote Office Triple Play Video, Voice, Data Home Mobile Device Remote Office Data Center Data Center Centralized Data Management
Intelligent Data Collectors
Deployed Throughout the Network Improve Customer’s ExperienceLower Operational Expenses Accelerate Revenue Open software platform
Delivers critical information at the right time to the right application
PacketPortal Customer Analytics Market/ Business Analysis Security Solutions Service
Analysis Application Analysis Network
• Extensive test capabilities for powerful real-time monitoring, analysis, and troubleshooting for next-generation IPv4 and IPv6 voice, video, and data networks
• Complete triple-play solution in a single platform eliminates having to purchase additional test tools • Extensive analysis features with drill
down to connections and decodes for root-cause analysis
• Triple-play dashboard service overview • Passive QoE metrics and mean opinion
scores (MOS) for VoIP and MPEG video
• Record and/or listen to live voice traffic to find non-IP-based impairments • Real-time playback of live IPTV
multicast traffic and/or video/TV on demand streams with audio
• Comprehensive MPEG transport stream analysis:
– ETSI TR 101 290 first- and second- priority event analysis and measure-ments
– bandwidth utilization and bit rates – program clock reference (PCR) jitter
and accuracy
– individual packet identifier (PID) monitoring and analysis
– program specific information (PSI) table reconstruction and analysis – RFC 4445 media delivery index
(MDI) metrics
– real-time transport (RTP) stream decodes
– multiple program transport stream (MPTS) support
• Complete RTP stream analysis – jitter, packet loss, sequence, and
delay measurements
– RFC 3357 loss pattern sample metrics
– real-time control protocol (RTCP) correlation and analysis
– ITU G.107 E-Model/R-Factor scores
• Video MOS degradation utilizing an adaptive neural network model based on MPEG TS, packetized elementary stream (PES), and transport metrics • MPEG PES I, P, B frame performance
analysis
• MPEG group of pictures (GOP) analysis
• Microsoft Mediaroom analysis – instant channel change (ICC)
sig-naling and media burst transport analysis
– reliable UDP (RUDP) statistics and hole fulfillment analysis
– D-server command and control (DC&C) message and error statistics • Extensive and configurable alarms,
events, and thresholds with user- defined actions including: – save the voice, video, and data
streams
– send SNMP traps – launch a specific program
• Passive IPTV channel change and VoD command analysis
– passive and active IGMP perfor-mance (IPv4)
– passive multicast listener discovery (MLD) analysis (IPv6)
• Complete support for various protocol stack and video encapsulation methods – MPEG-2 TS over UDP and/or RTP/
UDP and/or RTSP/TCP and/or RTP/RTSP/TCP
– Internet Stream Media Alliance (ISMA) over RTP/UDP and/or RTP/ RTSP/TCP
• Automated support for major Layer 2 and Layer 3 tunneling protocols – VLAN, MPLS, PPPoE
– GTP, GRE, and other Layer 3 offsets • Full protocol decodes across all seven
layers, including all major IPTV, MSTV, VoD, and VoIP protocols
• Extensive capture and display filters
Network Analysis and
Troubleshooting Solutions
The TPA is one of the key software applications among the JDSU network analysis and troubleshooting solutions that are built on the Distributed Network Analyzer (DNA) hardware platform and/or the 10 Gigabit/Gigabit Ethernet Interface card and now, JDSU PacketPortal SFProbes. The scalable DNA architecture provides the foundation for advanced protocol analysis, monitoring, and troubleshooting in fixed wireline and mobile networks. The DNA hardware platform brings greater power for collect-ing and analyzcollect-ing real-time data over multiple technologies such as Ethernet, ATM, POS, frame relay, IPv4, IPv6, MPLS, VoIP, IPTV, GPRS, UMTS, HSPA, CDMA 2000, and LTE to name a few.
The TPA runs on a Windows® PC as a client for any of the DNA hardware platforms and this architecture makes it an ideal solution for dispatched or distributed analysis. The TPA can also be used as a stand alone application using the NDIS adapter on a Windows PC.
Coupling the hardware with the TPA and Network Analyzer software applications provides a powerful wireline solution for complete triple-play analysis, troubleshoot-ing, and monitoring. Similarly, the system can be used in conjunction with the JDSU Signaling Analyzer software to create an advanced mobile network test solution for both signaling and media quality analysis.
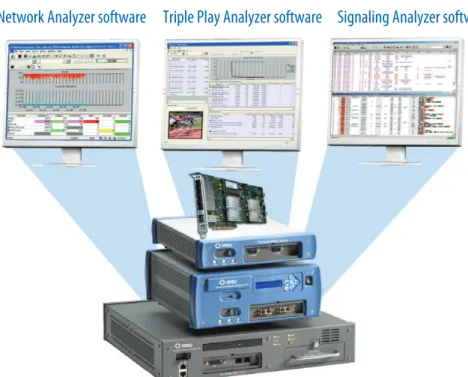
Distributed Network Analyzers and the 10 Gigabit/Gigabit Ethernet Interface card
Network Analyzer software Triple Play Analyzer software Signaling Analyzer software
Figure 3. Combine the DNA hardware platform with Signaling Analyzer software for mobile network test-ing, with Network Analyzer software for fixed network testtest-ing, or with Triple Play Analyzer for voice, video, and data analysis over next-generation networks
Base Software
J6900A-001 Triple Play Analyzer Base Software
TPA base software provides a real-time dashboard that allows users to quickly and easily see the performance and traffic distributions of all triple-play services. It also enables TPA configuration, network vital statistics, protocol decodes, and filter fea-tures. Optional licenses are required for the detailed drill down into each service type to analyze the key performance indicators (KPIs) that impact QoS for end users.
TPA Solution Components
Part number Description
Base software J6900A-001 Triple Play Analyzer base software
Add-on licenses
J6900A-002 Triple Play Analyzer video QoE measurements J6900A-003 Triple Play Analyzer voice QoE measurements J6900A-004 Triple Play Analyzer Mediaroom MSTV license
Data acquisition platforms
J6801B Distributed Network Analyzer (DNA)
J6803B Distributed Network Analyzer PRO (DNA PRO)
J6804A Distributed Network Analyzer HD (DNA HD)
J6872A 10 Gigabit/Gigabit Ethernet Interface card Personal computer with NIC (Windows)
Add-on Licenses
J6900A-002 Triple Play Analyzer Video QoE Measurements
The Video QoE measurements provide simple, precise diagnostics of QoE and QoS metrics through non-intrusive measurements, including video-quality measure-ment technology to accurately predict video MOS for IPTV and VoD streams. This powerful option offers the most advanced video service quality analysis and trouble-shooting capabilities for media transport, IPTV, and VoD signaling.
Key Video QoE Measurements
• Auto-detection and analysis of MPEG-2 TS and/or ISMA video streams over RTP, UDP, and TCP
• Live decoding and viewing of video streams with audio
• Non-intrusive video-quality analysis using neural-network, model-based video MOS technology
• MPEG PES video analysis
• ETSI TR 101 290 MPEG transport stream priority events and analysis • RFC 4445 MDI scores for constant and variable bit rate streams
• Precise measurements of IP network performance and RTP/RTCP statistics, such as jitter, loss, delay, and RFC 3357 loss pattern sample metrics for video services • Passive channel zap analysis for IPTV multicast streams and RTSP command
J6900A-003 Triple Play Analyzer Voice QoE Measurements
The Voice QoE measurements provide simple, precise diagnostics of VoIP QoE and QoS metrics through nonintrusive measurements, including voice-quality measure-ment technology to accurately predict voice MOS.
Key VoIP QoE Measurements
• Auto-detection and analysis of VoIP streams • Real-time voice playout and recording
• Nonintrusive voice quality analysis using E-Model and predictive MOS technology • Precise measurements of IP network performance and RTP/RTCP statistics, such as
jitter, loss, burst loss, and delay for VoIP services
• Simple analysis that exposes the impairments to voice quality
J6900A-004 Triple Play Analyzer Mediaroom MSTV License
MSTV licensees may purchase this license to activate Microsoft Mediaroom support in the Triple Play Analyzer for advanced analysis of Mediaroom signaling protocols and media transport metrics.
Key Mediaroom MSTV QoE Measurements
• Auto-detection and analysis of ICC unicast streams • ICC media burst detection and statistics
– RTP throughput and packets lost – detailed MPEG TS measurements • ICC join-latency and zap-time analysis
• RUDP statistics and hole-fulfillment analysis, RUDP round-trip latency • DC&C message and error statistics
Data Acquisition Platforms
PacketPortalPacketPortal is a distributed packet acquisition and selective packet forwarding system that can capture traffic from points in a network and forward it to a TPA and other Ethernet-based applications for analysis. Enhanced SFP optical transceivers called SFProbes give PacketPortal enhanced network visibility normally reserved for taps or span ports which are directly connected to monitored devices.
PacketPortal lets you collect data throughout the entire network, from the edge to the core, by leveraging existing SFP ports and network cabling to inspect, filter, and forward traffic. PacketPortal reduces the need for separate network monitoring infra-structure by taking advantage of the network capacity already in place. PacketPortal provides access to network, service, and application data in near realtime.
The PacketPortal system consists of the following major components:
• SFProbe — installed in network switch and router ports in place of normal SFPs. SFProbes capture traffic based on filters and forward it across the network to PREs. • Packet routing engine (PRE) — aggregates captured traffic from SFProbes and
distributes it to analysis applications.
• System manager (SM) — provides a graphical user interface for command and control of SFProbes and PREs.
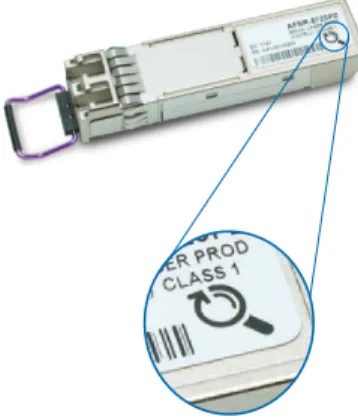
The JDSU SFProbe PacketPortal-enabled logo
J6801B DNA
The J6801B DNA is a small form factor system that does not include an integrated PC. It is deployed throughout the triple-play network at key aggregation points. The DNA includes an acquisition system capable of full line-rate capture and accommo-dates a hot-swappable line interface module (LIM). Under this configuration, the TPA software runs on a PC and connects to a DNA via the client server to acquire data from the network under test.
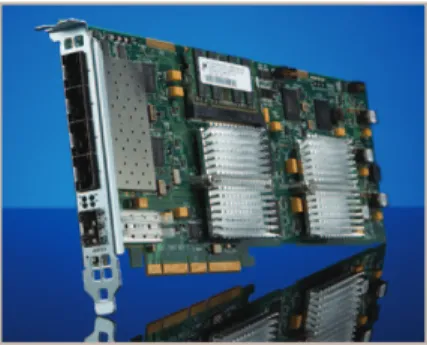
J6872A 10 Gigabit/Gigabit Ethernet Network Interface Card
The J6872A blade interface provides high performance and multi-port Ethernet packet acquisition and processing capabilities, which helps offload CPU intensive tasks and guarantees data integrity in your analysis scenario.
The blade interface features include:
• PCIe card with 5 100/1000 Ethernet ports and 2 10 G ports • supports copper and optical Ethernet interfaces
• 4 GB onboard memory • 100 ns timestamp
• high-performance packet acquisition with up to 10 G streaming to disk.
Personal Computer
TPA software may be installed on a PC. It uses the network driver interface specifica-tion (NDIS) interface to capture and analyze triple-play data from the network under test. TPA software can support up to four network interface cards (NICs) in a single PC. A high-end PC workstation or server platform is required to work with the blade interface to maximize TPA software performance.
PC Requirements for Triple Play Analyzer software:
• operating systems: Windows Server 2003 (32 bit or 64 bit), Windows Server 2008 (32 bit or 64 bit), Windows XP Professional SP3 (32 bit or 64 bit), and Windows 7 (32 bit or 64 bit)
• 10/100/1000 Mbps PCI EXPRESS® NIC • processor: quad-core 3 GHz or equivalent • memory (RAM): 4–8 GB
• disk space: 500 MB, 7200 rpm
• display: XVGA video adapter, 1024x768 • PCIe slot
Figure 7. J6872A 10 Gigabit/Gigabit Ethernet high-performance interface card
J6803B DNA PRO
The J6803B DNA PRO is a portable analyzer for local or remote troubleshooting that includes a high-performance data-acquisition system like a DNA and an embedded PC controller on which the client server software may run locally. Under this configu-ration, TPA software runs on a PC and connects to a DNA PRO to acquire data from the network under test.
J6804A DNA HD
The J6804A DNA HD is a data-acquisition probe with high-density GE ports and advanced Ethernet packet processing capabilities. It includes a high performance data acquisition system and 8 or 16 port 10/100/1000 Ethernet Interfaces. Under this con-figuration, TPA software runs on a PC and connects to a DNA HD via the client server to acquire data from multiple network interfaces.
Figure 5. J6803B DNA PRO
Detailed Specifications
Dashboard
The TPA dashboard detects triple-play services and transforms the data into mean-ingful diagnostic and QoS information. Constantly monitoring network traffic, the dashboard provides a top-level view of triple-play services and let users to quickly view the performance of the entire service. As quality issues arise, users can easily drill from the dashboard into the specific service to perform in-depth analysis and measurements for each protocol stack, including IPv6; all in real time as events occur. The dashboard is broken into five sections to provide the relevant top-level triple-play service statistics described here.
Data Section
• View network vital statistics at a glance
• Provides graphs and tables for Ethernet and TCP/IP utilizations, and events
Video Section
• Provides graphs and tables with user-selectable columns for MPEG TS video me-dia, such as video MOS degradation, MDI:DF, MDI:LR, throughput, PCR errors and jitter, PSI errors, and CAT errors
• Detects multicast and unicast video streams
Voice Section
• Provides graphs and tables with user-selectable columns for RTP voice media, such as VoIP MOS, jitter, percentage of lost packets, throughput, loss periods, MDI:DF, MDI:LR, and R-Factor.
• Detects VoIP streams and associated RTCP streams
Protocol Distribution Graphs
• Provides network protocol utilization distributions for the top triple-play protocols to give an overview of the types of traffic being carried
Service Distribution Graphs
• Breaks down the individual services by their utilization on the network to give an overview of the load for each service (video, VoIP, and data) on the network
Video QoE Measurements
TPA Video QoE measurements provide real-time analyses of MPEG-2 transport streams, ISMA video/audio RTP streams and QoE metrics for multicast IPTV streams, and unicast VoD streams. The J6900A-002 Video QoE license enables sev-eral measurement views as discussed here.
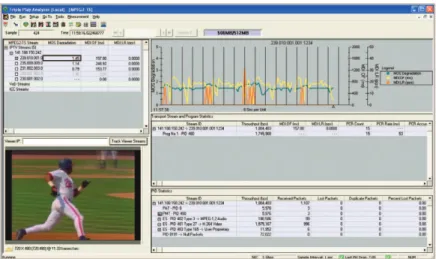
MPEG TS Statistics View
The TPA MPEG TS measurement decodes the PMT/PAT table and provides relevant statistics for the corresponding PIDs and transport streams. The MPEG TS view also lets users watch and listen to streams of interest in real time.
Key Features and Measurements
• Support for 188 byte and 204 byte MPEG-2 TS over UDP or RTP/UDP or RTSP/ TCP or RTP/RTSP/TCP
• Auto discovery and breakdown of IPTV, VoD, and MSTV ICC streams • Watch and listen to MPEG-2, MPEG-4, H.263, H.264, AVS, and other installed
CODECs in real time
• Listen to selectable audio tracks
• ETSI TR 101 290 first- and second-priority events – TS sync loss errors, sync byte errors, transport errors
– CAT errors, CAT CRC errors, PSI errors, PSI CRC errors, PSI late errors – PCR repetition errors, PCR discontinuity errors, PCR accuracy errors – continuity counter errors, PID dropout errors
• PCR jitter measurements • PSI and PCR rates
• Bit rates and utilizations per PID and ES
• Min/max/average RFC 4445 MDI:DF and MDI:LR for constant and variable bit rate streams
• Packet loss and duplicate packet counts
Figure 10. View MPEG PES problems at a glance
• MPEG transport stream sorting based on the selected column • Track configurable viewers streams
• Configurable alarms, thresholds, and monitoring • Friendly names for multicast and server IP addresses • User-configurable graphs and columns
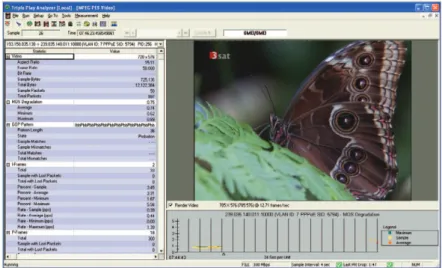
MPEG PES Video Statistics View
The TPA MPEG PES measurement decodes the MPEG PES and provides relevant PES layer information and detailed I, P, B frame statistics. It also allows users to watch video streams of interest in real time.
Key Features and Measurements
• Non-reference objective video MOS degradation scores, which is calibrated to ITU-T Recommendation J.144R full reference VQM standard
• Correlate video MOS degradation with real-time video render • MPEG GOP frame pattern auto-detection and analysis
• MPEG PES I, P, B frame rate and frame with lost packets statistics • MPEG PES layer video information:
– aspect ratio – frame rate – bit rate – total packets
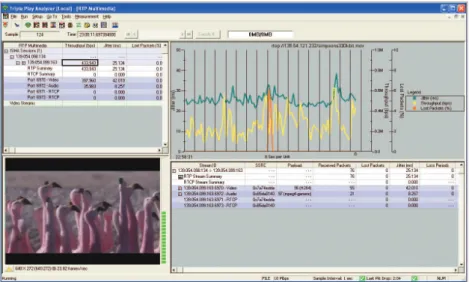
RTP Multimedia Statistics View
The TPA RTP Multimedia measurement provides RTP statistics for multicast IPTV streams and unicast VoD streams. It also lets users watch and listen to ISMA streams of interest in real time.
Key Features and Measurements
• Support for ISMA encapsulation over RTP/UDP or RTP/RTSP/TCP
• Auto-detect and group audio and video RTP/RTCP streams belonging to the same ISMA session
• VoIP MOS and R-Factor (min/max/average) • Throughput (min/max/average)
• MDI:DF, MDI:LR (min/max/average) • RTP jitter, packet loss (min/max/average) • RTCP delay
• RFC 3357 burst loss metrics
• RTP video stream sorting based on the selected column
• Watch and listen to ISMA session with MPEG-4 and H.264 CODECs in real time
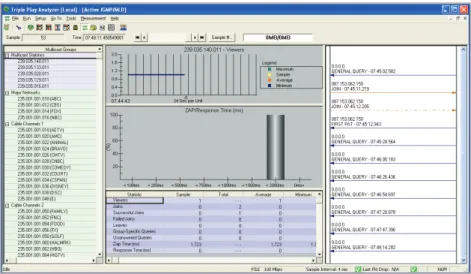
Active IGMP/MLD Statistics View
The Active IGMP measurement allows the TPA to join and leave multicast groups to gather statistics on aspects of IGMP signaling and to simplify obtaining video streams for additional analysis.
Key Features and Measurements • Supports IGMP v2/v3 emulation
• Automatically join and leave predefined multicast groups sequentially • On-demand IGMP join and leave
• Passively monitor traffic for IGMP/MLD messaging and report related statistics • Ladder diagram of signaling messages for selected multicast address
• Join latency distribution
• Key measurements (min/max/average) – number of viewers
– joins
– successful joins – failed joins – leaves
– group specific queries – unanswered queries – zap time (ms) – join latency (ms) – IGMP join latency (ms) – query response time (ms)
• Not currently supported by the J6872A 10 Gigabit/Gigabit Ethernet interface card
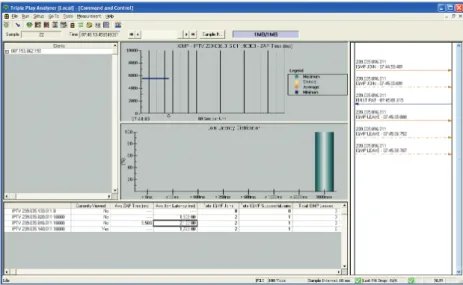
Command and Control Statistics View
IPTV services present new challenges for channel and video control that can severely impact QoE even when video transport is good. The TPA Command and Control measurements include real-time analysis of IPTV, VoD, and MSTV signaling. The TPA passively calculates IGMP/MLD channel change times using the most accurate method available based on when a set top box is first able to decode video.
Figure 13. IPTV Command and Control Statistics view
Key Features and Measurements
• Histogram graphs of IGMP join latency and RTSP response times to ensure consistent service and QoE
• Ladder diagram of signaling messages • MLD protocol support for IPv6 IPTV
channel change analysis
• Microsoft Mediaroom ICC, RUDP, and C&C statistics (enabled by J6900A-004 MSTV Protocol option)
• Select and view statistics by individual subscribers
• Zap time (min/max /average) • IGMP measurements:
– IGMP joins
– IGMP successful joins – IGMP leaves
– IGMP join latency (ms)
• RTSP response times • ICC (min/max/average):
– ICC joins
– ICC successful joins – ICC burst RTP packets
– ICC burst RTP throughput (bps) – ICC burst RTP lost packets • RUDP measurements (min/max/average):
– holes
– hole fulfillments – fulfilled holes – partially fulfilled holes – round-trip delay – hole size
– requested packets – fulfilled packets – fulfilled percentage
MSTV Protocol Option
This software option provides advanced analysis of Microsoft Mediaroom signal-ing protocols and media transport metrics. ICC unicast streams are automatically detected and analyzed. It also supports per-client measurements for ICC, RUDP, and C&C metrics, as well as comprehensive Mediaroom protocol decodes and fil-ters for root-cause troubleshooting.
Figure 14. Mediaroom Statistics view
• Heartbeat measurements: – counts
– interval (ms) – responses – response time – response time exceeds • C&C measurements:
– C&C join requests – C&C joint responses – C&C retry requests
– C&C burst completes – C&C statuses
– C&C know hole in stream – C&C leaves
– C&C errors
– C&C service not buffered errors – C&C invalid service errors – C&C session errors – C&C server full errors – C&C duplicate session
• ICC burst detection and media trans-port statistics:
– ICC burst RTP packets – ICC burst RTP throughput – ICC burst RTP lost packets – All the MPEG2 TS statistics • ICC signaling statistics and analysis:
– ICC zap time – ICC join latency – ICC joins
– ICC successful joins
• RUDP signaling statistics and hole fulfillment analysis:
– RUDP holes
– RUDP hole fulfillments – RUDP fulfilled holes – RUDP partially fulfilled holes – RUDP round-trip latency (also
known as round-trip delay time, RTT )
– RUDP hole size
– RUDP requested packets – RUDP fulfilled packets – RUDP fulfillment (%) • C&C heartbeat statistics:
– heartbeat counts – heartbeat interval
– heartbeat interval exceeds – heartbeat responses – heartbeat responses time – heartbeat responses exceeds • C&C message type statistics:
– join requests – join responses – retry requests – burst completes – burst complete acks – status
– status responses – known hole in stream – leaves
– errors
• C&C error type statistics, such as in-valid service, inin-valid session, duplicate join, and mismatched delivery mode • Mediaroom protocol decodes and
filter:
– Mediaroom RTP header extension and sub extension decodes and filter – full ICC, RUDP, and other C&C
messages decodes and filter – advanced filter for specific error
types, hoin request parameters, and retry request hole sizes.
Key Features and Measurements
Voice QoE Measurements
Voice QoE measurements provide real-time analysis of RTP streams for VoIP service. The software option provides simple, precise diagnostics of VoIP QoE and QoS met-rics through non-intrusive measurements, including a voice-quality measurement technology to accurately predict MOS. This powerful option offers the most advanced VoIP service quality troubleshooting capabilities available.
Key VoIP Features and Measurements
• Auto-detection and analysis of VoIP streams
• Nonintrusive voice quality analysis using predictive MOS technology for passive voice clarity MOS scoring
• R-Factor scores based on the ITU G.107 “E Model” • Support for real-time audio play out and recording
– G.711, G.722, G.723, G.729, AMR, and AMR-WB CODECs
– user-defined mapping table for the CODEC and RTP dynamic payload type • Precise measurements of IP network performance based on RTP/RTCP statistics
– min/max/average RTP jitter and packet loss – min/max/average RFC 4445 MDI:DF and MDI:LR – RFC 3357 burst loss metrics
• Stream ID and play load identification • Packet and byte counts
• Traffic utilization statistics
• VoIP analysis on VLAN, PPPoE, MPLS, IPv6, GTP, and GRE tunneling • Configurable alarms, thresholds, and monitoring
• Capture data and save to disk on user-definable events • User-configurable graphs
Data Measurements
The data measurement provides a high-level overview of the data performance and provides a quick drill-down for more detailed analysis, such as current and maximum utilization in real time and provides current, average, minimum, and peak data in a tabular format for the following parameters.
Figure 17. Network Vital Statistics view
• Ethernet Statistics – throughput – percent bandwidth • TCP/IP statistics – IP throughput – IP percent bandwidth – IP packet size – IP packets – IP broadcasts – IP multicasts – IP fragments – IP low TTL – IP routing packets – ICMP redirects
– ICMP destination unreachable – ICMPv6 destination unreachable – TCP low window packets – TCP reset connection packets – SNMP get/set packets – SNMP trap packets – DNS packets – ARP packets Key Features and Measurements
In Figure 18, the detailed display shows the field-by-field protocol decode for every frame, while the summary display provides a single-line display of the key fields. A hexa-decimal display is provided as well and shows easy correlation with the detailed display.
• Extensive protocol analysis: decode all major data, IPTV, VoD, and VoIP proto-cols, including HTTP, FTP, DNS, DHCP, RTP/RTCP, SIP, H.323,MGCP, H.248/ Megaco, IGMP v2/v3, RTSP, MSTV, MPEG-2 TS, MPEG PES, IPv4/IPv6, MPLS, VLANs, GRE, and GTP
For a complete list of decodes, please contact your JDSU representative. • Flexible display filter based on VLAN ID, MPLS label, source and destination
MAC/IP address, TCP and UDP port, protocols, MPEG-TS and PES fields, and packet bit pattern
Product specifications and descriptions in this document subject to change without notice. © 2012 JDS Uniphase Corporation 30168049 502 0212 TPA-TO.DS.NSD.TM.AE February 2012
Test & Measurement Regional Sales
NORTH AMERICA TEL: 1 866 228 3762 FAX: +1 301 353 9216 LATIN AMERICA TEL: +1 954 688 5660 FAX: +1 954 345 4668 ASIA PACIFIC TEL: +852 2892 0990 FAX: +852 2892 0770 EMEA TEL: +49 7121 86 2222 FAX: +49 7121 86 1222 WEBSITE: www.jdsu.com/test Events View
The TPA events view shown in Figure 19 provides a high-level overview of the events including current and historical events information. The instant events will be shown in real-time. It also lists in tabular format the time that events occurred, measurement type, measurement KPIs, threshold, and corresponding action.
Logging
Measurement logging is available to store test results, thresholds, and events to a file. Users can select logging for specific measurements from one common dialog box. Data is stored into files that can easily be opened by other JDSU or third-party applications. Also, the logging mechanism allows continuous logging of statistics in circular files that external systems can later retrieve.
Figure 19. TPA Events view