Tsu-Juey Wu, MD; James J.C. Ong, MD; Che-Ming Chang, MD; Rahul N. Doshi, MD;
Masaaki Yashima, MD; Hsun-Lun A. Huang, BS; Michael C. Fishbein, MD; Chih-Tai Ting, MD, PhD;
Hrayr S. Karagueuzian, PhD; Peng-Sheng Chen, MD
Background—In dogs, chronic rapid pacing may result in sustained atrial fibrillation (AF). However, activation patterns in pacing-induced sustained AF are unclear.
Methods and Results—We induced sustained AF (⬎48 hours) in 6 dogs by rapid pacing for 139⫾84 days. We then performed computerized atrial epicardial mappings and recorded the activations in the ligament of Marshall (LOM) and the pulmonary veins (PVs). During AF, mean activation cycle length in the right atrial free wall (126⫾17 ms) was significantly longer than that in the left atrial free wall (96⫾5 ms, P⫽0.006). In addition, mean activation cycle length in the left atrial free wall was significantly longer than that in the LOM (84⫾5 ms, P⬍0.001), the left inferior PV (81⫾4 ms, P⫽0.001), and the left superior PV (85⫾7 ms, P⫽0.003). Similarly, the dominant frequency was highest in the LOM and the PVs (range 11.2 to 13.3 Hz), followed by the left and right atria (P⬍0.001). In all dogs studied, rapid and complicated electrograms were consistently observed at the LOM and the PVs. During AF, both wandering wavelets and organized reentry were present. There were more wave fronts in the left atrium than in the right atrium (P⬍0.001). Conclusions—In chronic pacing-induced sustained AF, the LOM and the PVs are the sources of rapid activations. The
mechanism by which the left atrium activates faster and has more wave fronts than the right atrium may relate to the fact that the left atrium is closer to the sources of rapid activations. (Circulation. 2001;103:1157-1163.)
Key Words: arrhythmia 䡲 fibrillation 䡲 mapping 䡲 pacing 䡲 pathology
I
t has been demonstrated in animal models that chronic rapid pacing may induce sustained atrial fibrillation (AF).1–3The mechanisms by which sustained AF occurredwere usually attributed to atrial electrical remodeling, as evidenced by the progressive shortening of the atrial effective refractory period (AERP).1–3 Because AERP has been
re-ported to be shorter in the left atrium (LA) than in the right atrium (RA),3,4 the LA would have more reentrant wave
fronts and more complex activation patterns than the RA. However, because the activation patterns in chronic pacing-induced sustained AF are not well defined, it is unclear whether reentry is present in pacing-induced AF. In addition to the LA and the RA, other structures such as the pulmonary veins (PVs)5 and the ligament of Marshall (LOM)6 also
contain muscle fibers that are electrically active. Rapid activations from these structures are known to be responsible for paroxysmal AF in humans.7–9 We10 have previously
demonstrated that the LOM in dogs with long-term rapid pacing serves as a source of rapid activations and may
contribute to the development of AF in vitro. On the basis of these results, we hypothesize that rapid activations from these structures may also play roles in the formation of sustained AF in vivo. In the present study, we used chronic rapid pacing to induce sustained AF in dogs. During AF, the entire epicardial surfaces of both atria, the LOM, and the PVs were mapped with densely spaced bipolar electrodes. The purpose of this study was to test the following hypotheses: (1) chronic pacing-induced sustained AF is characterized by the presence of both wandering wavelets and organized reentry; and (2) there is an activation rate gradient during sustained AF, with the faster rate in the LOM and the PVs, followed by the LA and the RA.
Methods
Chronic Pacing-Induced Sustained AF
The method used to induce sustained AF has been described previously.10Briefly, 6 mongrel dogs (weight 17 to 25 kg) were used. Under general anesthesia, a bipolar pacing lead was inserted
Received June 6, 2000; revision received August 21, 2000; accepted September 12, 2000.
From the Division of Cardiology (T.-J.W., C.-T.T.), Department of Medicine, Taichung Veterans General Hospital and Institute of Clinical Medicine, National Yang-Ming University School of Medicine, Taipei, Taiwan; and the Division of Cardiology (J.J.C.O., C.-M.C., R.N.D., M.Y., H.-L.A.H., H.S.K., P.-S.C.), Department of Medicine, Cedars-Sinai Medical Center and the Department of Pathology and Laboratory Medicine (M.C.F.), UCLA School of Medicine, Los Angeles, Calif.
Corresondence to Tsu-Juey Wu, MD, Division of Cardiology, Department of Medicine, Taichung Veterans General Hospital, 160, Section 3, Chung-Kang Road, Taichung, Taiwan. E-mail [email protected]
© 2001 American Heart Association, Inc.
Circulation is available at http://www.circulationaha.org
1157
via a right jugular vein into the RA appendage. The pulse generator (Medtronic Itrel neurostimulator) was programmed to burst pace at a pacing interval of 50 ms for 5 seconds, followed by a 2-second period without pacing. Digoxin (0.125 to 0.25 mg/d) was given to control ventricular rate. The pacemaker was then turned off period-ically so that the animals could be checked for the presence of sustained AF (⬎48 hours in duration). When sustained AF was documented, the dogs were ready for the mapping study.
Computerized Mappings
In dogs 1 to 5, we performed high-density computerized mapping studies using 480 bipolar electrodes. As shown in Figure 1A, 4 large plaque electrodes with 2.5-mm interelectrode distance were used to cover the entire epicardial surfaces of the LA (1 and 2) and the RA (3 and 4) free walls. The electrodes were connected to a computer-ized mapping system for data acquisition.11 To simultaneously record the activations in the LOM, a small plaque (4.5⫻1.0 cm, marked “LOM” in Figure 1A) containing 30 bipolar electrodes with 5.0-mm interelectrode distance was used to map the posterolateral
LA. In addition, 1 pair of hook bipolar recording electrodes was inserted into each PV within 1 cm of the atrial free wall. We also inserted a basket electrode catheter (Webster) via the femoral vein into the RA to register the activations in the interatrial septum using 5 bipolar recording electrodes.
In 1 dog (dog 6), 4 pairs of hook bipolar recording electrodes were evenly placed in each of the atrial free walls. Similarly, activations in the LOM (2 pairs of hook bipolar electrodes) and in the PVs (1 pair of hook bipolar electrodes for each) were also registered. Both the epicardial bipolar electrograms and the surface ECG were acquired continuously.10This dog (dog 6) served as a control to rule out the possibility that large plaque electrodes used in dogs 1 to 5 might alter the activation rates in the areas mapped.
Cardioversions
In dogs 1 to 5, after sustained AF was mapped, synchronized cardioversions (25 to 50 J) were attempted to convert the rhythm from AF to sinus rhythm. Computerized mappings of sinus rhythm and during the spontaneous recurrence of AF were then performed.
Activation Cycle Lengths at Different Regions During Chronic Pacing-Induced Sustained AF
Dog No. Duration of Pacing for Occurrence of Sustained AF, days Total Duration of Follow-Up, days
Activation Cycle Length, ms
RAFW* Septum LAFW* LOM* RSPV RIPV LSPV* LIPV* 1 183 255 147⫾18 120⫾6 93⫾11 79⫾7 88 83 83 76 2 88 98 121⫾12 113⫾5 103⫾11 86⫾8 97 85 89 80 3 282 319 147⫾14 128⫾7 102⫾10 92⫾6 92 90 92 85 4 71 83 118⫾17 104⫾6 93⫾13 82⫾4 NA NA 85 81 5 65 68 107⫾16 NA 92⫾10 78⫾4 NA NA 73 79 6 142 168 113⫾6 NA 95⫾6 84⫾7 96 89 90 87 Mean⫾SD 139⫾84 165⫾102 126⫾17 116⫾10 96⫾5 84⫾5 93⫾4 87⫾3 85⫾7 81⫾4
RAFW indicates RA free wall; LAFW, LA free wall; RSPV, right superior PV; RIPV, right inferior PV; LSPV, left superior PV; NA, not available; and LIPV, left inferior PV.
*P⬍0.001 by ANOVA.
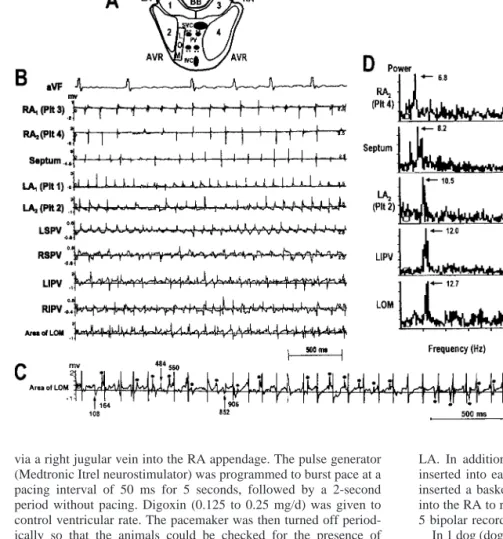
Figure 1.Simultaneous multisite record-ings during sustained AF (data from dog 1). A, Mapping areas including epicardial surfaces of LA (plaques 1 and 2) and RA (plaques 3 and 4) free walls, interatrial septum, LOM, and PVs. B, Actual activa-tions registered from different regions. C, Example of activation time determination. Numbers indicate activation times (ms). D, FFTs for selected channels in B. Arrows and numbers indicate dominant peak and dominant frequency (Hz), respectively. AVR indicates atrioventricu-lar ring; BB, Bachmann’s bundle; IVC, inferior vena cava; LIPV, left inferior PV; LSPV, left superior PV; Plt, recording electrode plaque; RIPV, right inferior PV; RSPV, right superior PV; and SVC, supe-rior vena cava.
Histological Examination
At the conclusion of each study, the hearts were fixed and processed routinely. The sections were stained with hematoxylin-eosin and trichrome. The areas with slow conduction and conduction block were correlated with the anatomic findings.
Data Analysis
We analyzed 3 runs of AF (8 seconds per run) in each dog according to the methods reported previously.11Briefly, the computer selected a time as the local activation if the dV/dt exceeded 20% of the maximal dV/dt in that channel and if an interval of 50 ms had passed since a previous activation. Figure 1C shows an example. The activations selected by the computer were marked by vertical lines. Manual editing was then performed to select the activations (vertical arrows) with the dV/dt ⬍20% of the maximum. The deflections within 50 ms of a computer-selected activation were not selected manually (asterisks). Once the times of activation were determined, they were displayed dynamically.11The patterns of activation were then studied. For analysis of organized reentry and lines of conduc-tion block, we focused on 1 plaque at a time by repeated displays.
We also performed fast Fourier transforms (FFTs) on bipolar electrograms from different regions.12 The relative amplitudes of peaks in each FFT were compared to determine the dominant peak and the dominant frequency (Figure 1D).
ANOVAs with repeated measures were performed to determine whether there were differences in the activation cycle lengths among different regions. If ANOVA showed significant differences, we then used paired t tests to compare the means of activation cycle lengths. The interatrial septum and the right PVs were not included in analyses because of missing data (Table). ANOVA was also used to compare the dominant frequency among different regions. Students’ t tests were used to compare the mapping data (such as the number of wave fronts and the length of line of block) between the LA and the RA. A P valueⱕ0.05 was considered significant. In case of multiple comparisons, Bonferroni adjusted probability values were used to determine significance.
Results
After 139⫾84 days of rapid pacing, sustained AF was induced in all 6 dogs. These dogs were studied 27⫾25 days after sustained AF was documented. All dogs arrived at the laboratory in AF with a mean ventricular cycle length of 508⫾46 ms. All dogs continued to fibrillate throughout the experiments or until successful cardioversion. There was no clinical evidence of heart failure in any dog studied.
Activation Rate Gradient During Sustained AF
The time between the first and third runs of AF analyzed averaged 12⫾2.7 minutes. The variability of activation cycle lengths, estimated by the difference between the fastest and the slowest runs, was 4.2⫾1.7 ms.
During sustained AF, there was an activation rate gradient in all 6 dogs studied. As shown in Figure 1B and the Table, activation was faster in the PVs and the LOM, followed by the LA and the RA free walls. There were no differences among the LOM and the left inferior or left superior PVs. Mean activation cycle length at the RA free wall was significantly (P⫽0.006) longer than that at the LA free wall. Furthermore, mean activation cycle length in the LA free wall was significantly longer than that in the LOM (P⬍0.001), the left inferior PV (P⫽0.001), and the left superior PV (P⫽0.003). Complicated activations, defined as frequent occurrences of deflections separated by intervals of⬍50 ms, were consistently observed at the LOM and the PVs in all dogs studied (Figures 1B and 1C).
FFT analyses also showed a gradient of dominant fre-quency distribution, with the higher frefre-quency in the LOM
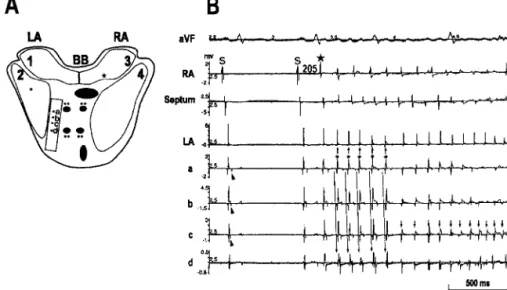
Bachmann’s bundle. B, Sinus beats (S) followed by atrial tachycardia and AF. Double potentials were seen in channels a to c during sinus rhythm (arrowheads). Separation of these 2 potentials (atrial electrogram and LOM potential) was widest in channel a, became shorter in b and c, and merged in d. Atrial tachycar-dia was induced by premature contrac-tion from high RA with coupling interval of 205 ms (large asterisk). During atrial tachycardia, earliest activation was regis-tered at channel a (small asterisks). LOM potential occurred after local atrial elec-trogram, indicating that LOM itself is not the source of atrial tachycardia. How-ever, during transition to AF, rapid acti-vations (small downward arrows) were recorded at channel c. Small unfilled circle in plaque 2 and asterisk in plaque 3 of panel A indicate recording sites of LA and RA chan-nels in panel B.
Figure 3.Organized reentry and incomplete rotating circuits in atrial free walls. Square in plaque 3 and asterisk in plaque 4 indicate common sites for appearance of new wave fronts in RA. Black segments (without arrows) in plaques 2 and 4 indi-cate common positions of lines of block during AF.
(12.1⫾1.0 Hz) and the PVs (left superior PV 11.7⫾0.8 Hz, left inferior PV 12.0⫾0.4 Hz), followed by the left (10.2⫾0.6 Hz) and the right (8.0⫾1.0 Hz) atria (P⬍0.001). Examples are shown in Figure 1D. The site with the highest dominant frequency (range 11.2 to 13.3 Hz) was located at the LOM in 4 and the left inferior PV in 2 dogs.
Spontaneous Recurrence of AF After Successful Cardioversion
Successful cardioversion was achieved in dogs 1, 2, and 3. Among these dogs, dogs 1 (6 episodes) and 2 (2 episodes) had spontaneous recurrence of AF within 10 minutes after suc-cessful cardioversion. In dog 3, however, there was no atrial ectopic beat or recurrent AF after successful cardioversion.
These AF episodes were initiated by a single ectopic beat arising either from the high RA (dog 1) or from the LA free wall (dog 2). The single ectopic beat first induced a short
period (788⫾333 ms) of more organized activity (atrial tachycardia). It was then followed by rapid activations (cycle lengths, range 65 to 120 ms) converting atrial tachycardia to AF. Both the earliest activations during atrial tachycardia and the rapid activations during transition to AF were consistently recorded by the electrodes overlying the LOM. Figure 2 shows an example, suggesting the possible importance of the LOM for AF recurrence.
Characteristics of Wave Fronts During Sustained AF
As described previously,13 multiple wave fronts were
ob-served in each episode of sustained AF. In addition, both wandering wavelets and organized reentry were present. The mean number of wave fronts in the LA free wall was significantly more than that in the RA free walls (11.8⫾1.1 versus 8.7⫾1.3 per second in each plaque, P⬍0.001).
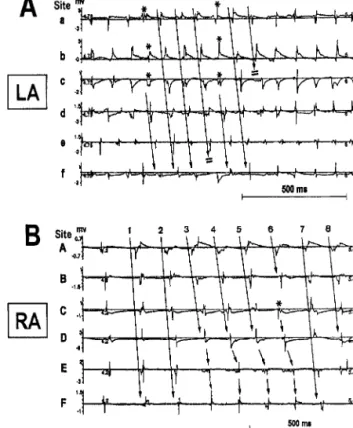
Simi-Figure 4.Examples of AF activations (data from dog 3). A, Planar wave front originated from LA appendage (asterisk in plaque 2). This wave front propagating from left to right encountered a line of block in middle region of plaque 2, leading to wave break (asterisk in B) and initiation of reentry (B through E). In G through L, wave fronts arising from Bachmann’s bundle (marked by squares) initiated incomplete reentry. Note that lines of block that occurred in plaque 4 varied in length from activation to activation (H, J, and L). Dia-gram in F shows path and direction of tip of rotating wave fronts in both atria. Each letter in F (a–f in plaque 2 and A–F in plaque 4) shows recording site for corresponding channel in Figures 5A and 5B. BB indicates Bachmann’s bundle; Plt, recording electrode plaque; SVC, superior vena cava; and IVC, inferior vena cava.
larly, the maximum number of wave fronts in the LA free wall (range 2 to 4 in each plaque) was more than in the RA free wall (range 1 to 3 in each plaque) (2.9⫾0.5 versus 1.8⫾0.7 in each plaque, P⬍0.001).
Reentrant Wave Fronts During AF
Macroreentry was present in each run of AF. In the LA, reentrant wave fronts (76 episodes in 15 runs of AF) always had complete rotations. Among 17 episodes in 2 dogs, reentry appeared near the Bachmann’s bundle (pattern a in Figure 3). However, most of reentry (59 of 76 episodes, 78%) occurred at plaque 2 (pattern b in Figure 3) in 5 dogs. The life span of reentry was short (2.4⫾1.1 rotations, range 1 to 5), and the mean cycle length was 89⫾9 ms. In contrast, complete reentry (only 2 episodes in 15 runs of AF) was rare in the RA. Most (61 episodes in 15 runs of AF) showed incomplete reentry. They originated either from the Bachmann’s bundle (n⫽45, pattern c in Figure 3) in 5 dogs or from the medial side of plaque 4 (n⫽16, pattern d in Figure 3) in 2 dogs. Compared with reentry in the LA, incomplete reentry in the RA persisted longer in each episode (5.9⫾3.2 rotations, range 2 to 20, P⬍0.001), and the mean activation interval was also longer (122⫾22 ms, P⬍0.001).
4 shows an example. During each run of AF, the mean duration of the presence of organized wave fronts (patterns c and d in Figure 3) in the RA was significantly longer than that in the LA (patterns a and b in Figure 3; percent of the recording time 40⫾14% versus 15⫾9.1%, P⬍0.001).
Lines of Conduction Block and Endocardial Structures
As shown in Figures 3 and 4, there were lines of conduction block observed in both atria during AF. These lines always occurred over the same regions in each dog but varied in length from beat to beat (as shown in Figures 4F, 4H, 4J, and 4L). Furthermore, the fully extended lines observed in the RA (n⫽10) were longer than those in the LA (n⫽8; 14.2⫾1.1 versus 8.5⫾0.7 mm, P⬍0.001). Verified anatomically, these lines always occurred along the long axis of atrial endocardial structures, including the crista terminalis in 2 dogs and large pectinate muscles in 5. In both atria, these rotating wave fronts were usually initiated by conduction block along these structures, leading to wave break (an asterisk in Figure 4B) and the initiation of complete reentry (Figures 4A through 4F) or incomplete circuits (Figures 4F and 4G through 4L). Figure 5 shows the actual activations registered in Figure 4.
Histological Examination
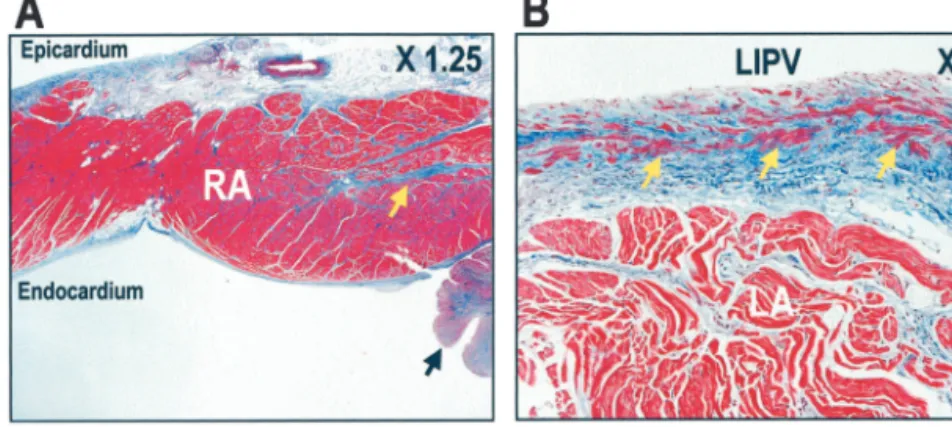
In all dogs studied, increased fibrosis and organized thrombi occurred around the pacemaker lead insertion site. However, remote from the lead insertion site, there was only a focal and mild increase in fibrous tissue in either atrium. These findings are similar to those reported by others.1Figure 6A shows a
typical example. In Figure 6B, trichrome stain shows that there was a thick intimal layer in the PVs. The intimal layer was composed of collagen and smooth muscle cells arranged individually and in small bundles. These smooth muscle cells were embedded within the collagenous tissue and were isolated from the atrial myocardium by the collagenous stroma of the intima.
Discussion
This study has the following major findings: (1) In chronic pacing-induced sustained AF, there is an activation rate gradient, with the LOM and the PVs activating consistently faster than the LA and the RA free walls. (2) Both wandering wavelets and organized reentry are present during sustained AF. (3) The LA has more wave fronts than the RA. (4) Atrial endocardial structures are important in modulating the wave-front dynamics.
Mechanisms of Chronic AF
Prinzmetal et al14proposed that rapid focal activations could
result in AF (the focal-source hypothesis of AF). Recently, this hypothesis was supported by radiofrequency ablation of AF by energy application inside the PVs in humans.7The PVs
were also found to be the sources of rapid activations of AF
Figure 5.Actual activations registered in Figure 4. A, Activations in plaque 2 of Figure 4F. Asterisks in A indicate activations of 2 planar wave fronts propagating from LA appendage. B, Activa-tions in plaques 3 and 4 of Figure 4F. In B, there was no line of block during first and second activations (marked by 1 and 2). However, in third activation (3), line of block (7 mm in length) occurred. This line was fully extended from 7 to 15 mm during the following 3 activations (4, 5, and 6). In last 2 activations (7 and 8), this line disappeared. Figures 4H, 4J, and 4L show sec-ond, third, and fourth activations in B, respectively.
in isolated sheep hearts.12In addition to the PVs, we9recently
demonstrated that the LOM could be a source of rapid activations in patients with paroxysmal AF. Results of the present study indicate that similarly to paroxysmal AF, the LOM and the PVs are also the sources of rapid activations in chronic pacing-induced sustained AF. These findings provide a potential implication that ablation or isolation of all the PVs and the LOM may result in cure of AF.
Many investigators have demonstrated that during sus-tained AF in humans15and in dogs,1,16the LA activates faster
than the RA. Small areas of particularly rapid activations can be identified in the PV orifice region in humans15and in the
posterior LA in dogs. A combination of mitral valve surgery, cryoablation of the PV orifice, and resection of the LA appendage cured 10 of 12 patients with chronic AF and mitral valve diseases.15Although the authors did not specifically test
the hypothesis that PV or LOM ablation terminates chronic AF, their findings are encouraging.
Explanation for Activation Rate Gradient Between LA and RA
According to the focal-source hypothesis of AF,14 rapid
activation foci could drive the atria into fibrillation. Because of the high-rate activations, conduction block might occur between the source and the target. Therefore, tissues (the RA and the septum) that are further away from these focal sources have slower activation rates than tissues closer to the source, such as the LA free wall.
A second possible explanation is the anatomic differences between the LA and the RA. The presence of large anatomic barriers (the crista terminalis and large pectinate muscles) in the RA might facilitate the formation of large reentry with long activation cycle lengths.17In comparison, the PVs and
the LOM in the LA might also provide areas of conduction block, creating anatomically preferred circuits for reentry. However, because the anatomic barriers in the LA are smaller than those in the RA, the reentrant cycle lengths in the LA are shorter.
A third possible explanation is the development of differ-ential AERP after chronic rapid pacing. As demonstrated previously,1local AERP correlated well with local activation
cycle length in AF. Differential electrical remodeling may be induced by chronic rapid pacing, resulting in shorter AERP in the LA than in the RA.3,4
A fourth possible factor is that chronic pacing induces differential autonomic remodeling. Jayachandran et al16
re-cently reported that rapid atrial pacing could result in a heterogeneous increase in atrial sympathetic innervation. These changes parallel the changes on atrial electrophysiol-ogy, including the activation cycle length.
Study Limitations
The demonstration of rapid activations from the LOM and the PVs in the present study does not necessarily rule out the importance of multiple-wavelet reentry13as a
mecha-nism of AF. A limitation of this study was that we did not perform ablations of all the PVs and the LOM to determine whether these ablations would terminate AF. Also, our data cannot completely rule out the possibility that fibril-latory conduction from a slower source into the highly anisotropic regions could produce faster and more disor-ganized electrograms.
Acknowledgments
This study was supported by grants from the American Heart Association (1114-G12, 9750623N, and 9950464N), the National Institutes of Health (HL-03611 and HL-52319), the University of California Tobacco-Related Disease Research Program (UC-TRDRP 9RT-0041), a Piansky Family Endowment, a Cedars-Sinai ECHO Foundation Award, a Pauline and Harold Price Endowment, and the Ralph M. Parsons Foundation, Los Angeles, Calif. We thank Dr Rahul Mehra and Medtronics Inc for provid-ing Itrel neurostimulator, and Avile McCullen, Meilprovid-ing Yuan, and Elaine Lebowitz for assistance.
References
1. Morillo CA, Klein GJ, Jones DL, et al. Chronic rapid atrial pacing: structural, functional, and electrophysiological characteristics of a new model of sustained atrial fibrillation. Circulation. 1995;91: 1588 –1595.
2. Wijffels MCEF, Kirchhof CJHJ, Dorland R, et al. Atrial fibrillation begets atrial fibrillation: a study in awake chronically instrumented goats. Circulation. 1995;92:1954 –1968.
3. Li H, Hare J, Mughal K, et al. Distribution of atrial electrogram types during atrial fibrillation: effect of rapid atrial pacing and intercaval junction ablation. J Am Coll Cardiol. 1996;27:1713–1721.
4. Lee SH, Lin FY, Yu WC, et al. Regional differences in the recovery course of tachycardia-induced changes of atrial electrophysiological properties. Circulation. 1999;99:1255–1264.
Figure 6.Trichrome stain of atria. A, Focal fibrosis (dog 5). Pacing site is to right of this panel. Black arrow points to endocar-dial thrombus. Yellow arrow indicates focal fibrosis near pacing site. B, Example of left inferior PV (LIPV; dog 6). This PV had a thick collagenous intimal layer containing smooth muscle cells (yellow arrows). These smooth muscle cells were separated from atrial myocardium by collagenous tissue.
dog. Circ Res. 1972;31:18 –35.
7. Haissaguerre M, Jais P, Shah DC, et al. Spontaneous initiation of atrial fibrillation by ectopic beats originating in the pulmonary veins. N Engl J Med. 1998;339:659 – 666.
8. Hwang C, Karagueuzian HS, Chen P-S. Idiopathic paroxysmal atrial fibrillation induced by a focal discharge mechanism in the left superior pulmonary vein: possible roles of the ligament of Marshall. J Cardiovasc Electrophysiol. 1999;10:636 – 648.
9. Hwang C, Wu T-J, Doshi RN, et al. Vein of Marshall cannulation for the analysis of electrical activity in patients with focal atrial fibrillation. Circulation. 2000;101:1503–1505.
10. Doshi RN, Wu T-J, Yashima M, et al. Relation between ligament of Marshall and adrenergic atrial tachyarrhythmia. Circulation. 1999;100:876 – 883. 11. Lee JJ, Kamjoo K, Hough D, et al. Reentrant wave fronts in Wiggers’
stage II ventricular fibrillation: characteristics, and mechanisms of termi-nation and spontaneous regeneration. Circ Res. 1996;78:660 – 675.
uation of Moe’s multiple wavelet hypothesis of atrial fibrillation. In: Zipes DP, Jalife J, eds. Cardiac Arrhythmias. New York, NY: Grune & Stratton; 1985:265-276.
14. Prinzmetal M, Corday E, Brill IC, et al. Mechanism of the auricular arrhythmias. Circulation. 1950;1:241–245.
15. Harada A, Konishi T, Fukata M, et al. Intraoperative map guided operation for atrial fibrillation due to mitral valve disease. Ann Thorac Surg. 2000;69:446 – 450.
16. Jayachandran JV, Sih HJ, Winkle W, et al. Atrial fibrillation produced by prolonged rapid atrial pacing is associated with heterogeneous changes in atrial sympathetic innervation. Circulation. 2000;101: 1185–1191.
17. Wu T-J, Yashima M, Xie F, et al. Role of pectinate muscle bundles in the generation and maintenance of intra-atrial reentry: potential implications for the mechanism of conversion between atrial fibrillation and atrial flutter. Circ Res. 1998;83:448 – 462.