Final Report-Fort Lewis
Diagnostic Tools for Performance Evaluation of Innovative
In-Situ Remediation Technologies at Chlorinated
Solvent-Contaminated Sites
ESTCP Project ER-200318
July 2011 Michael Kavanaugh
Rula Deeb Elisabeth Hawley Malcolm Pirnie, Inc.
REPORT DOCUMENTATION PAGE OMB No. 0704-0188 Form Approved
The public reporting burden for this collection of information is estimated to average 1 hour per response, including the time for reviewing instructions, searching existing data sources, gathering and maintaining the data needed, and completing and reviewing the collection of information. Send comments regarding this burden estimate or any other aspect of this collection of information, including suggestions for reducing the burden, to the Department of Defense, Executive Services and Communications Directorate (0704-0188). Respondents should be aware that notwithstanding any other provision of law, no person shall be subject to any penalty for failing to comply with a collection of information if it does not display a currently valid OMB control number.
PLEASE DO NOT RETURN YOUR FORM TO THE ABOVE ORGANIZATION.
1. REPORT DATE (DD-MM-YYYY) 2. REPORT TYPE 3. DATES COVERED (From - To)
4. TITLE AND SUBTITLE 5a. CONTRACT NUMBER
5b. GRANT NUMBER
5c. PROGRAM ELEMENT NUMBER 5d. PROJECT NUMBER
5e. TASK NUMBER 5f. WORK UNIT NUMBER 6. AUTHOR(S)
7. PERFORMING ORGANIZATION NAME(S) AND ADDRESS(ES) 8. PERFORMING ORGANIZATION REPORT NUMBER
9. SPONSORING/MONITORING AGENCY NAME(S) AND ADDRESS(ES) 10. SPONSOR/MONITOR'S ACRONYM(S)
11. SPONSOR/MONITOR'S REPORT NUMBER(S) 12. DISTRIBUTION/AVAILABILITY STATEMENT 13. SUPPLEMENTARY NOTES 14. ABSTRACT 15. SUBJECT TERMS
16. SECURITY CLASSIFICATION OF: a. REPORT b. ABSTRACT c. THIS PAGE
17. LIMITATION OF
ABSTRACT 18. NUMBER OF PAGES
19a. NAME OF RESPONSIBLE PERSON
02-07-2011 Final Report-Fort Lewis 2003-02-07-2011
Diagnostic Tools for Performance Evaluation of Innovative In-Situ Remediation Technologies at Chlorinated Solvent-Contaminated Sites
ER-200318 Rula Deeb
Michael Kavanaugh Elisabeth Hawley
Malcom Pirnie, Inc.
2000 Powell Street, Suite 1180 Emeryville, CA 94608
ER-200318
SERDP/ESTCP
901 North Stuart Street, Suite 303 Arlington, VA 22203
SERDP/ESTCP
Unlimited
The overall objective of this demonstration project was to evaluate innovative diagnostic tools for the implementation and optimization of bioremediation technology applications. The specific objectives of this demonstration project included: 1)
demonstrate the effectiveness of ISB for remediation of chlorinated solvent residual DNAPL contamination using conventional and innovative diagnostic tools, 2) demonstrate efficacy of alternative diagnostic tools for evaluating performance and enhancing implementation of bioremediation in chlorinated solvent source areas, and 3) compare these innovative methods with conventional diagnostic tools that are currently used for assessing bioremediation performance.
INSTRUCTIONS FOR COMPLETING SF 298 1. REPORT DATE. Full publication date, including
day, month, if available. Must cite at least the year and be Year 2000 compliant, e.g. 30-06-1998; xx-06-1998; xx-xx-1998.
2. REPORT TYPE. State the type of report, such as final, technical, interim, memorandum, master's thesis, progress, quarterly, research, special, group study, etc.
3. DATES COVERED. Indicate the time during which the work was performed and the report was written, e.g., Jun 1997 - Jun 1998; 1-10 Jun 1996; May - Nov 1998; Nov 1998.
4. TITLE. Enter title and subtitle with volume number and part number, if applicable. On classified documents, enter the title classification in
parentheses.
5a. CONTRACT NUMBER. Enter all contract numbers as they appear in the report, e.g. F33615-86-C-5169.
5b. GRANT NUMBER. Enter all grant numbers as they appear in the report, e.g. AFOSR-82-1234.
5c. PROGRAM ELEMENT NUMBER. Enter all program element numbers as they appear in the report, e.g. 61101A.
5d. PROJECT NUMBER. Enter all project numbers as they appear in the report, e.g. 1F665702D1257; ILIR.
5e. TASK NUMBER. Enter all task numbers as they appear in the report, e.g. 05; RF0330201; T4112.
5f. WORK UNIT NUMBER. Enter all work unit numbers as they appear in the report, e.g. 001; AFAPL30480105.
6. AUTHOR(S). Enter name(s) of person(s) responsible for writing the report, performing the research, or credited with the content of the report. The form of entry is the last name, first name, middle initial, and additional qualifiers separated by commas, e.g. Smith, Richard, J, Jr.
7. PERFORMING ORGANIZATION NAME(S) AND ADDRESS(ES). Self-explanatory.
8. PERFORMING ORGANIZATION REPORT NUMBER.
Enter all unique alphanumeric report numbers assigned by the performing organization, e.g. BRL-1234;
AFWL-TR-85-4017-Vol-21-PT-2.
9. SPONSORING/MONITORING AGENCY NAME(S) AND ADDRESS(ES). Enter the name and address of the organization(s) financially responsible for and
monitoring the work.
10. SPONSOR/MONITOR'S ACRONYM(S). Enter, if available, e.g. BRL, ARDEC, NADC.
11. SPONSOR/MONITOR'S REPORT NUMBER(S).
Enter report number as assigned by the sponsoring/ monitoring agency, if available, e.g. BRL-TR-829; -215.
12. DISTRIBUTION/AVAILABILITY STATEMENT. Use agency-mandated availability statements to indicate the public availability or distribution limitations of the report. If additional limitations/ restrictions or special markings are indicated, follow agency authorization procedures, e.g. RD/FRD, PROPIN, ITAR, etc. Include copyright information.
13. SUPPLEMENTARY NOTES. Enter information not included elsewhere such as: prepared in cooperation with; translation of; report supersedes; old edition number, etc.
14. ABSTRACT. A brief (approximately 200 words) factual summary of the most significant information.
15. SUBJECT TERMS. Key words or phrases identifying major concepts in the report.
16. SECURITY CLASSIFICATION. Enter security classification in accordance with security classification regulations, e.g. U, C, S, etc. If this form contains classified information, stamp classification level on the top and bottom of this page.
17. LIMITATION OF ABSTRACT. This block must be completed to assign a distribution limitation to the abstract. Enter UU (Unclassified Unlimited) or SAR (Same as Report). An entry in this block is necessary if the abstract is to be limited.
TABLE OF CONTENTS
1.0 INTRODUCTION ... 1
1.1 BACKGROUND ... 2
1.2 OBJECTIVES OF THE DEMONSTRATION ... 4
1.3 REGULATORY DRIVERS ... 4
2.0 TECHNOLOGY ... 5
2.1 TECHNOLOGY DESCRIPTION ... 5
2.1.1 3-D Sampling of Multiple Level Wells ... 7
2.1.2 Compound-Specific Stable Isotope Analysis ... 7
2.1.3 Molecular Tools ... 9
2.1.4 Mass Flux Analysis ... 12
2.2 ADVANTAGES AND LIMITATION OF THE TECHNOLOGY ... 13
3.0 PERFORMANCE OBJECTIVES ... 15 4.0 SITE DESCRIPTION ... 22 4.1 SITE LOCATION ... 22 4.2 SITE GEOLOGY/HYDROGEOLOGY ... 23 4.3 CONTAMINANT DISTRIBUTION ... 25 5.0 TEST DESIGN ... 27
5.1 CONCEPTUAL EXPERIMENTAL DESIGN ... 27
5.1.1 Treatment Cell Design ... 30
5.1.2 Implementation ... 30
5.2 BASELINE CHARACTERIZATION: Phases 1 and 2 ... 36
5.2.1 Phase 1-Hydraulic Characterization ... 36
5.2.2 Pumping and Hydraulic Tests ... 36
5.2.3 Tracer Studies ... 37
5.2.4 Phase 2-Baseline Chemical Characterization... 37
5.3 TREATABILITY OR LABORATORY STUDY RESULTS ... 37
5.4 FIELD TESTING: Phase 3 biostimulation ... 38
5.5 SAMPLING METHODS ... 39
5.5.1 3-D CMT Analytical ... 40
5.5.2 Passive Flux Meters ... 40
5.5.3 CSIA ... 42
5.5.4 Molecular Tools ... 43
5.6 SAMPLING RESULTS ... 45
5.6.1 3-D CMT sampling ... 45
5.6.2 Passive Flux Meters ... 63
5.6.3 Carbon Stable Isotope Analysis ... 69
5.6.4 Molecular Tools ... 73
6.0 PERFORMANCE ASSESSMENT ... 92
6.1 3-D CMT SAMPLING ... 92
6.2 FLUX METERS ... 93
6.3 STABLE CARBON ISOTOPES ... 93
6.4 MOLECULAR TOOLS ... 94
6.5 SUMMARY OF INNOVATIVE DIAGNOSTIC TOOLS ... 95
7.0 COST ASSESSMENT ... 98
7.1 COST MODEL ... 98
7.2 COST DRIVERS ... 101
7.3 COST ANALYSIS... 101
7.3.1 Cost Benefit of Implementing Innovative Diagnostic Tools ... 104
8.0 IMPLEMENTATION ISSUES ... 112
8.1 Environmental Checklist ... 112
8.2 Other Regulatory Issues ... 112
8.3 End-User Issues ... 113
APPENDICES
Appendix A: Points of Contact
LIST OF FIGURES
Figure 2-1. Typical CMT Monitoring Well Configuration. ...8
Figure 4-1. Location of the EGDY (USACE, 2008). ...22
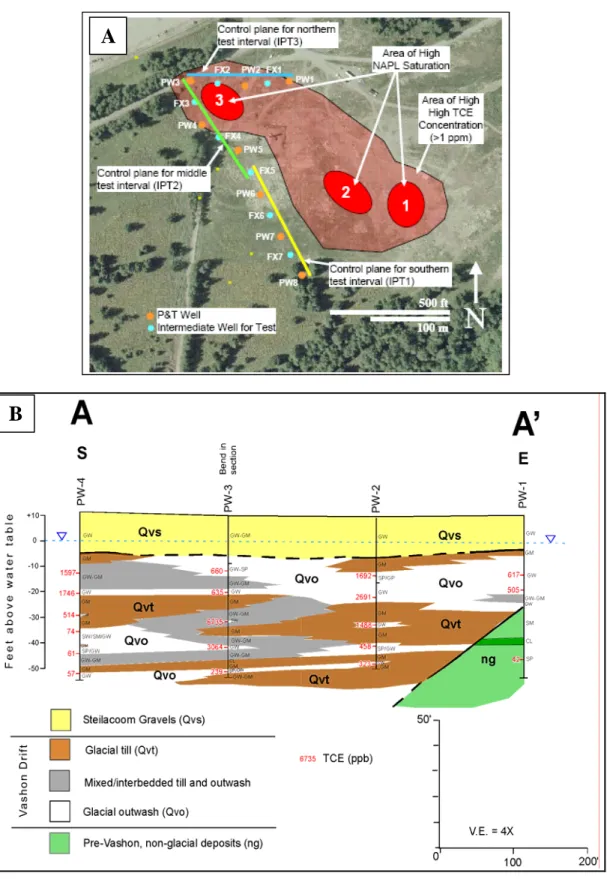
Figure 4-2. Plan View of the EGDY, Including NAPL Area 3 (A) and Cross Section of Lithological Units from a Cross Section Extending South (PW-4) to North through NAPL Area 3 (B) (Truex et al, 2006). ...24
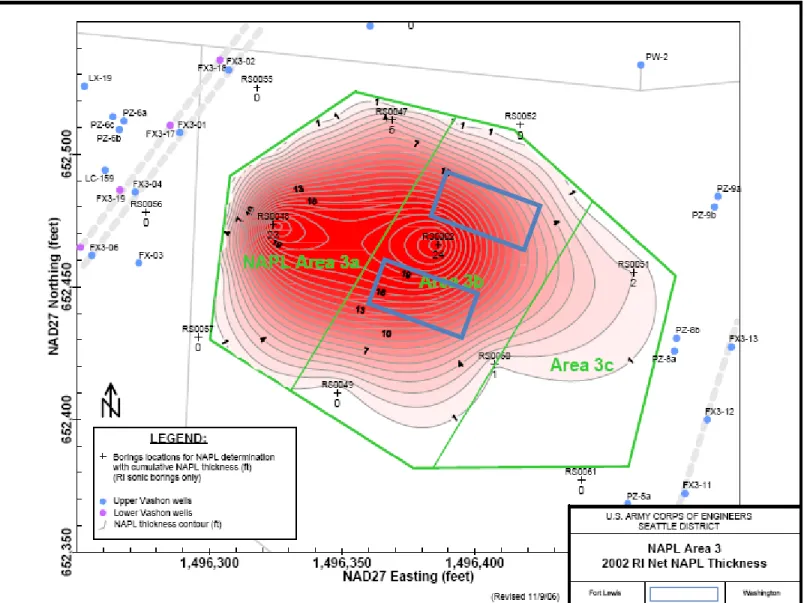
Figure 4-3. Inference of NAPL Distribution Within NAPL Area 3 Based on Data Gathered During the Phase 2 RI (2002) (USACE, 2008). Boxes Highlighted in Blue Indicate Target Treatment Cell Locations. ...26
Figure 5-1. Field Schedule for Phases 1, 2, and 3. ...31
Figure 5-2. Well Locations within Treatment Cells at Ft. Lewis EGDY. ...32
Figure 5-3. Actual Placement of Treatment Cells within NAPL Area 3 (USACE, 2008). ...33
Figure 5-4. Example PFM Well Design. ...34
Figure 5-5. Comparison of Vertical Distribution of Tracer in Monitoring Wells A and D in Treatment Cell 2 Following Bromide Injections in the Original (A and B) and New (C and D) Injection Wells. ...46
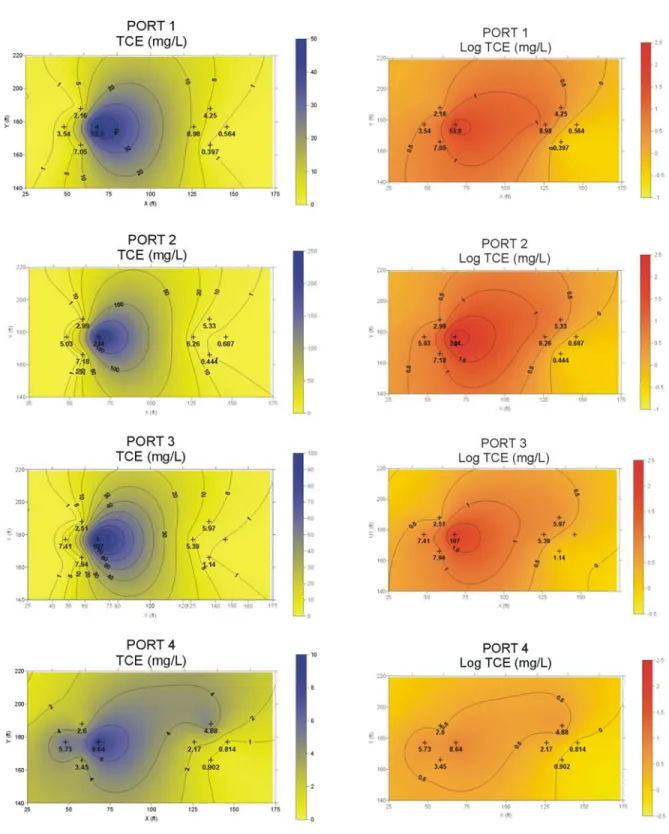
Figure 5-6. Distribution of TCE in Groundwater Within Two Treatment Cells at Four CMT Depth Intervals: 13-14 ft bgs (Port 1), 18-19 ft bgs (Port 2), 23-24 ft bgs (Port 3), and 28-29 ft bgs (Port 4) During Phase 1 Sampling. ...50
Figure 5-7. Impact of Whey Injection on pH in the Treatment Cells (Lines Represent the Mean and Error Bars Represent One Standard Deviation from the Mean). ...53
Figure 5-8. Methane Production Observed at Discrete Vertical Depths During Phase 3. ...55
Figure 5-9. Summary of Contaminant Distribution as Total TCE, cDCE, VC, and Ethene in Treatment Cells 1 and 2 Monitoring Wells A and D During Phases 2 and 3. ...57
Figure 5-10. Molar Mass Plots of TCE and Reductive Daughter Products During Phases 2 and 3 of the Demonstration at MWA in Treatment Cell 1. Vertical Lines Illustrate Samples Collected Before, During, and After a Recirculation or Injection Event. ...58
Figure 5-11. Molar Mass Plots of TCE and Reductive Daughter Products During Phases
2 and 3 of the Demonstration at MWD in Treatment Cell 1. ...59
Figure 5-12. Molar Mass Plots of TCE and Reductive Daughter Products During Phases 2 and 3 of the Demonstration at MWA in Treatment Cell 2. ...60
Figure 5-13. Molar Mass Plots of TCE and Reductive Daughter Products During Phases 2 and 3 of the Demonstration at MWD in Treatment Cell 2. ...61
Figure 5-14. PFM TCE Flux Profiles for 5 Deployment Periods. ...64
Figure 5-15. PFM DCE Flux Profiles for 5 Deployment Periods...65
Figure 5-16. PFM Darcy Velocity Profiles for 5 Deployment Periods. ...66
Figure 5-17. Relationship Between Total Average Molar Mass Flux for Each PFM Well for the Five Deployments (A) and Variability in Darcy Velocity (B). ...67
Figure 5-18. PFM DCE Flux Profiles Compared to CMT MLS Based Calculated Mass Flux Using Average Hydraulic Conductivity and Gradient in Treatment Cell 1. ...70
Figure 5-19. PFM DCE Flux Profiles Compared to CMT MLS Based Calculated Mass Flux Using Average Hydraulic Conductivity and Gradient in Treatment Cell 2. ...71
Figure 5-20. Results of CSIA, Values Represent the Mean of All Sampling Points (N=16), Except the April 2006 (N=4), Within Two Treatment Cells and Error Bars Represent One Standard Deviation. ...72
Figure 5-21. T-RFLP Response in Bacteria During Phase 3 in MW2D4. ...75
Figure 5-22. Summary of DHC qPCR Results for the 16S rRNA, bvcA, vcrA, and tceA Genes as the Mean (n=4) for Each Treatment Cell and FISH Results Targeting the 16S rRNA Gene. ...79
Figure 5-23. qPCR Results of Bioaugmentation Culture used at NAPL Area 3. ...80
Figure 5-24. Relationship Between TCE and Reductive Daughter Products and Concentrations of DHC 16S rRNA Genes. ...81
Figure 5-25. Relationship Between TCE and Reductive Daughter Products and Concentrations of DHC bvcA Genes. ...82
Figure 5-26. Relationship Between TCE and Reductive Daughter Products and Concentrations of DHC vcrA Genes. ...83
Figure 5-27. Relationship Between DHC qPCR Results and Geochemical Parameters pH (A) and Methane (B). ...84
Figure 5-28. Relationship Between TCE and Reductive Daughter Products and Concentrations
of Active DHC Cells. ...86
Figure 5-29. Response of Methanogenic Populations (order level) Using qPCR During Phase 3 Operations, Values Represent the Mean of n=4 (Port 4 of each CMT well) Sampling Points for Each Treatment Cell. ...88
Figure 5-30. Relationship Between Methanogenic Orders and DHC Concentrations Measured using qPCR in Both Treatment Cells. ...89
Figure 5-31. Response of Methanogenic Populations Using FISH During Phase 3 Operations, Values Represent the Mean of N=4 Sampling Points for Each Treatment Cell. ...90
Figure 5-32. Relationship Between Methanogenic Populations and DHC Using FISH During Phase 3 Operations, Values Represent the Mean of N=4 Sampling Points (Port 4 of Each CMT Well) for Each Treatment Cell. ...91
Figure 7-1. Additional Cost for Innovative Diagnostic Tools Included in the Monitoring Strategy Over the Base Case Conventional Monitoring Program. ...103
LIST OF TABLES
Table 1-1. Safe Drinking Water Act Maximum Contaminant Levels for Ft. Lewis EGDY Contaminants of Concern. ...4Table 2-1. Overview of Innovative Diagnostic Tools. ...6
Table 2-2. Summary of Molecular Tools Evaluated During the ER-0318 Demonstration. ...9
Table 2-3. Advantages and Limitations of Diagnostic Tools. ...14
Table 3-1. Performance Objectives for Evaluation of ISB-ARD Enhanced Mass Transfer Demonstration Using Innovative Diagnostic Tools. ...16
Table 4-1. Vashon Aquifer Properties Reported in Phase II RI Report. ...25
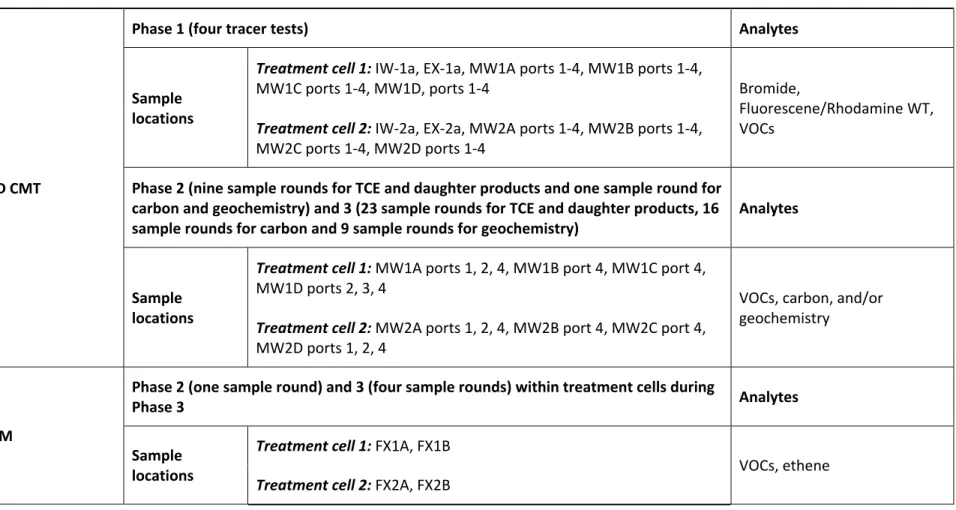
Table 5-1. Summary of Implementation of Innovative Diagnostic Tools During Demonstration Phases, Locations Where Samples Were Collected and Analytes. ...28
Table 5-2. Phase 2 Recirculation Activity Summary. ...38
Table 5-3. Phase 3 Whey Injection Summary. ...39
Table 5-4. 3-D CMT Sample Collection and Analysis Summary. ...41
Table 5-6. Molecular Targets and References for Methods. ...44
Table 5-7. Overview of Hydraulic Parameters Determined During Hydraulic Testing of the Two Demonstration Treatment Cells. ...47
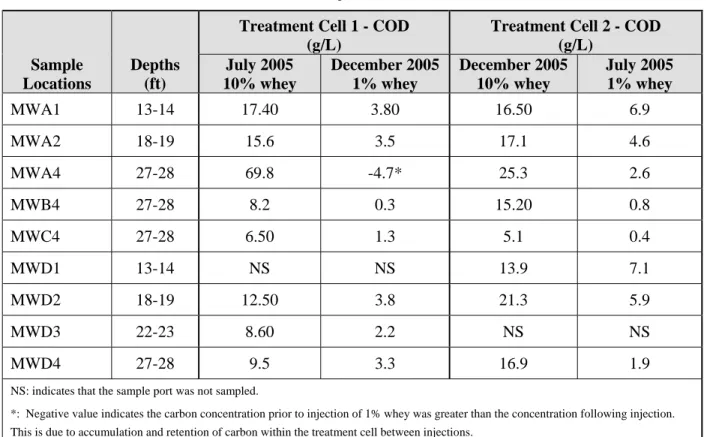
Table 5-8. Increase in COD Measured at CMT Locations Before and After Whey Injections. ....51
Table 5-9. VFA Profiles Measured at CMT Locations Before and After Whey Injections. ...52
Table 5-10. Total Average Contaminant Mass Flux for Each Flux Meter Location. ...68
Table 5-11. Summary of T-RFLP Results for Bacteria. ...76
Table 5-12. Summary of T-RFLP Results for Archaea. ...77
Table 6-1. Summary of Utility of Innovative Diagnostic Tools for Application of ISB for Chlorinated Solvent Source Zones. ...96
Table 7-1. Approach and Cost Assumptions for Conventional and Innovative Monitoring Programs. ...99
Table 7-2. Parameters Used as the Basis of the Model Used for ISB for NAPL Area 3 and Costing of Application of Innovative Diagnostic Tools. ...102
Table 7-3. Evaluation of Cost-Benefit of Innovative Diagnostic Tools in Evaluating Reduction in Mass Flux from DNAPL Source Area. ...105
Table 7-4. Evaluation of Cost-Benefit of Innovative Diagnostic Tools for Evaluating Contaminant Degradation Within and Downgradient from DNAPL Source Area. ...106
Table 7-5. Evaluation of Cost-Benefit of Innovative Diagnostic Tools in Evaluating Mass Transfer Within DNAPL Source Area. ...108
Table 7-6. Evaluation of Cost-Benefit of Innovative Diagnostic Tools in Distribution and Injection Frequency. ...110
Table 7-7. Evaluation of Cost-Benefit of Innovative Diagnostic Tools in Developing and Maintaining Contaminant-Degrading Microbial Populations. ...111
ACRONYMS
ARD anaerobic reductive dechlorination
B.E.T.™ Bioavailability Enhancement Technology™
bgs below ground surface
CERCLA Comprehensive Environmental Response, Compensation, and Liability Act CFR Code of Federal Regulations
CMT Continuous Multichannel Tubing
COD chemical oxygen demand
CSIA compound-specific stable isotope analysis
DCE dichloroethene
DHC Dehalococcoides
DNAPL dense non-aqueous phase liquid
DO dissolved oxygen
DOD Department of Defense
DOE Department of Energy
DQO data quality objective
EGDY East Gate Disposal Yard
EPA Environmental Protection Agency
ESTCP Environmental Security Technology Certification Program
GC gas chromotography
gpm gallons per minute
INL Idaho National Laboratory ISB in situ bioremediation
MLS multi-level system
MNA monitored natural attenuation
MW monitoring well NAPL non-aqueous phase liquid NPL National Priorities List ORP oxidation reduction potential PCE tetrachloroethene PCR polymerase chain reaction
PID photoionization detector
ppb parts per billion
QA quality assurance
qPCR quantitative polymerase chain reaction
SPME solid phase microextraction
TAN Test Area North
TCA 1,1,1-trichloroethane TCE trichloroethene
TDP Technology Demonstration Plan
T-RFLP terminal restriction fragment length polymorphism UIC underground injection control
USACE United States Army Corps of Engineers
UWRL Utah Water Research Laboratory
VC vinyl chloride
VFA volatile fatty acid VOA volatile organic analysis VOC volatile organic compound
WAC Waste Administrative Code
Acknowledgements
This demonstration was funded entirely by ESTCP under projects ER-0218 and ER-0318. Their thoughtful reviews of project documents and their support significantly contributed to the success of the project. Special thanks are due to Andrea Leeson and Hans Stroo of the ESTCP program in this regard. The U.S. Army Corps of Engineers Seattle District was instrumental in providing support and coordinating with the Ft. Lewis Public Works Department. From the Corps, special thanks are extended to Kira Lynch (now with EPA Region 10), Richard Smith, and Travis Shaw. From Ft. Lewis Public Works, Richard Wilson (now with the Corps, Seattle District) and James Gillie are due many thanks. The Army Environmental Center was an important partner for the downgradient flux monitoring wells, and the project team wishes to thank Ira May and Laurie Haines (US Army Environmental Command) and Mike Truex (PNNL) for their help and collaboration.
EXECUTIVE SUMMARY
BACKGROUNDIn Situ Bioremediation (ISB) has been identified as a promising treatment technology for sites containing chlorinated solvent DNAPL source areas. This technology, however, is considered passive due to the relatively long remedial timeframes associated with the limited rate at which nonaqueous contaminants dissolve or diffuse to where bacteria can degrade them. Recent advances have shown, however, that mass transfer rates from the nonaqueous phase to the aqueous phase (where contaminatns are bioavailable) can be substantially increased during bioremediation (Sorenson, 2002; Macbeth et al., 2006). Therefore, the effective evaluation of key performance metrics, such as the rate of mass transfer, the growth and distribution of microbial populations of interest, contaminant degradation efficiency, and impact to mass flux, are critical to understanding the feasibility of this technology at DNAPL sites.
Bioremediation system performance has historically been evaluated using vertically integrated point measurements of dissolved source contaminant concentrations in aquifers (e.g., to
determine changes in maximum concentrations and plume extents). A major drawback to the use of traditional groundwater monitoring with point measurements includes the method’s proven inability to determine where a majority of the contaminant mass is located and migrating due to the often spatially complex distribution of dissolved contaminants; variability of hydraulic conductivity, groundwater flow rate and direction; and variation in water level (Einarson et al., 2002; Reinhard et al., 1984; Robertson et al., 1991; Van der Kamp et al., 1994). To improve the evaluation of ISB systems at chlorinated solvent DNAPL sites, a set of innovative diagnostic tools, including 3-D sampling using multi-level systems, passive flux meters, compound-specific stable isotope analysis and molecular microbiological assays, were applied concurrently with conventional techniques at a field site contaminated with DNAPL undergoing a field pilot test to evaluate ISB (i.e., ESTCP ER-0218). ESTCP demonstration project ER-0218 evaluated
enhanced mass transfer during ISB operation at a DNAPL source zone at the Ft. Lewis East Gate Disposal Yard (EGDY) using two different whey injection strategies (North Wind, 2008).
OBJECTIVES OF THE DEMONSTRATION
The overall objective of this demonstration project was to evaluate innovative diagnostic tools for the implementation and optimization of bioremediation technology applications. The specific objectives of this demonstration project included: 1) demonstrate the effectiveness of ISB for remediation of chlorinated solvent residual DNAPL contamination using conventional and innovative diagnostic tools, 2) demonstrate efficacy of alternate diagnostic tools for evaluating performance and enhancing implementation of bioremediation in chlorinated solvent source areas, and 3) compare these innovative methods with conventional diagnostic tools that are currently used for assessing bioremediation performance.
DEMONSTRATION RESULTS
3-D multi-level systems provided critical information in understanding heterogeneity in the
hydraulic system including the presence of vertical gradients, and preferential flow paths within the subsurface at the Ft. Lewis EGDY. In addition, the data provided by the system was key in optimizing the injection design to effectively encompass target horizontal and vertical
contaminant treatment areas resulting in degradation of trichloroethene (TCE) in the areas receiving whey. The use of the 3-D CMT system also allowed for the evaluation of variability in contaminant mass vertically within the treatment areas, and to assess response in contaminant concentrations used to determine mass transfer effects. This provided important information in evaluating mass transfer of residual contaminant mass to the aqueous phase, and evaluating efficiency of reductive dechlorination within the vertical treatment interval. The 3-D CMT system was also used to evaluate mass flux, although there was significant uncertainty in these estimates due to highly variable groundwater flow velocity at the Ft. Lewis site.
The 3-D CMT system was more expensive to install, operate and maintain than the traditional 2-D system, nearly doubling the cost of the monitoring program. However, much of the
increased cost was saved in the ability to effectively optimize the ISB system to achieve design objectives in a much shorter timeframe than would be possible with conventional techniques. In addition, monitoring programs can be optimized to include only those parameters necessary for the site (i.e. at Ft. Lewis 3-D monitoring of geochemical parameters was unnecessary), and to reduce analytes and frequency of sampling during different phases of bioremediation operations.
Passive Flux Meters (PFM) provided useful information regarding the variability in
groundwater velocity, and contaminant mass flux over the horizontal and vertical extent of the treatment areas. Therefore, PFM was likely a more accurate measure of mass flux compared to estimates assuming constant groundwater flow velocities as this was highly variable at Ft. Lewis. Contaminant response to the different ISB injection strategies, however, was more difficult to assess using PFMs at Ft. Lewis because increases in contaminant mass flux were concomitant to increases in groundwater velocity. Therefore, mass transfer effects due to the ISB injection strategies could not be evaluated using PFMs within the residual source area.
PFM analysis required the installation of additional wells, sampling and analytical costs to the monitoring program, increasing the performance monitoring costs by nearly 50%. Cost savings could potentially be realized, however, by optimizing the ISB operation to target specific zones within the contaminant area that are discharging the greatest mass of contaminants.
Compounds-specific stable isotope analysis (CSIA) was useful in verifying biological
degradation of contaminants, although the method detection limits for vinyl chloride (VC) and ethene were higher than standard analytical techniques. Therefore, at Ft. Lewis, CSIA did not provide information regarding the loss in mass balance once cis- dichloroethene (DCE) was converted to VC and ethene. Had the monitoring been sustained until more of the DCE was transformed to VC and ethane, it is likely CSIA would have been able to show the mass balance in spite of the fact that groundwater concentrations would not have shown it.
Molecular tools provided important information on the microbial community, and
contaminant-degrading populations, such as Dehalococcoides, in particular. Quantitative polymerase chain reaction (qPCR) was determined to be the most cost-effective molecular tool for evaluating the presence, growth and activity of contaminant-degrading populations. Additional analytical costs were offset by providing information as to wither to bioaugment and the ability to optimize the ISB system to achieve optimal environmental conditions for contaminant-degrading populations.
1.0
INTRODUCTION
This report provides the demonstration cost and performance results for the application of innovative diagnostic tools for performance evaluation of in situ bioremediation (ISB) of a chlorinated solvent source area at the Fort Lewis East Gate Disposal Yard (EGDY). This Environmental Security Technology Certification Program (ESTCP) project, ER-0318, was conducted concurrently with ESTCP project ER-0218, which was designed to demonstrate enhanced mass transfer of chlorinated solvent dense non-aqueous phase liquid (DNAPL) using two different biostimulation strategies. The addition of certain electron donors to groundwater has been shown to enhance the mass transfer of DNAPL to the water phase by increasing contaminant bioavailability, and thus increase rates and extent of biological degradation via anaerobic reductive dechlorination (ARD). Improvement of diagnostic tools for quantifying and optimizing bioremediation performance, including ARD and enhanced mass transfer, would greatly augment the application of bioremediation at chlorinated solvent DNAPL sites.
Under ESTCP project ER-0218, two hydraulically isolated treatment cells, each consisting of a network of monitoring wells, an injection well, and an extraction well, were installed at the EGDY non-aqueous phase liquid (NAPL) Area 3. These treatment cells were monitored with various innovative diagnostic tools under ESTCP project ER-0318. The treatment cells were located on the fringe of the DNAPL source area (Treatment cell 1) and within the DNAPL source area (Treatment cell 2). Two injection strategies, or Scenarios, were applied to each treatment cell. Scenario 1 consisted of low concentration (1% w/w) whey powder injections and Scenario 2 consisted of high concentration (10% w/w) whey powder injections. For Treatment cell 1, Scenario 2 was applied within the cell for approximately four months followed by four months of Scenario 1, low concentration (1%) whey powder. For Treatment cell 2, Scenario 1 was applied first for four months followed by Scenario 2, high concentration (10%) whey powder, for an additional four months.
Application of the innovative diagnostic tools during the ER-0218 evaluation of the two injection strategies allowed for evaluation of key parameters critical to the success of enhanced
bioremediation in a DNAPL source area. These parameters include distribution of
bioremediation amendments and their effects throughout the desired treatment area, enhanced mass transfer and contaminant mass removal measurements, and extent of enrichment of contaminant-degrading microorganisms. In particular, the tools evaluated included:
• 3-D sampling using a multi-level sampling systems – determined the benefits (and costs) of using a 3-D sampling system to evaluate treatment performance using conventional analytical parameters, such as distribution of amendments; redox parameters; biological activity indicators; and distribution, attenuation, and mass flux of chlorinated
contaminants. The three-dimensional analysis was also used to determine system hydraulic heterogeneity and vertical groundwater gradients.
• Passive flux meter technology - determined changes in contaminant mass flux in groundwater over time during bioremediation application at discrete locations.
• Compound-specific stable isotope analysis (CSIA) - evaluated degradation mechanisms for contaminants in order to verify biological degradation of contaminants.
• Molecular tools - evaluated presence and time changes of microbial community, including contaminant-degrading organisms, and other key organisms that impact reductive
dechlorination during treatment.
The data obtained using these diagnostic tools were compared with the data that would have been obtained using standard practices in order to determine utility and cost-effectiveness of the methods. This cost and performance report details each of the innovative diagnostic tools and describes how they were implemented during the ER-0218 demonstration at Fort Lewis EGDY NAPL Area 3. The background information, objectives of the demonstration, and regulatory drivers are described in the remainder of Section 1. The specific innovative tools are described in Section 2, as well as the advantages and limitations of each technology, while the performance objectives are detailed in Section 3. The demonstration site is described in Section 4 and the overall test design is presented in Section 5. Finally, the performance assessment, cost assessment, implementation issues, and references are presented in Sections 6, 7, 8, and 9, respectively.
1.1 BACKGROUND
Chlorinated solvents comprise two of the top four of the most common groundwater
contaminants at hazardous waste sites in the United States (www.atsdr.cdc.gov/cep/07cep). In the Agency for Toxic Substances and Disease Registry report on Substances Most Frequently
Found in Completed Exposure Pathways (CEPs) at Hazardous Waste Sites 2007, seven of the
top 20 contaminants most frequently found in completed exposure pathways at hazardous waste sites on the National Priorities List (NPL) were chlorinated solvents and their intrinsic
degradation products, including two of the top four (Pankow and Cherry 1996). Of particular significance is the identification of trichloroethene (TCE) and tetrachloroethene (PCE) as the third and fourth most common contaminants at NPL sites. Not surprisingly, the Department of Defense (DOD) has identified chlorinated solvents at nearly 50% of its 3,212 contaminated waste sites and TCE appears as a major groundwater contaminant at 35% of all DOD sites (EPA 2004), and many of these sites contain chlorinated solvents as dense non-aqueous liquids (DNAPL).
The longevity of chlorinated solvents is thought to be attributable to their widespread use, their hydrophobic nature, and to their relatively oxidized states that prevent them from serving as electron donors for microorganisms. Due to their hydrophobic nature, chlorinated solvents can exist as DNAPLs at many sites. DNAPLs are hydrophobic liquids with a density greater than water. Pertinent to their longevity is the fact that the solubility of the common chlorinated solvents (PCE, TCE, 1,1,1-trichloroethane [TCA], and carbon tetrachloride) ranges from approximately 200 to 1,400 mg/L at 25oC (Sale 1998). These relatively low solubilities play a significant role in limiting mass transfer to the aqueous phase once the solvents contaminate groundwater. Interphase mass transfer (dissolution) of a solvent NAPL into groundwater is governed by the difference between the aqueous solubility of the compound and the actual concentration in groundwater. (Sale [1998] provides an excellent discussion of fundamental interphase mass transfer from DNAPLs.) At typical groundwater velocities, the aqueous concentration of the solvent in the immediate vicinity of the groundwater-NAPL interface approaches the solubility within the first few centimeters of flow along the interface
groundwater flows across a pool of DNAPL (or through an area of residual saturation) several meters long in the direction of flow, mass transfer into the aqueous phase is insignificant along all but the first few centimeters of the flow path. Therefore, groundwater concentrations of chlorinated solvents rarely measure greater than 10% of their solubility despite the presence of large quantities of DNAPL. The result is that chlorinated solvents persist in groundwater for many decades, or perhaps even centuries.
Due to the physical characteristics of DNAPL plumes, the relative recalcitrance of chlorinated solvents, and often complex subsurface heterogeneity, remediation of contaminated groundwater is often considered technically or economically impracticable. Many sites have historically resorted to pump and treat or other containment technologies, which can have significant operations and maintenance costs due to the longevity of the DNAPL sources. In attempting to address the overwhelming costs associated with DNAPL remediation, the Strategic
Environmental Research and Development Program has noted (http://www.serdp.com/02SON/CUSON-02-02.html) that:
“…the operations and maintenance of engineered containment systems has become a large proportion of DOD environmental budgets, and these costs may continue long into the future. Technologies designed to remove subsurface sources of contaminants, particularly DNAPLs, have received tremendous recent interest. Several approaches have been developed and tested, including thermal treatment technologies, chemical oxidation, bioremediation, and enhanced physical removal (using cosolvents or surfactants, for example).” [emphasis added]
Bioremediation has been identified as a promising treatment technology for chlorinated solvent contamination due to relatively low capital costs and minimal generation of secondary waste streams. Bioremediation is non-hazardous to workers and the environment, destroys
contaminants in situ, is relatively low maintenance, and minimizes disturbance of the site.
Bioremediation, with respect to chlorinated solvent DNAPL source area remediation, however, is limited by the rate at which nonaqueous contaminants dissolve or diffuse to where bacteria can degrade them. Recent advances have shown, however, that mass transfer rates of chlorinated solvents from the nonaqueous phase to the aqueous phase (where they are bioavailable) can be substantially increased during bioremediation (Sorenson, 2002).
Bioremediation system performance has historically been evaluated using point measurements of dissolved source contaminant concentrations in aquifers (e.g., to determine changes in maximum concentrations and plume extents). A major drawback to the use of traditional groundwater monitoring with point measurements includes the method’s proven inability to determine where a majority of the contaminant mass is located and migrating due to the often spatially complex distribution of dissolved contaminants, variability of groundwater flow rate and direction, and variation in water level (Einarson et al., 2002; Reinhard et al., 1984; Robertson et al., 1991; Van der Kamp et al., 1994).
To improve the evaluation of ISB systems at chlorinated solvent contaminated sites, a set of diagnostic tools was applied concurrently with conventional techniques at a field site
contaminated with TCE DNAPL undergoing a field pilot test to evaluate ISB (i.e., ESTCP ER-0218). The specific diagnostic tools evaluated in this project included:
• 3-D sampling,
• Passive flux meters,
• CSIA, and
• Molecular tools.
1.2 OBJECTIVES OF THE DEMONSTRATION
The overall objective of this demonstration project was to evaluate innovative tools for the implementation and optimization of bioremediation technology applications. The specific objectives of this demonstration project included:
1. Demonstrate the effectiveness of ISB for remediation of chlorinated solvent residual DNAPL contamination using conventional and innovative diagnostic tools,
2. Demonstrate efficacy of alternate diagnostic tools for evaluating performance and enhancing implementation of bioremediation in chlorinated solvent source areas, and 3. Compare these innovative methods with conventional diagnostic tools that are currently
used for assessing bioremediation performance.
The scope of the demonstration project included working with University of California Berkeley, University of Florida, Malcolm-Pirnie, and the United States Army Corps of Engineers
(USACE) Seattle District to conduct monitoring of bioremediation performance during the ER-0218 demonstration at Fort Lewis EGDY.
1.3 REGULATORY DRIVERS
Solubilities of PCE, TCE, TCA, and carbon tetrachloride range from about 200 to 1,400 mg/L at 25oC (Sale 1998). These solubilities exceed Federal Safe Drinking Water Act maximum contaminant levels (see Table 1-1) by five to six orders of magnitude. The persistence of chlorinated solvents in groundwater, their prevalence, and their solubilities far in excess of health-based levels drive the need for cost-effective remediation technologies.
Table 1-1. Safe Drinking Water Act Maximum Contaminant Levels for Ft. Lewis EGDY Contaminants of Concern. Compound Regulatory Limit (µg/L1) TCE 5 cis-DCE 70 trans-DCE 100 Vinyl Chloride (VC) 2
2.0
TECHNOLOGY
The technologies evaluated under ESTCP project ER-0318 comprise a suite of innovative diagnostic tools applied to ISB of DNAPL source zones. The technologies include 3-D sampling using multi-level sampling wells, CSIA, flux meter analysis, and molecular tools. Detailed descriptions and applications of these tools are described below.
2.1 TECHNOLOGY DESCRIPTION
Enhanced bioremediation for chlorinated solvents has largely focused on anaerobic reductive dechlorination, also termed chlororespiration or halorespiration, a process where anaerobic microorganisms use chlorinated solvents as metabolic electron acceptors for energy generation (Maymó-Gatell et al., 1997; Holliger et al., 1999; Loffler et al., 1999). Bioremediation of chlorinated solvents via reductive dechlorination has been well documented (e.g., Ballapragada et al., 1997; Bouwer and McCarty, 1983; Carr and Hughes, 1998; deBruin et al., 1992; DiStefano et al., 1991 & 1992; Fathepure and Boyd, 1988; Fennell et al., 1997; Freedman and Gossett, 1989; Parsons et al., 1984; Vogel and McCarty, 1985). Reductive dechlorination is a strictly anaerobic process and results in the sequential reduction of highly oxidized contaminants, such as TCE, to daughter products, such as cis-DCE, vinyl chloride (VC), and ethene.
Several microorganisms capable of chlororespiration have been isolated from contaminated and pristine sites. Theses populations are generally strict anaerobes and can be separated into two groups. The first are those capable of reductive dechlorination of TCE to cis-DCE which can be classified into a number of phylogenetic groups including Desulfuromonas sp. strain BB1,
Desulfuromonas chloroethenica, Sulfurospirillum multivorans, Dehalobacter restrictus strains
PER-K23A and TEA, Enterobacter sp. Strain MS1 and Desulfitobaccterium sp. strain PCE-S (Holliger 1999). Hydrogen is generally an electron donor for these organisms, except for
Desulfuromonas sp. strain BB1 and Desulfuromonas chlorethenica, which require acetate to
support reductive dechlorination of TCE. The second group is capable of complete reductive dechlorination of TCE to ethene, and only includes the obligatory hydrogenotrophic genus
Dehalococcoides (Maymo-Gatell et al., 1999; Cupples et al., 2003; He et al., 2003; Sung et al.,
2006). In addition, the presence of this genus has been linked to the ability to perform complete dechlorination at chloroethene-contaminated field sites (Hendrickson 2002). Therefore,
bioremediation strategies increasingly target Dehalococcoides for growth and activity through biostimulation or bioaugmentation (Major et al., 2002; Macbeth et al., 2004; Rahm et al., 2006). Historically, enhanced bioremediation of chlorinated solvents has focused on remediation in dissolved phase plumes. The potential for using bioremediation in chlorinated solvent source zones is now gaining attention due to recent laboratory (Carr et al., 2000; Cope and Hughes, 2001; Yang and McCarty, 2000) and field (Song et al., ,2002; Macbeth et al., 2006) studies. The high potential for cost-effective bioremediation of chlorinated solvent DNAPL source areas has been limited by an incomplete understanding of how best to design, monitor, and predict the performance of bioremediation approaches. Therefore, there is an obvious need for effective diagnostic procedures that allow for rapid and appropriate optimization of field operations leading to more cost-effective cleanup.
This project was conducted concurrently with ESTCP project ER-0218, that demonstrated enhanced mass transfer during bioremediation of NAPL Area 3 at the Fort Lewis EGDY. This project leveraged funds from the ER-0218 project to evaluate technology performance by comparing the use of innovative diagnostic tools to more conventional monitoring techniques during this demonstration. An overview of the innovative diagnostic tools, their application, and the data obtained during the ER-0218 demonstration and used for evaluation in this study are presented in Table 2-1.
Table 2-1. Overview of Innovative Diagnostic Tools.
Diagnostic Tool Data Obtained
3-Dimensional Sampling using Multiple-Level Sampling Wells
• Differentiate vertical aquifer zones to determine any preferential flowpaths.
• Evaluate contaminant mass distribution and flux through discrete vertical zones.
• Evaluate distribution of bioremediation amendment both horizontally and vertically within target treatment areas and determine effect on geochemistry, and aqueous contaminant and daughter product concentrations.
Passive Flux Meters • Measure cumulative water and contaminant mass fluxes in groundwater.
• Vertically differentiate zones within the aquifer to determine any preferential flowpaths where significant contaminant mass flux occurs.
CSIA • Monitor the carbon isotope ratios of TCE and its biodegradation byproducts to differentiate between the effects of groundwater transport, dissolution of DNAPL at the source, and enhanced bioremediation.
• Confirm biological reductive dechlorination.
Molecular Tools • Assess impacts of bioremediation amendment on the biological community.
• Determine presence and enrichment of contaminant-degrading microorganisms after treatment.
• Monitor microbial community dynamics and correlate population shifts of key organisms with dechlorination performance.
2.1.1 3-D Sampling of Multiple Level Wells
For the ER-0318 demonstration, the Solinst® continuous multichannel tubing (CMT) multilevel system was used for four monitoring wells within each of the two treatment cells (see Figure 2-1 for diagram of CMT well). CMT wells were selected because they are relatively easy to install and are low-cost for shallow targeted depth intervals. The depth interval of interest at the Ft. Lewis EGDY was 10 to 30 ft below ground surface (bgs). The utility of the CMT wells was evaluated for parameters such as: 1) vertical differentiation of preferential flowpaths within the aquifer, 2) delineation of the spatial distribution of contaminants, and byproducts within the vertical intervals, 3) evaluation of contaminant mass flux within the target vertical intervals before and during treatment, and 4) evaluation of the distribution of whey powder throughout the target vertical interval and geochemical changes due to the treatment process (i.e., redox, pH, and fermentation).
2.1.2 Compound-Specific Stable Isotope Analysis
Compound-specific stable isotope analysis (CSIA) is an analytical technique used to generate an isotopic signature or ratio for different compounds. Physical processes, such as dilution, sorption, and volatilization, have very little impact on the isotopic signature of a particular compound (i.e., TCE in groundwater). Other processes, however (i.e., biotic and abiotic degradation), have significant impacts on the isotopic ratios of compounds. During ARD of TCE, mass balance between parent compounds (i.e., TCE) and reductive daughter products (i.e., ethene) is often not observed in groundwater samples, which leads to concerns regarding the actual fate of the contaminants. CSIA represents a powerful tool for monitoring ISB of chlorinated solvents that can specifically evaluate the mechanisms for contaminant concentration reductions (Hunkeler et al., 1999; Sherwood-Lollar et al., 2001; Slater et al., 2001; Song et al., 2002).
Bioremediation is based on the transformation of organic compounds by biological processes, and these processes can cause significant shifts in the ratio of 13C to 12C in both the reactants and products. By comparing the isotopic signature of the parent compound to the degradation
byproducts, changes in concentrations can be attributed to physical or degradative processes (Conrad et al., 1997; Landmeyer et al., 1996; Revesz et al., 1995). During bioremediation, microorganisms preferentially utilize molecules with 12C as opposed to 13C, which causes the ratio of 13C/ 12C to increase, or become “heavy”. In addition, the degradative daughter product (i.e., cDCE) is initially predominantly 12C and therefore, the 13C/ 12C is a relatively low value, or “light”. As the parent compound becomes depleted, however, microorganisms begin using 13C, and the daughter product becomes heavier. Once the isotopic signature of the daughter product approaches that of the parent compound, completed degradation (or mass balance) is deduced. Therefore, CSIA of the metabolic byproducts was used to determine the dominant biochemical pathways within specific degradation zones before, during, and after the bioremediation
2.1.3 Molecular Tools
Advancements in molecular biology have made it possible to measure the impact of
biostimulation on the resident microbial community directly at a contaminated site. Several techniques were evaluated during this demonstration in order to understand their application and utility. The molecular techniques evaluated can be divided into two categories: 1) polymerase-chain reaction (PCR)-based techniques, and 2) florescent microscopy-based techniques. These molecular techniques differ in the way that samples are handled and analyzed and the
microorganisms that they target. A summary of the molecular techniques employed as part of this demonstration is presented in Table 2-2.
Table 2-2. Summary of Molecular Tools Evaluated During the ER-0318 Demonstration.
Analysis and Target Specificity Data Use
PCR-based techniques
T-RFLP- Bacteria Kingdom Community diversity profiling. T-RFLP- Archaea Kingdom Community diversity profiling. qPCR- Archaea Kingdom Abundance of Archaea. qPCR-Bacteria Kingdom Abundance of Bacteria. qPCR- 16S rRNA
Dehalococcoides Genera
Presence and abundance of the only known organism capable of degrading TCE to ethene.
qPCR- vcrA Species
Presence and abundance of a gene related to the degradation of PCE to ethene in an energy yielding reaction.
qPCR- tceA Species
Presence and abundance of a gene related to the degradation of PCE to vinyl chloride in an energy yielding reaction.
qPCR- bvcA Species
Presence and abundance of a gene related to the degradation of cis-DCE to ethene in an energy yielding reaction.
qPCR- Methanosarcinales Order
Presence and abundance of this order - contains acetoclastic methanogens with optimal
temperature ranges from 25 to 60°C.
qPCR- Methanococcales Order
Presence and abundance of this order - contains hydrogenotrophic methanogens with optimal temperature regimes from 35 to 85°C.
Table 2-2. (continued).
Analysis and Target Specificity Data Use
qPCR-Methanobacteriales Order
Presence and abundance of this order - contains hydrogenotrophic methanogens with optimal temperature ranges from 37 to 88°C.
qPCR-Methanomicrobiales Order
Presence and abundance of this order - contains hydrogenotrophic methanogens with optimal temperatures from 15 to 40°C.
Fluorescent-microscopy-based tools
FISH- Dehalococcoides Genus Presence and activity of the only known organism capable of degrading TCE to ethene.
FISH-Methanobacteriaceae Family Presence and activity of this family. FISH-Methanococcales Order Presence and activity of this order. FISH-Methanomicrobiales Order Presence and activity of this family. FISH- Methanosarcina Genus Presence and activity of this genus. FISH-Methanosarcinaceae Family Presence and activity of this family. FISH-Methanosarcinaceae
including Methanosaeta Order Presence and activity of this order.
FISH- Methanosaeta Genus Presence and activity of this family. FISH: Fluorescence in situ hybridization
qPCR: Quantitative polymerase chain reactions
T-RFLP: Terminal restriction fragment length polymorphism
Recently, investigators have applied PCR-based molecular techniques to investigate aspects of communities performing reductive dechlorination during bioremediation (Ellis et al., 2000; Flynn et al., 2000; Harkness et al., 1999; Loffler et al., 2000; Macbeth et al., 2004; Rahm et al., 2006; Richardson et al., 2002). By far, the most-wide spread application is the use of quantitative polymerase chain reaction (qPCR) techniques to evaluate populations of Dehalococcoides
species and the reductase genes tceA, vcrA, and bvcA (Muller et al., 2004; Holmes et al. 2006; Lee et al., 2006; Rahm et al., 2006; Ritalahti et al., 2006; Sung et al., 2006; Lee et al., 2008). In addition, qPCR techniques have also been developed for methanogenic populations of interest (Yu et al., 2005), although these techniques have not been previously applied to a reductively dechlorinating groundwater community.
Two PCR-based techniques were evaluated as part of this demonstration: terminal restriction fragment length polymorphism (T-RFLP) and qPCR. T-RFLP is a technique that generates microbial community chromatographs that illustrate the number of amplified targets (inferred to be species in the application evaluated) and relative abundance of target bacterial and archaeal population(s). The T-RFLP target used to evaluate the populations of interest was the 16S rRNA gene. The 16S rRNA gene codes for the RNA portion of the small subunit of the bacterial ribosome, which is used to make proteins in microbial biosynthesis. A great deal of research has been performed using this gene because it is highly conserved between all microorganisms; however, variability in the DNA sequence of the gene has been shown to be directly related to similarity between different microbial populations, or how closely those populations are related. A great deal of research has been conducted to characterize and catalogue all known Bacteria
and Archaea 16S rDNA sequences into comprehensive databases. 16S rRNA gene-based
molecular techniques can be used to tentatively identify individual members of a microbial community, and to assess the relative diversity and abundance of populations within the community. Because of the relatively low cost and ease of application, T-RFLP has become widely used for assessing microbial diversity. When combined with the sequencing of clone libraries (Dunbar et al., 2000; Knight et al., 1999; Lueders and Friedrich, 2000, Richardson et al., 2002; Macbeth et al. 2004), this technique allows the dominant members of a community to be qualitatively tracked over time.
At the Idaho National Laboratory (INL) site, Macbeth et al. (2004) found that the biostimulated methanogenic community was dominated by acetate consumers (acetoclastic) rather than hydrogen consumers (hydrogenotrophic), suggesting that methanogenic competition with the dechlorinators for hydrogen (as suggested by Smatlak et al., 1996) may have been limited at this site. In addition to community-level T-RFLP profiling, methanogenic populations were also evaluated using qPCR techniques (Yu et al., 2005), also targeting the 16S rRNA gene, with specificity to four orders (see Table 2-2) of methanogens. Individual qPCR runs were conducted for each of the specific targets in order to quantify the relative abundance of each within the samples.
For specific analysis of known dechlorinators, most notably those related to Dehalococcoides, specific primers can be used during qPCR. A recent study conducted with a wide range of field samples suggests that the presence of these organisms highly corresponds with the ability to stimulate complete dechlorination of PCE and TCE to ethene (Hendrickson et al., 2002). Recent approaches include the use of Dehalococcoides - specific primers with quantitative PCR in order to quantify concentrations of these organisms in environmental samples and correlate with observed dehalogenation activity (Chauhan et al., 2002; Holmes et al., 2006; Lee et al., 2006; Ritalahti et al., 2006; Lee et al., 2008).
In addition to PCR - based techniques, whole cell assays using fluorescence in situ hybridization (FISH) molecular probes were also conducted to target a similar suite of organisms as the qPCR assays, based on availability of appropriate FISH probes. FISH probes targeting similar groups of microorganisms (including Dehalococcoides and methanogenic populations) to qPCR were evaluated (Table 2-2). FISH was used to evaluate the distribution of active Dehalococcoides and methanogenic populations, and to evaluate expression activity, based on RNA, of microbes in situ (Amann 1995, Del Nery et al., 2008). Single cells were probed with fluorescently labeled oligonucleotides that hybridize to ribosomal RNA (rRNA). rRNA was the targeted molecule
because of its prevalence in all cells, which leads to a high signal intensity. In addition, different fluorescent dyes were used at the same time, in order to detect several different species (or sub-species) of microbes (i.e., Bacteria, Archaea, Dehalococcoides) at any given time (Raskin et al., 1994).
The application of these molecular tools could be extremely useful for predicting bioremediation performance prior to enhancement and for optimizing injection strategies. For instance, if the dehalogenating organisms are not initially present and are not enriched during initial
biostimulation, it would suggest that bioaugmentation should be considered. While these molecular tools are interesting and show promise, the number of DNAPL source sites at which they have been applied to monitor field-scale bioremediation is relatively small. Further work with molecular tools applied in conjunction with other diagnostic tools is required to determine their efficacy for enhancing the cost effectiveness of bioremediation. For the purposes of this study, T-RFLP, qPCR, and FISH were used to track microbial community changes in response to whey powder injections in the two treatment cells within a DNAPL-source area. In addition, methanogens were monitored by qPCR to determine the dominance of acetate or hydrogen consumers. In all cases, the relationship between community structure and overall
bioremediation performance was evaluated in order to determine the utility of these methods as predictive and performance assessment tools.
2.1.4 Mass Flux Analysis
A key element for assessing in-situ remediation of source areas by any technology is developing an understanding of the impact of the remediation on mass flux. For ISB, a key performance criterion is to increase contaminant mass transfer from the non-aqueous phase to the aqueous phase to maximize biodegradation rates while minimizing migration of contaminants out of the treatment area. Therefore, mass flux evaluation is important as a means of assessing both enhanced mass transfer and for evaluating impact of source area treatment on contaminants migrating downgradient of the source area. Mass flux was evaluated in this study using two different tools: 1) groundwater sampling and analysis in 3-D and 2) passive flux meters (PFM). The two methods differed fundamentally in the way that data are collected. The 3-D approach involved the collection of a groundwater samples at discrete points in time using a Solinst CMT multi-level system, and the flux meters involved the collection of cumulative, time-averaged data over longer periods of time in screened monitoring wells with “flux meters.” The PFM is a self-contained permeable unit that is inserted into a well or boring to intercept (but not retain) groundwater flow. Internal to this meter is a matrix of hydrophobic and hydrophilic permeable sorbents that retain dissolved organic and inorganic contaminants, and a conservative tracer. Contaminant masses retained are combined with calculated cumulative fluid flux from residual resident tracer masses to calculate time-averaged contaminant mass fluxes. Mass flux
measurements calculated using this cumulative, time-averaged approach were compared to those using the three-dimensional, discrete time approach.
2.2 ADVANTAGES AND LIMITATION OF THE TECHNOLOGY
There are significant advantages of bioremediation as an in situ treatment technology that will be assessed using both conventional and innovative diagnostic techniques. The advantages of
bioremediation over other in situ treatment technologies include low risk to human health and the environment during implementation, low secondary waste generation, minimal impacts during operations, and relatively low cost. Additional potential advantages include:
• Potential for complete source cleanup using one technology, without requirement for
separate polishing technologies—Source removal technologies do not remove all of the
NAPL present and often rely on polishing technologies, including ISB and monitored natural attenuation (MNA), to achieve remedial goals. ISB-ARD integrates source removal and polishing, thereby facilitating attainment of cleanup goals by reducing the need for further infrastructure, treatability studies, modification of site conditions, bioaugmentation, etc. that may be required to implement a polishing technology following source removal.
• Flexibility of implementation—ISB-ARD is easily scaled to the size of the site, with
commensurate cost savings relative to more capital- and energy-intensive technologies. Given the minimal surface infrastructure requirements, the technology is also readily implemented around and under existing structures, and is not disruptive to most
commercial or residential property uses. Electron donors can also be selected for enhanced dissolution properties, dechlorination properties, slow versus fast-release properties, etc., for specific applications.
Challenges for this technology include complex lithology, complex residual source mass
architecture, unfavorable geochemistry (i.e., low or high pH or high concentrations of competing electron acceptors), insufficient contaminant-degrading biomass, and complex hydraulics (i.e., fracture flow).
The use of innovative diagnostic tools may significantly improve the ability to evaluate, design, and implement a bioremediation system cost-effectively in a residual source area. Technologies currently used to monitor bioremediation systems are generally applied via a network of wells sampled in one vertical horizon each for contaminants and degradation products, including volatile organic compounds (VOCs), dissolved gasses, redox indicators, biological activity indicators, and bioremediation amendments. This approach provides a broad understanding of the system in one dimension. The use of innovative technologies such as CSIA, 3-D sampling strategies, PFM, and molecular microbial tools could provide significant advantages for implementing bioremediation. Table 2-3 lists advantages and limitations of each of the diagnostic tools evaluated.
Table 2-3. Advantages and Limitations of Diagnostic Tools.
Technology Advantages Limitations
3-D Multi-level Sampling
• Determine vertical characteristics of aquifer, including gradients
• Identifies high permeability zones and areas of predominant
contaminant flux
• Monitors vertical distribution of electron donor relative to contaminants
• Requires the collection of more samples at any single well, increasing both analytical and data analysis costs
Passive Flux Meter
• Provides simultaneous measurement of both water and contaminant fluxes
• Provides long-term monitoring that generates time integrated estimates of both groundwater and
contaminant flux
• Requires additional wells
• Relatively specialized application
CSIA
• Distinguishes between biological and abiotic degradation of contaminants
• Determines mass balance even when concentrations of degradation products in groundwater do not account for all mass
• Relatively specialized and requires detailed knowledge of chemistry
• Increases monitoring costs
Molecular Tools
• Evaluates microbial community response to treatment
• Evaluates response in growth and activity of key microbial populations, including dehalogenating and
methanogenic populations, to treatment
• Determines if site is biologically limited and requires bioaugmentation
• Relatively specialized and requires detailed knowledge of microbiology
3.0
PERFORMANCE OBJECTIVES
Successful bioremediation, as applied to chlorinated solvent source areas in groundwater, realizes many of the benefits of more expensive and hazardous technologies, while retaining its benefits as a low cost, in situ technology. With this in mind, detailed performance objectives have been developed for the implementation, evaluation, and comparison of diagnostic tools for evaluating performance and optimization of ISB in chlorinated solvent source areas. The
following represent key bioremediation design and implementation objectives that innovative and conventional diagnostic tools are used to assess:
1. Reduce mass flux emanating from the DNAPL source area.
2. Reduce concentrations of contaminants of concern in groundwater via transformation to innocuous end products within and downgradient from the DNAPL source area.
3. Increase the rate of contaminant mass removal to achieve closure criteria within an acceptable remedial timeframe.
4. Effectively distribute bioremediation amendments within target treatment area. 5. Minimize the frequency of amendment injections.
6. Develop and/or maintain an environment conducive to microbial growth and activity of contaminant-degrading microbial populations.
Table 3-1 illustrates performance objectives, data requirements for conventional and innovative tools, success criteria, and results pertaining to the Ft. Lewis ER-0318 study. The Demonstration was conducted in three phases:
Phase 1: Hydraulic characterization of the treatment cells. This phase of testing established
hydrogeologic baseline parameters, including tracer measurements using the multi-level CMT wells to evaluate vertical transport and preferential flowpaths. This phase also evaluated baseline contaminant distribution in groundwater within the two treatment cells.
Phase 2: Baseline testing, during which all diagnostic tools (except FISH) were evaluated to
assess the baseline conditions in each treatment cell prior to whey injection. This phase of testing established the contaminant flux baseline parameters using both analytical samples of the CMT wells and PFM. Baseline CSIA values were also determined pre-whey injection, as were the PCR-based molecular tools.
Phase 3: Biostimulation and enhanced mass transfer demonstration, during which all analytical
parameters were monitored under two whey injection Scenarios for comparison as well as comparison to Phase 2 conditions. The same analytes described for Phase 2 were analyzed during Phase 3, and FISH analyses were added to evaluate activity of different populations of the microbial community.
Table 3-1 relates the performance objectives to the operational phases of the enhanced bioremediation application.
Table 3-1. Performance Objectives for Evaluation of ISB-ARD Enhanced Mass Transfer Demonstration Using Innovative Diagnostic Tools. Performance Objective Data Requirements Conventional Tool Data Requirements
Innovative Tool Success Criteria Results
Qualitative
Demonstrate that new diagnostic tools improve the implementation and optimization of enhanced ISB.
Pre-, during- and post-treatment single point sampling wells with analyses of groundwater parameters such as VOCs, VFAs, COD, sulfate, nitrate, soluble iron, pH, conductivity, and ORP.
Pre-, during- and post-treatment multiple level sampling wells, PFMs, CSIA, and molecular tools. Demonstrate that innovative tools resulted in efficiencies in the design, operation and/or maintenance of the treatment system to result in more cost-effective treatment.
Innovative tools provided valuable information that improved the design and lead to the successful implementation of ISB in the Ft. Lewis EGDY DNAPL source area.
Quantitative Phase 1: Determine hydraulic parameters for injection design including, groundwater gradient, velocity, direction, and residence time as a result of injection.
Pre-treatment, single point sampling wells: conduct pumping and tracer tests.
Pre-treatment multi-level sampling wells: conduct pumping and tracer tests.
Determination of realistic hydraulic parameters that can be used to design an effective injection strategy.
2-D sampling: accurate hydraulic parameters could be measured horizontally using single depth sampling
3-D vertically discrete sampling: necessary to understand
predominant vertical flow paths. The high groundwater flow rates of aerobic groundwater into the treatment cells suggested that high carbon loading would be required to maintain reducing conditions. 3-D results, however, suggested that there was significant variability in groundwater velocity within different vertical aquifer zones, and that injection into the
low-permeability units could increase retention within the treatment cells.
Table 3-1. (continued).
Performance Objective
Data Requirements Conventional Tool
Data Requirements
Innovative Tool Success Criteria Results
Phase 1: Determine vertical gradient and preferential flowpaths.
NA Pre-treatment
multi-level sampling wells: conduct pumping and tracer tests.
Assessment of any preferential vertical flow paths, as indicated by high tracer transport in discrete vertical zones.
3-D sampling: was necessary to document significant vertical gradient that resulted in distribution of tracer to depths below the target treatment area. Installation of new injection wells was necessary to inject into desired vertical interval successfully.
Phase 2: Determine contaminant distribution and mass flux pre-treatment.
Pre-treatment, single point sampling wells: collect 3 sampling rounds for contaminants (PCE, TCE, DCE isomers, VC) and degradation daughter products (ethene).
Pre-treatment Multi-level sampling wells: collect 3 sampling rounds for
contaminants (PCE, TCE, DCE isomers, VC) and degradation daughter products (ethene). Pre-Treatment flux meter deployment. Successful determination of contaminant mass distribution to define the target treatment area and determine baseline mass flux within two treatment cells.
2-D sampling: indicated
substantially different contaminant mass concentrations within the areal extent of NAPL Area 3, with treatment cell 1 containing substantially less mass that treatment cell 2.
3-D sampling: indicated
substantially different contaminant mass distribution both horizontally and vertically.
PFM: confirmed that mass flux in treatment cell 2 was substantially greater than treatment cell 1. Phase 2: Determine
geochemistry and carbon concentration within treatment cells pre-treatment.
Pre-treatment, single point sampling wells: collect one round of sampling for carbon, alkalinity and redox and 3 rounds for pH.
Pre-treatment Multi-level sampling wells: collect one round of sampling for carbon, alkalinity and redox and 3 rounds for pH.
Successful determination of geochemical condition and requirements for carbon loading for injection design.
2-D and 3-D sampling: The
treatment cells were predominantly aerobic, with the exception of one location in treatment cell 2, which was mildly iron- to
sulfate-reducing. Very low levels of carbon were also observed. There was little difference between 2-D and 3-D results.