FOX RIVER
2017 BAT MONITORING ALONG THE
I-90 CORRIDOR
Prepared by:
Tara C. Hohoff, Matthew L. Niemiller, and Michael J. Dreslik ILLINOIS STATE TOLL HIGHWAY AUTHORITY
January 30, 2018
Illinois Natural History Survey Technical Report 2018(4):1–8 Unrestricted
2017 BAT MONITORING ALONG THE I-90 CORRIDOR
Tara C. Hohoff1, Matthew L. Niemiller2, and Michael J. Dreslik1 1 Illinois Natural History Survey, Champaign, IL, USA
2 The University of Alabama, Huntsville, AL, USA
EXECUTIVE SUMMARY
• Passively recorded 28 nights at each of three survey location within Trout Park. • Analyzed recordings using 2 auto-classification software programs, Sonobat and
Kaleidoscope
• Kaleidoscope identified 7,570 files as bat passes • Sonobat identified 9,938 files as bat passes
• Identified 4 bat species: Big Brown, Eastern Red, Hoary, and Silver-haired Bats • Kaleidoscope indicated the presence of the Tri-colored Bat in the spring and
summer survey periods
• Bat populations may be helped by:
▷ Increasing the vegetation near the I-90 overpass to add more connectivity
between the 2 forest patches
▷ Reducing understory clutter from invasive shrubs in the more heavily wooded
areas to increase the availability of foraging habitat
▷ Increasing available roosting habitat by maintaining snags and/or erecting bat
boxes Email Addresses Tara C. Hohoff thohoff2@illinois.edu Matthew L. Niemiller matthew.niemiller@uah.edu Michael J. Dreslik dreslik@illinois.edu Fund Title ITHA RR-15-4228
Banner Grant Code
D6262
Descriptive Title
2017 Bat Monitoring along the I-90 Corridor
January 30, 2018
INTRODUCTION
Situated along the eastern riparian edge of the Fox River in Kane County, Trout Park and Fox River Forested Fen Nature Preserve represent a unique ecological habitat in Illinois. The forest patch was once contiguous but became intersected by the construction of I-90 in the 1950s. The region is of high biological interest and significance due to the unique, rare plants (Eastern White Cedar) and aquatic invertebrate community. Given the proximity to the Fox River and nearby urbanization, Trout Park and Fox River Forested Fen Nature Preserve provide an interesting survey site for bat monitoring as bat species will differ-entially use urbanized areas (Gehrt and Chelsvig, 2004; Gallo et al., 2017). Bat monitoring is of critical impor-tance due to North American population declines driven primarily by White-nose Syndrome (Frick et al., 2010a; O’Shea et al., 2016). Other factors influencing declines in bat populations also include wind turbine development (Frick et al., 2017), pollution (Secord et al., 2015), loss of habitat, increased use of pesticides (Schmidt et al.,
2000), and climate change (Frick et al., 2010b). Acoustic monitoring of bat species during both migration seasons and the maternity season can provide a comprehensive understanding of how bats use habitat during different life stages.
MATERIALS AND METHODS Field Deployment
We used Wildlife Acoustics Song Meter SM3BAT bioacoustics recorders with SMM-U1 ultrasonic micro-phones (Wildlife Acoustics, Inc., Maynard, MA) to record free-flying bat echolocation calls at 3 sites (Plate 1; Site 3 was moved to the trail during survey period 2 due to summer flooding). We surveyed for bat species during spring, summer, and fall to sample each season bats are active in northern Illinois. Recorders passively recorded echolocation calls from sunset to sunrise at a sampling frequency of 256kHz, minimum frequency of
16kHz, maximum frequency of 192kHz, trigger window maximum of 15 sec, trigger ratio of 10%, and trigger level as automatic. We mounted recorders to trees with minimal overhanging vegetation using cable locks. We affixed ultrasonic microphones with the associated directional horn and windscreen, then positioned them at approximately 2–3 m above the ground and directed toward flyways or waterbodies where bats typically forage (Plate 2).
Call Analysis
Acoustic files collected from the field were auto-classi-fied using 2 software programs, Sonobat (Sonobat Inc., Arcata, CA) and Kaleidoscope Pro (Wildlife Acoustics, Inc., Maynard, MA). Noise files were scrubbed from the dataset using Sonobat on the medium setting. We used the default settings in Sonobat to batch process the data for classification including acceptable call quality of 0.80, sequence decision threshold of 0.90, and the maximum number of calls to consider as 16. We processed data through Kaleidoscope Version 4.2.0 using the Bats of North America 4.2.0 classifier on the “0 Balanced (Neutral)” setting (approved by USFWS, 2017). The northern Illinois species included were the Big Brown (Eptesicus fuscus), Eastern Red (Lasiurus borealis),
Hoary (Lasiurus cinereus), Silver-haired (Lasionycteris Plate 1. Bat acoustic survey locations at Trout Park and the Fox River Forested Fen Nature Preserve in Kane County, Illinois. Due to seasonal flooding, some units were moved.
Plate 2. Deployment sites for ultrasonic recorders at Trout Park and the Fox River Forested Fen Nature Preserve–a) Site 1 along the creek in a large wooded patch; b.) Site 2 along the Fox River c.); Site 3 along forest opening.
noctivagans), Little Brown (Myotis lucifugus), Northern Long-eared (Myotis septentrionalis), Indiana (Myotis sodalis), Evening (Nycticeius humeralis), and Tricolored (Perimyotis subflavus) Bat. Sonobat classifies files to a “LUSO” species category, which includes files indetermi-nate from the Little Brown or Indiana Bat. The Kaleido-scope software program does not include such a determi-nation. We used files of undetermined bat echolocation calls (not high enough quality for species identification) only for the calculation of bat activity. The activity metric estimates bat use patterns because we cannot assume each file is from an individual (Fenton et al., 1973; Kunz and Brock, 1975). We used >0.90 likelihood of presence as a threshold to determine species occupancy of the site.
RESULTS
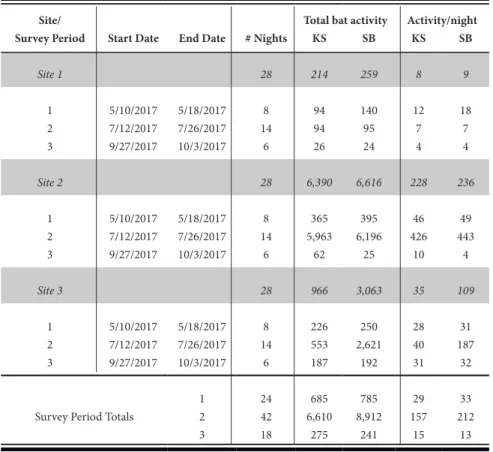
We passively recorded 28 nights at each survey location within Trout Park. Classification by Kaleidoscope
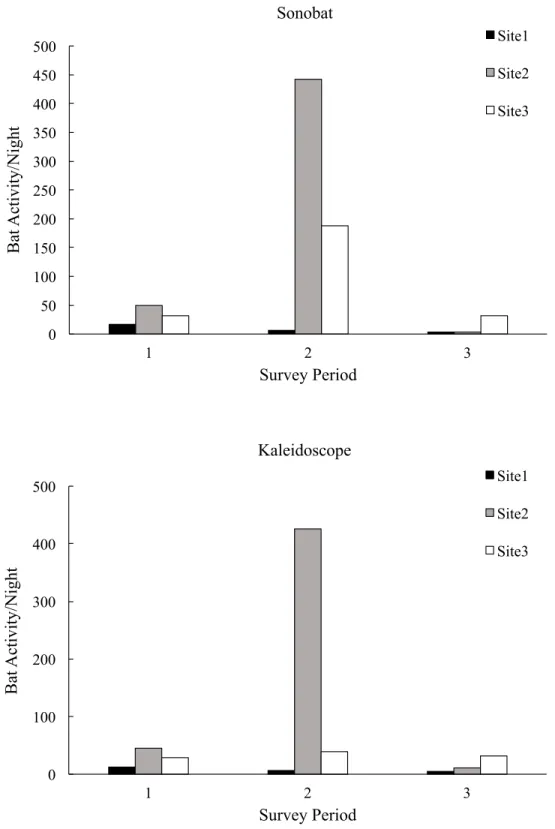
iden-tified 7,570 files as bat passes, and Sonobat ideniden-tified 9,938 files as bat passes (Table 1). The greatest bat activity occurred at Site 2 along the Fox River, with the most activity occurring in the second survey period during late July (Fig. 1). Sites 1 and 3 had low bat activity per night but also had more clutter in the recording space with the survey sites located in forested habitat (Weller and Zabel, 2002).
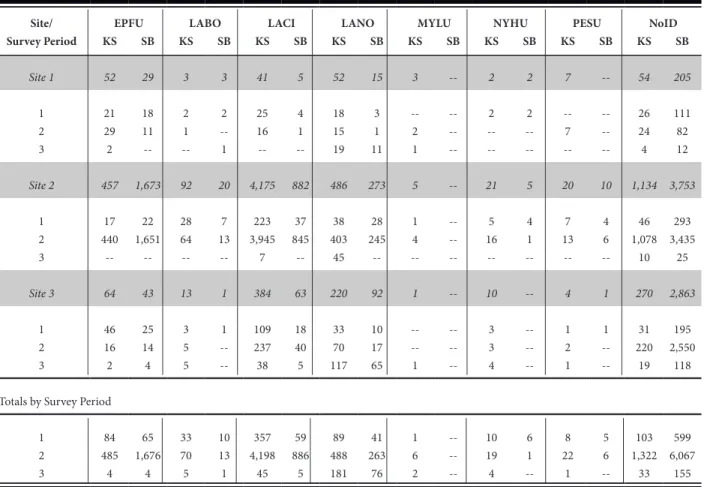
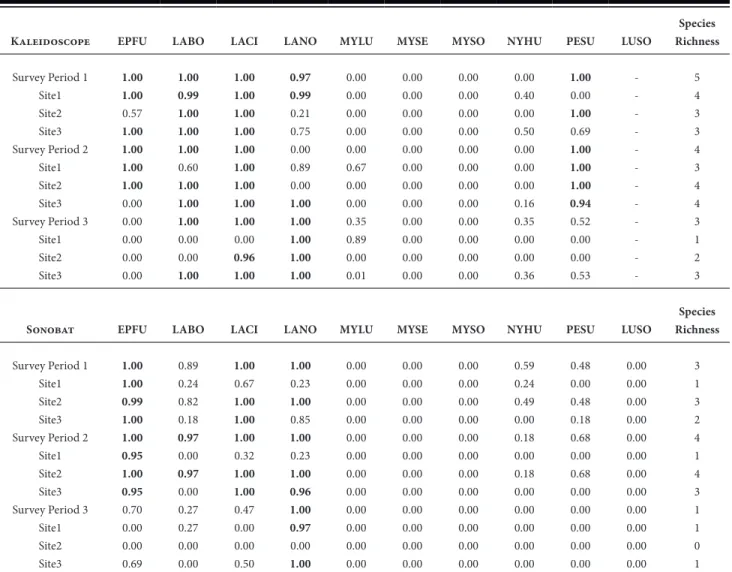
Most species-classified detections (Table 2) by Kalei-doscope were the Hoary Bat with 4,600 files, whereas Sonobat identified most calls as Big Brown bats (1,745). Sonobat and Kaleidoscope agreed (Table 3) on 4 species as present— the Big Brown, Eastern Red, Hoary, and Silver-haired Bat. Kaleidoscope also identified the Tri-colored Bat as present at Trout Park in the 1st and 2nd survey periods. Neither program identified Indiana bats or Northern long-eared Bats at Trout Park.
Table 1. Survey dates and bat activity levels recorded using SM3BAT Wildlife Acoustics
ultrasonic recorders at Trout Park, Kane County, Illinois. KS=Kaleidoscope; SB=Sonobat.
Site/ Total bat activity Activity/night
Survey Period Start Date End Date # Nights KS SB KS SB
Site 1 28 214 259 8 9 1 2 3 5/10/2017 7/12/2017 9/27/2017 5/18/2017 7/26/2017 10/3/2017 8 14 6 94 94 26 140 95 24 12 7 4 18 7 4 Site 2 28 6,390 6,616 228 236 1 2 3 5/10/2017 7/12/2017 9/27/2017 5/18/2017 7/26/2017 10/3/2017 8 14 6 365 5,963 62 395 6,196 25 46 426 10 49 443 4 Site 3 28 966 3,063 35 109 1 2 3 5/10/2017 7/12/2017 9/27/2017 5/18/2017 7/26/2017 10/3/2017 8 14 6 226 553 187 250 2,621 192 28 40 31 31 187 32
Survey Period Totals
1 2 3 24 42 18 685 6,610 275 785 8,912 241 29 157 15 33 212 13
Figure 1. Bat activity levels (bat passes/night) by survey period recorded using SM3BAT Wildlife Acoustics ultrasonic recorders based on auto-classification software from 3 sites at Trout Park, Kane County, Illinois.
0 50 100 150 200 250 300 350 400 450 500 1 2 3
Bat Activity/Night
Survey Period
Sonobat
Site1 Site2 Site3 0 100 200 300 400 500 1 2 3Bat Activity/Night
Survey Period
Kaleidoscope
Site1 Site2 Site3Table 2. Number of files identified to species level by auto-classification software, Kaleidoscope (KS) and Sonobat (SB), at Trout Park
in Kane County, Illinois. Files recorded using SM3BAT Wildlife Acoustics ultrasonic recorders during 3 survey periods: spring (1), summer (2), and fall (3). Species identifications: Big Brown (EPFU), Eastern Red (LABO), Hoary (LACI), Silver-haired (LANO), Little Brown (MYLU), Northern Long-eared (MYSE), Indiana (MYSO), Evening (NYHU), Tricolored (PESU) bat, species group (LUSO) including files indistinguishable between Little Brown and Indiana bats, and NoID for files that are determined bat passes but cannot be classified to species.
Site/ EPFU LABO LACI LANO MYLU NYHU PESU NoID
Survey Period KS SB KS SB KS SB KS SB KS SB KS SB KS SB KS SB Site 1 52 29 3 3 41 5 52 15 3 -- 2 2 7 -- 54 205 1 2 3 21 29 2 18 11 --2 1 --2 --1 25 16 --4 1 --18 15 19 3 1 11 --2 1 --2 --2 --7 --26 24 4 111 82 12 Site 2 457 1,673 92 20 4,175 882 486 273 5 -- 21 5 20 10 1,134 3,753 1 2 3 17 440 --22 1,651 --28 64 --7 13 --223 3,945 7 37 845 --38 403 45 28 245 --1 4 --5 16 --4 1 --7 13 --4 6 --46 1,078 10 293 3,435 25 Site 3 64 43 13 1 384 63 220 92 1 -- 10 -- 4 1 270 2,863 1 2 3 46 16 2 25 14 4 3 5 5 1 --109 237 38 18 40 5 33 70 117 10 17 65 --1 --3 3 4 --1 2 1 1 --31 220 19 195 2,550 118 Totals by Survey Period
1 2 3 84 485 4 65 1,676 4 33 70 5 10 13 1 357 4,198 45 59 886 5 89 488 181 41 263 76 1 6 2 --10 19 4 6 1 --8 22 1 5 6 --103 1,322 33 599 6,067 155
Table 3. Likelihood estimates of species presence by auto classification software where values closer to 1 indicate higher likelihood of
occupancy. Values in bold identify values where likelihood > 0.90 and species is assumed to occupy that site or survey period.
Kaleidoscope EPFU LABO LACI LANO MYLU MYSE MYSO NYHU PESU LUSO
Species Richness Survey Period 1 Site1 Site2 Site3 Survey Period 2 Site1 Site2 Site3 Survey Period 3 Site1 Site2 Site3 1.00 1.00 0.57 1.00 1.00 1.00 1.00 0.00 0.00 0.00 0.00 0.00 1.00 0.99 1.00 1.00 1.00 0.60 1.00 1.00 1.00 0.00 0.00 1.00 1.00 1.00 1.00 1.00 1.00 1.00 1.00 1.00 1.00 0.00 0.96 1.00 0.97 0.99 0.21 0.75 0.00 0.89 0.00 1.00 1.00 1.00 1.00 1.00 0.00 0.00 0.00 0.00 0.00 0.67 0.00 0.00 0.35 0.89 0.00 0.01 0.00 0.00 0.00 0.00 0.00 0.00 0.00 0.00 0.00 0.00 0.00 0.00 0.00 0.00 0.00 0.00 0.00 0.00 0.00 0.00 0.00 0.00 0.00 0.00 0.00 0.40 0.00 0.50 0.00 0.00 0.00 0.16 0.35 0.00 0.00 0.36 1.00 0.00 1.00 0.69 1.00 1.00 1.00 0.94 0.52 0.00 0.00 0.53 -5 4 3 3 4 3 4 4 3 1 2 3
Sonobat EPFU LABO LACI LANO MYLU MYSE MYSO NYHU PESU LUSO
Species Richness Survey Period 1 Site1 Site2 Site3 Survey Period 2 Site1 Site2 Site3 Survey Period 3 Site1 Site2 Site3 1.00 1.00 0.99 1.00 1.00 0.95 1.00 0.95 0.70 0.00 0.00 0.69 0.89 0.24 0.82 0.18 0.97 0.00 0.97 0.00 0.27 0.27 0.00 0.00 1.00 0.67 1.00 1.00 1.00 0.32 1.00 1.00 0.47 0.00 0.00 0.50 1.00 0.23 1.00 0.85 1.00 0.23 1.00 0.96 1.00 0.97 0.00 1.00 0.00 0.00 0.00 0.00 0.00 0.00 0.00 0.00 0.00 0.00 0.00 0.00 0.00 0.00 0.00 0.00 0.00 0.00 0.00 0.00 0.00 0.00 0.00 0.00 0.00 0.00 0.00 0.00 0.00 0.00 0.00 0.00 0.00 0.00 0.00 0.00 0.59 0.24 0.49 0.00 0.18 0.00 0.18 0.00 0.00 0.00 0.00 0.00 0.48 0.00 0.48 0.18 0.68 0.00 0.68 0.00 0.00 0.00 0.00 0.00 0.00 0.00 0.00 0.00 0.00 0.00 0.00 0.00 0.00 0.00 0.00 0.00 3 1 3 2 4 1 4 3 1 1 0 1
0 1 2 3 4 5 6 1 2 3
Species Richness (# of Species)
Survey Period
Kaleidoscope Sonobat
Figure 2. Species richness by an auto-classification software program and survey period for the 3 sites surveyed using SM3BAT Wildlife Acoustics ultrasonic detectors. Survey periods correspond to seasons spring (1), summer (2), and fall (3).
CONCLUSIONS
The activity patterns at Trout Park suggest bats mainly use the site during the summer maternity season and rarely during the migration seasons, although species richness remained consistent from Survey Period 1 to 2 (Fig. 2). The prevalence of Big Brown Bats at Trout Park was expected because they typically select roosts in urban areas and forage in nearby forest patches and fields (Everette et al., 2001; Duchamp et al., 2004). There is also evidence Big Brown Bats may be resistant to White-nose Syndrome (Frank et al., 2014; Pettit and O’Keefe, 2017), a fungal pathogen causing population declines in many eastern Myotis species (Blehert et al., 2009; Frick et al., 2010). High detections of Hoary Bats is consistent with expectation because they have a larger body size, making them less maneuverable and more likely to forage in open or edge habitats (Furlonger et al., 1987; Morris et al., 2010; Hofmann, 2013) like along the Fox River. There were no detections of listed bat species, the Northern Long-eared Bat or Indiana Bat, at Trout Park.
Species diversity at the site is low considering there were no Myotis species present. The location of Trout Park near the leading western edge of heavy urbanization may influence the presence of some bat species. Gehrt and Chelsvig (2004) reported Myotis species abundance increased with urbanization, whereas a recent study by Gallo et al. (2017) indicated Myotis species to be less likely in urban areas.
Some improvements to the site to increase bat occu-pancy would be to increase the vegetation near the I-90 overpass to add more connectivity between the 2 forest patches (Smith and Gehrt, 2010; Bennett and Zurcher, 2013; Lintott et al., 2015). Reducing understory clutter from invasive shrubs in the more heavily wooded areas may increase the availability of foraging habitat (Smith and Gehrt, 2010). Finally, increasing available roosting habitat by maintaining snags, erecting bat boxes, or both on the site may increase bat species occupancy (Moretto and Francis, 2017).
ACKNOWLEDGEMENTS
Funding for this project was provided by the Illinois Toll Highway Authority (ISTHA). We thank B. Wagner for his assistance with all aspects of this project. We thank C. Warwick for providing technical editorial comments on the drafts and J. Mui for the design and layout of the report. All surveys and research were conducted under a University of Illinois Approved IACUC Protocol (16074), Illinois Endangered and Threatened Species Permit (15-008), and US Fish and Wildlife Service Permit (TE182436-7).
LITERATURE CITED
Bennett, V.J., and A.A. Zurcher. 2013. When corridors collide: road-related disturbance in commuting bats. Journal of Wildlife Management 77(1): 93–101.
Blehert, D.S., A.C. Hicks, M. Behr, C.U. Meteyer, B.M. Berlowski-Zier, E.L. Buckles, J.T. Coleman, et al. 2009. Bat White-nose Syndrome: an emerging fungal pathogen? Science 323(5911):227.
Duchamp, J.E., D.W. Sparks, and J.O. Whitaker, Jr. 2004. Foraging-habitat selection by bats at an urban-rural interface: comparison between a successful and a less successful species. Canadian Journal of Zoology 82(7):1157–64. Everette, A.L., T.J. O’Shea, L.E. Ellison, L.A. Stone, and J.L.
McCance. 2001. Bat use of a high-plains urban wildlife refuge. Wildlife Society Bulletin 29(3):967–73.
Feldhamer, G.A., J.E. Hofmann, T.C. Carter, and J.A. Kath. 2015. Bats of Illinois. Indiana State University Center for Bat Research, Outreach, and Conservation., Terre Haute. 84 pp. Fenton, M.B., S.L. Jacobson, and R.N. Stone. 2011 An automatic
ultrasonic sensing system for monitoring the activity of some bats. Canadian Journal of Zoology 51(2):291–99.
Frank, C.L., A. Michalski, A.A. Mcdonough, and M. Rahimian, R.J. Rudd, C. Herzog. 2014. The resistance of a North American bat species (Eptesicus fuscus) to White-nose Syndrome (WNS). PLoS ONE 9(12):1–15.
Frick, W.F., E.F. Baerwald, J.F. Pollock, R.M.R. Barclay, J.A. Szymanski, T.J. Weller, A.L. Russell, S.C. Loeb, R.A. Medellin, and L.P. McGuire. 2017. Fatalities at wind turbines may threaten population viability of a migratory bat. Biological Conservation 209(2017):172–77.
Frick, W.F., J.F. Pollock, A.C. Hicks, K.E. Langwig, D.S. Reynolds, G.G. Turner, C.M. Butchkoski, and T.H. Kunz. 2010a. An emerging disease causes regional population collapse of a common North American bat species. Science 329(5992):679–82.
Frick, W.F., D.S. Reynolds, and T.H. Kunz. 2010b. Influence of climate and reproductive timing on demography of Little
Brown Myotis Myotis lucifugus. Journal of Animal Ecology 79(1):128–36.
Furlonger, C.L., H.J. Dewar, and M.B. Fenton. 1987. Habitat use by foraging insectivorous bats. Canadian Journal of Zoology 65(2):284–88.
Gallo, T., E.W. Lehrer, M. Fidino, R.J. Kilgour, P.J. Wolff, and S. Magle. 2017. Need for multiscale planning for conservation of urban bats. Conservation Biology [in press].
Gehrt, S.D. and J.E. Chelsvig. 2004. Species-specific patterns of bat activity in an urban landscape. Ecological Applications 14(2):625–635.
Hofmann, J.E. 2013. Field manual of Illinois mammals. University of Illinois, Urbana-Champaign. 358 pp. Kunz, T.H., and C.E. Brock. 1975. A comparison of mist nets
and ultrasonic detectors for monitoring flight activity of bats. Journal of Mammalogy 56(4):907–11.
Lintott, P.R., Bunnefeld, N., and K.J. Park. 2015. Opportunities for improving the foraging potential of urban waterways for bats. Biological Conservation 191:224–233.
Moretto, L., and C.M. Francis. 2017. What factors limit bat abundance and diversity in temperate, North American urban environments? Journal of Urban Ecology 3(1):1–9. Morris, A.D., D.A. Miller, and M.C. Kalcounis-Rueppell.
2010. Use of forest edges by bats in a managed pine forest landscape. Journal of Wildlife Management 74(1):26–34. O’Shea, T.J., P.M. Cryan, D.T.S. Hayman, R.K. Plowright, and
D.G. Streicker. 2016. Multiple mortality events in bats: a global review. Mammal Review 46(3):175–90.
Pettit, J.L., and J.M. O’Keefe. 2017. Impacts of White-nose Syndrome observed during long-term monitoring of a midwestern bat community. Journal of Fish and Wildlife Management 8(1):69–78.
Schmidt, A., V. Brack, R. Rommé, K. Tyrell, and A. Gehrt. 2000. Bioaccumulation of pesticides in bats from Missouri. Pages 8–21 in Pesticides and Wildlife, J.J. Johnson, ed.. American Chemical Society.
Secord, A.L., K.A. Patnode, C. Carter, E. Redman, D.J. Gefell, A.R. Major, and D.W. Sparks. 2015. Contaminants of emerging concern in bats from the northeastern United States. Archives of Environmental Contamination and Toxicology 69(4):411–21.
Smith, D.A., and S.D. Gehrt. 2010. Bat responses to woodland restoration within urban fragments. Restoration Ecology 18(6):914–923. USFWS. 2017. Kaleidoscope 4.2.0 subsequent test on
expanded data. Available at: https://www.fws.gov/ midwest/endangered/mammals/inba/surveys/pdf/ USGSTestReport11KPro4_2_0ExpandedData.pdf Weller, T.J., and C.J. Zabel. 2002. Variation in bat detections
due to detector orientation in a forest Wildlife Society Bulletin 30(3):922–930.