Application of SWAN
þ
ADCIRC to tide-surge and wave simulation in
Gulf of Maine during Patriot
'
s Day storm
Dong-mei Xie
a, Qing-ping Zou
a,*
, John W. Cannon
ba
Department of Civil and Environmental Engineering, University of Maine, Orono ME 04469, USA
b
National Oceanic and Atmospheric Administration, National Weather Service, Gray ME 04039, USA
Received 23 June 2015; accepted 12 November 2015 Available online 21 February 2016
Abstract
The southern coast of the Gulf of Maine in the United States is prone to flooding caused by nor'easters. A state-of-the-art fully-coupled model, the Simulating WAves Nearshore (SWAN) model with unstructured grids and the ADvanced CIRCulation (ADCIRC) model, was used to study the hydrodynamic response in the Gulf of Maine during the Patriot's Day storm of 2007, a notable example of nor'easters in this area. The model predictions agree well with the observed tide-surges and waves during this storm event. Waves and circulation in the Gulf of Maine were analyzed. The Georges Bank plays an important role in dissipating wave energy through the bottom friction when waves propagate over the bank from offshore to the inner gulf due to its shallow bathymetry. Wave energy dissipation results in decreasing sig-nificant wave height (SWH) in the cross-bank direction and wave radiation stress gradient, which in turn induces changes in currents. While the tidal currents are dominant over the Georges Bank and in the Bay of Fundy, the residual currents generated by the meteorological forcing and waves are significant over the Georges Bank and in the coastal area and can reach 0.3 m/s and 0.2 m/s, respectively. In the vicinity of the coast, the longshore current generated by the surface wind stress and wave radiation stress acting parallel to the coastline is inversely proportional to the water depth and will eventually be limited by the bottom friction. The storm surge level reaches 0.8 m along the western periphery of the Gulf of Maine while the wave set-up due to radiation stress variation reaches 0.2 m. Therefore, it is significant to coastal flooding.
©2016 Hohai University. Production and hosting by Elsevier B.V. This is an open access article under the CC BY-NC-ND license (http:// creativecommons.org/licenses/by-nc-nd/4.0/).
Keywords:Nor'easter; SWAN; ADCIRC; Gulf of Maine; Patriot's Day storm; Tide-surge; Wave; Coastal flooding
1. Introduction
Coastal flooding along the southern coast surrounding the Gulf of Maine is mainly caused by the combination of elevated water levels and waves during nor'easters. Nor'easters, so
named for the direction from which their winds blow over land, are the cyclonic storms battering the upper east coast of the United States from October through April (Davis and Dolan, 1993). In the past 30 years, more than 20 notable nor'easters swept through the Gulf of Maine and caused extensive infrastructural damage, beach erosion, and some-times loss of lives (https://en.wikipedia.org/w/index.php? title¼Nor%27easter&oldid¼696766147).
The prediction of storm surges, waves, and coastal flooding in the area remains a challenging issue, which can be addressed from two aspects. First, the nonlinear interaction between tides, storm surges, and waves needs to be resolved with the presence of complex bathymetry and configuration of the coastline. Waves and currents interact with each other
H O S T E D BY Available online atwww.sciencedirect.com
Water Science and Engineering
journal homepage:http://www.waterjournal.cn
This work was supported by the project funded by the Maine Sea Grant and National Oceanic and Atmospheric Administration (Grant No. NA10OAR4170072), and the Ensemble Estimation of Flood Risk in a Changing Climate (EFRaCC) project funded by the British Council under its Global Innovation Initiative.
*Corresponding author.
E-mail address:qingping.zou@maine.edu(Qing-ping Zou). Peer review under responsibility of Hohai University. http://dx.doi.org/10.1016/j.wse.2016.02.003
1674-2370/© 2016 Hohai University. Production and hosting by Elsevier B.V. This is an open access article under the CC BY-NC-ND license (http:// creativecommons.org/licenses/by-nc-nd/4.0/).
wave action in contributing to coastal damage. Large battering waves can cause significant damage by means of wave run-up and overtopping/splash-over despite water levels below the flood stage.
Numerical studies of hydrodynamic processes in the Gulf of Maine during extratropical storm events fall into three categories: (1) wave models (Sucsy et al., 1993; Panchang et al., 2008), (2) tide-surge models (Bernier and Thompson, 2007), and (3) coupled circulation and wave models (Beardsley et al., 2013; Chen et al., 2013). Only recently, fully-coupled circulation and wave models have been used to assess the contribution of wave-current inter-action to coastal flooding (Beardsley et al., 2013; Chen et al., 2013). WhileBeardsley et al. (2013)andChen et al. (2013) mainly focused on model skill assessment, and the contri-bution of waves to circulation and surface elevation was not examined in detail.
In this study, a state-of-the-art fully-coupled model, the Simulating Waves Nearshore (SWAN) model with unstruc-tured grids and the ADvanced CIRCulation (ADCIRC) model, was used to investigate tide-surges and waves in the Gulf of Maine during the Patriot's Day storm. The paper is organized as follows: Section2briefly introduces the Gulf of Maine. In the third section, the Patriot's Day storm is described. A brief introduction of the numerical models, the ADCIRC and SWAN models, is presented in section 4. The following two sections describe model setup, results, and discussion. Finally, conclusions are provided.
2. Gulf of Maine
The Gulf of Maine (Fig. 1) is a mid-latitude marginal sea located on the North American continental shelf. It is bounded by the New England coastlines of the United States and Atlantic Canada. The seaward flank of the Gulf of Maine is the Georges Bank, a shallow submarine bank that separates the Gulf of Maine from the Northwest Atlantic Ocean, with a minimum water depth of less than 20 m. The geometry of the Gulf of Maine is characterized by several deep basins and shallow submarine banks. It also has the world's largest tidal range in the Bay of Fundy, the northern part of the Gulf of Maine.
(Marrone, 2008).
The storm generated a pronounced storm surge and large wave acting along the western periphery of the Gulf of Maine. The recorded storm tide corresponded to a 10-year return period event in Portland, Maine. The storm tide peaked at Fort Point, New Hampshire, with a return period exceeding 50 years. The highest waves recorded by nearshore buoys were approximately 9 m (Marrone, 2008; Douglas and Fairbank, 2010). The combination of high astronomical tides, storm surges, and large battering waves resulted in significant coastal flooding and severe erosion along the vulnerable sandy coastline from southern Maine through Cape Cod, Massachusetts.
4. Methods
4.1. ADCIRC model
The ADCIRC model, developed by Luettich et al. (1992) and Westerink et al. (1994), was used to simulate the response of water levels and currents to the Patriot's Day storm in the Gulf of Maine. The two-dimensional (2D) depth-integrated version, often referred to as ADCIRC-2DDI, was used in this study. It basically solves generalized wave con-tinuity equations on an unstructured triangular mesh with a continuous Galerkin finite element method. By using an un-structured triangular mesh, the model is capable of resolving complex geometry and bathymetry. The governing equations in spherical coordinates are as follows:
vz vtþ 1 Rcosf vðUHÞ vl þ vðVHcosfÞ vf ¼0 ð1Þ vU vt þ 1 RcosfU vU vlþ V R vU vf tanf R Uþf V¼ 1 Rcosf v vl ps r0þgðzahÞ þvT H v vl vðUHÞ vl þ vðVHÞ vf þ tsl r0Ht*U ð2Þ
vV vt þ 1 RcosfU vV vlþ V R vV vf tanf R Uþf U¼ 1 R v vf ps r0þgðzahÞ þvT H v vf vðVHÞ vl þ vðVHÞ vf þ tsf r0Ht*V ð3Þ
where t is time; l andf are longitude and latitude, respec-tively;z is the free surface elevation relative to the geoid;U and Vare depth-integrated velocity components in west-east and south-north directions, respectively; H¼zþh is the total water depth andhis the bathymetric water depth relative to the geoid;f is the Coriolis parameter, where U represents the angular speed of the earth, and,f¼2Usinf; ps is the at-mospheric pressure at the free surface; h is the Newtonian equilibrium tide potential; a is the effective earth elasticity factor;r0 is the reference density of water;Ris the radius of
the earth;g is gravitational acceleration;tsl andtsf are the
surface wind stresses in longitudinal and latitudinal directions, respectively, which are computed by a standard quadratic air-sea drag law, and the air-air-sea drag coefficient is defined by Garratt's drag formula (Garratt, 1977);t*is the bottom friction term; andvT is the depth-averaged horizontal eddy viscosity
coefficient. The bottom friction termt*is defined as
t*¼CfðU2þV2Þ 1=2
H ð4Þ
whereCfis the bottom friction coefficient. 4.2. SWAN model
A third-generation spectrum wave model, the SWAN model (Booij et al., 1999; Ris et al., 1999), was used for wave simulation in this study. The SWAN model solves the wave action balance equation and obtains wave parameters by integrating a 2D wave energy spectrum in the frequency and direction domain. Its governing equation in spherical co-ordinates is as follows: vN vt þ vclN vl þcos1f vcfcosfN vf þ vcsN vs þ vcqN vq ¼ Stot s ð5Þ
wheresis the relative radian or circular frequency;qis the wave propagation direction; cland cfdenote the speed of wave energy
propagation in longitudinal and latitudinal directions, respec-tively. csand cqare the wave energy propagation velocities in
spectral space; Stot is the source/sink term that represents all physical processes which generate, dissipate, or redistribute wave energy; andNis the wave action density, which is defined as Nðl;f;s;qÞ ¼Eðl;f;s;qÞ
s ð6Þ
in which E represents the wave energy density. The source term on the right side of Eq. (5) includes input energy from wind, dissipation by the bottom friction, wave breaking, and nonlinear wave-wave interactions.
4.3. SWANþADCIRC coupled model
Dietrich et al. (2011) integrated the unstructured mesh SWAN model and the ADCIRC model, which is known as the SWANþADCIRC model. By sharing the same unstructured finite element mesh, the ADCIRC model and the SWAN model are coupled in the following way: the ADCIRC model first interpolates the input wind spatially and temporally onto the computational vertices and runs to calculate water levels and currents. The wind field, water level, and currents are then passed to the SWAN model to obtain the wave spectrum by solving the wave action density balance equation. The radia-tion stress due to the presence of surface gravity waves (Longuet-Higgins and Stewart, 1962) is then passed to the ADCIRC model to predict the water levels and currents. 5. Model setup
5.1. Model domain
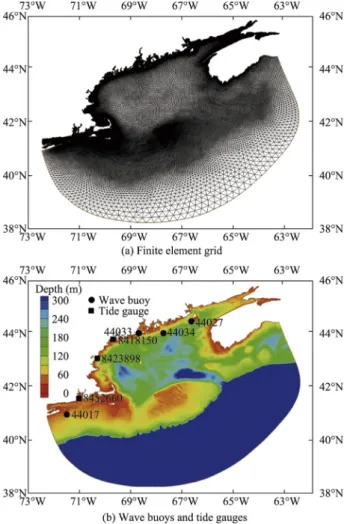
The model domain for tide-surge and wave simulations covers the Gulf of Maine and waters surrounding Cape Cod, Fig. 1. Map of Gulf of Maine and its adjacent shelf/slope region.
Hampshire), and 8452660 (Newport, Rhode Island). 5.2. Surface wind and air pressure forcing
The National Centers for Environmental Prediction (NCEP)/ North American Regional Reanalysis (NARR) dataset (http:// www.esrl.noaa.gov/psd/) was used as the surface wind and pres-sure forcing for the model. Covering the North American region, the NARR dataset uses the high-resolution NCEP Eta Model
5.3. Model parameters
The ADCIRC-2DDI model is used for tide-surge simula-tion. The finite amplitude and convection terms are activated. Lateral viscosity is set at a constant of 5 m/s2 through the whole domain (Yang and Myers, 2008). The hybrid bottom friction relationship is used to specify a varying bottom fric-tion coefficient depending on water depth (Luettich and Westerink, 2006): Cf¼Cfmin " 1þ Hbreak H qf#gf=qf ð7Þ whereCfminis the minimum bottom friction coefficient,Hbreakis
the break depth,qfis a dimensionless parameter that determines how rapidly the hybrid bottom friction relationship approaches its deep water or shallow water limits when the water depth is greater than or less than Hbreak, and gf is a dimensionless parameter that determines how the friction factor increases as the water depth decreases. When the water depth is less than Hbreak, the formulation applies a depth-dependent,
Manning-type friction law, while a standard Chezy friction law is used when the depth is greater thanHbreak. The parameters in the
Eq.(7) are set toCfmin ¼0.03,Hbreak ¼2.0 m,qf¼10, and gf ¼ 1.33333 as recommended by Luettich and Westerink (2006).
For the calculation of the surface wind stress, the wind drag coefficient described by Garratt (1977) with a cap of Cd0.0035 is used. The eight most significant astronomical tide constituents (M2, S2, N2, K2, K1, P1, O1, and Q1) are used to drive the model along the open boundary. The corresponding harmonic constants of the eight tidal constituents are interpo-lated from the OSU TOPEX/Poseidon Global Inverse solution TPXO (Egbert and Erofeeva, 2002). The time step for the ADCIRC model is set to 1 s to maintain computational stability. The wave simulation model, i.e., the SWAN model, shares the same unstructured mesh and surface wind forcing with the ADCIRC model. Along the offshore boundary, wave spectra based on National Oceanic and Atmospheric Administration (NOAA) WAVEWATCHIII hindcast reanalysis data in the northwestern Atlantic Ocean (ftp://polar.ncep.noaa.gov/pub/ Fig. 2. Finite element grid, wave buoys, and tide gauges in model
history/waves) are used to allow swells generated outside of the model domain to propagate reasonably into the model domain.
The prescribed spectrum frequencies range from 0.04 to 1.00 Hz and are discretized into 34 bins on a logarithmic scale. The wave spectrum is solved in full circles with the directional resolution being 10. The Jonswap formulation (Hasselmann et al., 1973) is used for the bottom friction. The friction co-efficient of 0.038 m2/s3is used for both wind waves and swells (Zijlema et al., 2012). The time step for integration is set to 600 s.
The coupling interval of the model is the same as the time step for wave integration. The ADCIRC model passes wind forcing, water levels, and currents to the SWAN model every 600 s, while the SWAN model passes radiation stress to the ADCIRC model to update circulation calculations. The model ran for 30 days from April 1, 2007 to April 30, 2007 from a cold start. The elevation-specified boundary condition was first ramped up for five days with a hyperbolic tangent function until an equilibrium state was reached before surface wind and pressure forcing were applied.
Three cases were run in this study: (1) the ADCIRC model run for tide-surge simulation, (2) the SWAN model run for waves, and (3) a fully-coupled SWANþADCIRC model run considering wave effects on circulation.
6. Results and discussion 6.1. Tide and surge validation
The tide simulated by the ADCIRC model during the Pa-triot's Day storm was first compared with observed data from tide gauge data. This is a prerequisite since coastal flooding often coincides with high tides. The water level recorded by NOAA/CO-OPS tidal stations was analyzed using the MAT-LAB harmonic analysis toolbox T_Tide (Pawlowicz et al., 2002) to extract tidal components. The extracted tide series was then compared with the model prediction.Fig. 4 shows
the comparison results at three tide gauges along the coast of the Gulf of Maine: tide gauges 8418150, 8423898, and 8452660. In Fig. 4, astronomic tide denotes the tide level generated by harmonic analysis of the recorded tide gauge data and ADCIRC tide denotes model simulation results. Generally, the simulated tide agrees with the observation both in magnitude and phase. The simulated tide is slightly lower than that of observed data at high tide, which may be due to the overestimated bottom friction coefficient in the model.
The surface wind and pressure forcing were then added to the model to simulate storm surges during the Patriot's Day storm.Fig. 5shows the comparison of simulated surge levels with observations. Obs denotes the observed storm surge level and ADCIRC surge denotes modeling results.
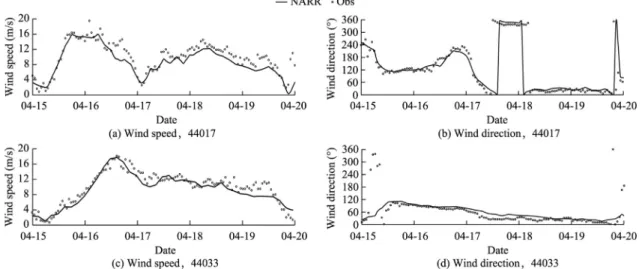
Fig. 3. Comparison of NARR wind outputs with wave buoy observations during Patriot's Day storm in 2007 at two wave buoys.
Fig. 4. Comparison of simulated tide level with astronomic tide level during Patriot's Day storm in 2007 at different tide gauges.
At tide gauges 8418150 and 8423898, the predicted peak surge level agrees with the observed data. The oscillation after a surge peak with a similar frequency of tides may be due to strong surge-tide interactions. At tide gauge 8452660, the surge peak is under-predicted by approximately 0.2 m. After the peak of the surge, the surge level is under-predicted, which can be explained by the short fetch from the east boundary of the mode domain to the western periphery of the Gulf of Maine. A simple way to estimate storm surge formation is described by Pugh (1987). For an equilibrium state with a constant wind field, the sea surface slope can be expressed by a simple linear, steady-state expression so that the surge level at the coast is as follows:
jfCdrAW2L
grD ð8Þ
wherejis the surge level at the coast,Lis the shelf width,Dis the averaged water depth, Wis the wind speed, rAis the air density, andris the density of sea water. When offshore wind veers from the southeast to the east as the storm moves to the east, the shelf width L within the model domain is not long enough to predict the observed surge at the coast without proper offshore surge boundary conditions. In this case, it may be more reasonable to specify water level or current velocity instead of tidal constituents to take the surge along the open boundary into consideration.
6.2. Wave validation
Wave simulations were compared with buoy data inFig. 6, in which Obs denotes observed buoy data and SWAN wave denotes simulated results. Figs. 6(a) through (d) are the comparisons of significant wave height (SWH) andFigs. 6(e)
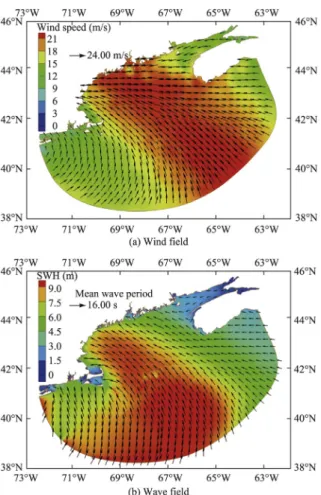
Snapshots of wind and wave fields at 1400 coordinated universal time (UTC), April 16, 2007 are presented in this section to describe wave evolution in the modeling domain. The SWH and water level reached their maxima in the southern part of the Gulf of Maine at this time.
As shown inFig. 7(b), the storm-generated SWH exceeds 5.0 m over the majority of the model domain, with its maximum being approximately 9.0 m off the Georges Bank. The wave distribution can be approximated by spectral theory depending on whether it is fetch-limited or duration-limited. While SWH will grow in the downwind direction, wave en-ergy will be dissipated by processes including whitecapping, bottom friction, and wave breaking. It can be seen that when waves propagate from deep water into the inner gulf area, wave energy is dissipated over the Georges Bank, as charac-terized by several troughs and ridges and the minimum water depth of less than 20 m. This phenomenon indicates that the Georges Bank plays an important role in decreasing SWH propagation from offshore into the inner gulf area. Also, SWH further decreases towards the shore due to the bottom friction and wave breaking.
6.4. Depth-averaged currents
The depth-averaged current fields for the three study cases in the Gulf of Maine at 1400 UTC, April 16, 2007 are plotted in Fig. 8. Fig. 8(a) shows tidal circulation only, Fig. 8(b) presents the combination of circulations driven by tides and the meteorological forcing, andFig. 8(c) considers the effect of waves on circulation by the coupled SWANþADCIRC model.
It can be seen that the tidal current is dominant over the majority of the modeling domain, except areas adjacent to the coastline, by comparingFigs. 8(a) and (b). The maximum tidal current occurs within the Bay of Fundy and can reach 2.0 m/s. The Georges Bank is another area where large tidal currents are found. At the southern flank of the bank, the depth-averaged tidal current ranges from 0.6 m/s to 0.8 m/s. At the northern flank, the tidal current is slightly larger, between 0.7 m/s and 0.9 m/s. Over the bank with the minimum water depth, the tidal current speed can reach 1.0 m/s.
Fig. 5. Comparison of computed storm surge with observed data during Patriot's Day storm in 2007 at different tide gauges.
Fig. 8(b) shows the combined depth-averaged velocity driven by both tides and the meteorological forcing. The magnitude of depth-averaged velocity driven by the meteo-rological forcing significantly increases in the coastal area. Along the west coast of the Gulf of Maine, the current exceeds 0.5 m/s in most areas and is generally in the longshore di-rection. A simple model can be used to explain this. In the vicinity of the coast, where the condition of no cross-boundary flow can be applied, longshore currents will be generated by the surface wind stress acting parallel to the coastline. The magnitude of the current will generally be inversely propor-tional to the water depth and eventually be limited by the bottom friction (Pugh, 1987). Meanwhile, in the cross-shore direction, a sea-level gradient normal to the coast will be generated to balance the surface wind stress in the cross-shore direction. Over the Georges Bank, the magnitude of depth-averaged velocity increases and the current direction shifts further north, driven by the meteorological forcing.
Fig. 8(c) shows the circulation field considering wave ef-fects on currents through the wave radiation stress, which is mainly significant in shallow water areas where the wave height changes drastically due to wave transformation, e.g., the shoaling effect, wave refraction, bottom friction dissipa-tion, and wave breaking. It can be seen that the depth-averaged velocity mostly increases over the Georges Bank by approxi-mately 0.2 m/s when compared with Fig. 8(b). Since wave
energy significantly dissipates over the Georges Bank when it propagates from offshore into the inner gulf (Fig. 7(b)), it exerts excess momentum flux on mean circulation, adding net transport into the inner gulf area.
6.5. Residual currents
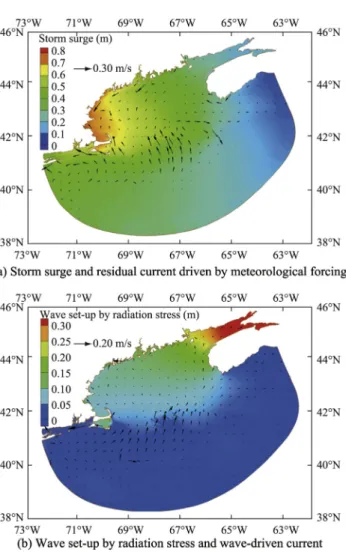
The meteorological and wave-driven residual currents are further analyzed at 1400 UTC, April 16, 2007 in this section. Figs. 9(a) and (b) show the residual water level and currents driven by the meteorological forcing and waves, respectively. The storm surge level driven by the meteorological forcing can reach 0.8 m at the western coast of the Gulf of Maine (Fig. 9(a)), which agrees with the results obtained byMarrone (2008). The current driven by the meteorological forcing is mainly significant over the Georges Bank and along the coast, the magnitude of which reaches 0.3 m/s.
The wave-driven residual current shows a different pattern (Fig. 9(b)) compared with that driven by the meteorological forcing. The wave set-up by radiation stress reaches its maximum of 0.3 m in the Bay of Fundy and decreases from north to south, as well as from the coast to offshore. The maximum wave-driven current is over the Georges Bank and along the coast, with its magnitude being 0.2 m/s. Over the Georges Bank, the residual current mainly travels to the north, adding net volume transport into the inner gulf area. Along the Fig. 6. Comparison of simulated wave parameters with buoy data during Patriot's Day storm in 2007 at different wave buoys.
coast, the longshore residual current mainly comes from the oblique incidence of waves, introducing longshore wave ra-diation stress exerted on the mean current. This longshore current will be limited by the bottom friction.
7. Conclusions
In April of 2007, an intense nor'easter, the Patriot's Day storm, swept through the coast of the Gulf of Maine and caused significant coastal flooding and severe beach erosion along the New England coastline. A state-of-the-art fully-coupled model, the SWANþADCIRC model, was used to study the hydrodynamic response to this notable storm in the Gulf of Maine. The model reasonably reproduced the tides, storm surges, and large waves compared with tide gauge and wave buoy data. Wave distribution and circulation were analyzed and the following can be concluded:
(1) Wave energy generated by wind well offshore is significantly dissipated over the Georges Bank, a region characterized by several deep troughs and shallow ridges, indicating that the Georges Bank plays an important role in decreasing SWH when waves propagate from the open northwest Atlantic Ocean towards the inner Gulf of Maine.
(2) The residual currents driven by the meteorological forcing and waves, which reach their maxima of 0.3 m/s and
0.2 m/s, respectively, are enhanced over the Georges Bank and along the western coast of the Gulf of Maine.
(3) In the vicinity of the coast, where the condition of no normal flow can be applied, the longshore current generated by the wind and wave radiation stress is inversely proportional to the water depth and eventually limited by the bottom fric-tion. The wave set-up due to the radiation stress gradient reaches 0.2 m along the western coast, which has an important implication for coastal flooding.
Fig. 7. Snapshots of wind and wave fields at 1400 UTC, April 16, 2007.
Fig. 8. Snapshots of circulation in Gulf of Maine at 1400 UTC, April 16, 2007.
References
Beardsley, R.C., Chen, C.S., Xu, Q.C., 2013. Coastal flooding in Scituate (MA): A FVCOM study of the Dec. 27, 2010 Nor'easter. J. Geophys. Res.: Oceans 118(11), 6030e6045.http://dx.doi.org/10.1002/2013JC008862. Bernier, N.B., Thompson, K.R., 2007. Tide-surge interaction of the east coast
of Canada and northeastern United States. J. Geophys. Res.: Oceans 112(C6), C06008.http://dx.doi.org/10.1029/2006JC003793.
Booij, N., Ris, R.C., Holthuijsen, L.H., 1999. A third-generation wave model for coastal regions, Part 1: Model description and validation. J. Geophys. Res.: Oceans 104(C4), 7649e7666.http://dx.doi.org/10.1029/98JC02622. Chen, C., Beardsley, R.C., Luettich, R.A., Westerink, J.J., Wang, H.,
Perrie, W., Toulany, B., 2013. Extratropical storm inundation testbed: Intermodel comparisons in Scituate, Massachusetts. J. Geophys. Res.: Oceans 118(10), 5054e5073.http://dx.doi.org/10.1002/jgrc.20397. Davis, R.E., Dolan, R., 1993. Nor'easters. Am. Sci. 81(5), 428e439. Dietrich, J.C., Zijlema, M., Westerink, J.J., Holthuijsen, L.H., Dawson, C.,
Luettich Jr., R.A., Stone, G.W., 2011. Modeling hurricane waves and storm surge using integrally-coupled, scalable computations. Coast. Eng. 58(1), 45e65.http://dx.doi.org/10.1016/j.coastaleng.2010.08.001.
Douglas, E.M., Fairbank, C., 2010. Is precipitation in northern New England becoming more extreme? Statistical analysis of extreme rainfiall in Mas-sachusetts, New Hampshire, and Maine and updated estimates of the 100-year storm. J. Hydrol. Eng. 16(3), 203e217. http://dx.doi.org/10.1061/ (ASCE)HE.1943-5584.0000303.
Egbert, G.D., Erofeeva, S.Y., 2002. Efficient inverse modeling of barotropic ocean tides. J. Atmos. Ocean. Technol. 19(2), 183e204.http://dx.doi.org/ 10.1175/1520-0426(2002)019<0183:EIMOBO>2.0.CO;2.
Garratt, J.R., 1977. Review of drag coefficients over oceans and continents. Mon. Weather Rev. 105(7), 915e929. http://dx.doi.org/10.1175/1520-0493(1977)105<0915:RODCOO>2.0.CO;2.
Grant, W.D., Madsen, O.S., 1979. Combined wave and current interaction with a rough bottom. J. Geophys. Res.: Oceans 84(C4), 1797e1808.http:// dx.doi.org/10.1029/JC084iC04p01797.
Hasselmann, K., Barnett, T.P., Bouws, E., Carlson, H., Cartwright, D.E., Enke, K., Ewing, J.A., Gienapp, H., Hasselmann, D.E., Kruseman, P., et al., 1973. Measurements of Wind-wave Growth and Swell Decay During the Joint North Sea Wave Project (JONSWAP). Deutches Hydro-graphisches Institute, Delft.
Longuet-Higgins, M.S., Stewart, R.W., 1962. Radiation stress and mass transport in gravity waves, with application to“surf beats”. J. Fluid Mech. 13(04), 481e504.http://dx.doi.org/10.1017/S0022112062000877. Longuet-Higgins, M.S., Stewart, R.W., 1964. Radiation stresses in water
waves: A physical discussion, with applications. Deep-Sea Res. 11(4), 529e562.http://dx.doi.org/10.1016/0011-7471(64)90001-4.
Luettich, R.A., Westerink, J.J., Scheffner, N.W., 1992. ADCIRC: An Advanced Three-dimensional Circulation Model for Shelves, Coasts and Estuaries. Report 1: Theory and Methodology of ADCIRC-2DDI and ADCIRC-3DL. Department of the US Army Corps of Engineers, Wash-ington, D.C.
Luettich, R.A., Westerink, J.J., 2006. ADCIRC: A (parallel) Advanced Cir-culation Model for Oceanic, Coastal and Estuarine Waters, Users Manual for Version 51. Published online athttp://adcirc.org/home/documentation/ users-manual-v51/.
Marrone, J.F., 2008. Evaluation of impacts of the Patriots'Day storm (April 15e18, 2007) on the New England coastline. Solut. Coast. Disasters 507e517.http://dx.doi.org/10.1061/40968(312)46.
Panchang, V.G., Jeong, C., Li, D., 2008. Wave climatology in coastal Maine for aquaculture and other applications. Estuaries Coasts 31(2), 289e299. http://dx.doi.org/10.1007/s12237-007-9016-5.
Pawlowicz, R., Beardsley, B., Lentz, S., 2002. Classical tidal harmonic analysis including error estimates in MATLAB using T_TIDE. Comput. Geosci. 28(8), 929e937.http://dx.doi.org/10.1016/S0098-3004(02)00013-4. Pugh, D.T., 1987. Tides, Surges and Mean Sea-level: A Handbook for
Engi-neers and Scientists. John Wiley and Sons, New York.
Ris, R.C., Holthuijsen, L.H., Booij, N., 1999. A third-generation wave model for coastal regions, Part 2: Model description and validation. J. Geophys. Res.: Oceans 104(C4), 7649e7666. http://dx.doi.org/10.1029/ 1998JC900123.
Sucsy, P.V., Pearce, B.R., Panchang, V.G., 1993. Comparison of two and three-dimensional model simulation of the effect of a tidal barrier on the Gulf of Maine tides. J. Phys. Oceanogr. 23(6), 1231e1248. http://dx.doi.org/ 10.1175/1520-0485(1993)023<1231:COTATD>2.0.CO;2.
Teixeira, J.C., Abreu, M.P., Soares, C.G., 1995. Uncertainty of ocean wave hindcasts due to wind modeling. J. Offshore Mech. Arct. Eng. 117(4), 294e297.http://dx.doi.org/10.1115/1.2827237.
Warner, J.C., Sherwood, C.R., Signell, R.P., Harris, C.K., Arango, H.G., 2008. Development of a three-dimensional, regional, coupled wave, current, and sediment-transport model. Comput. Geosci. 34(10), 1284e1306. http:// dx.doi.org/10.1016/j.cageo.2008.02.012.
Westerink, J.J., Luettich, R.A., Blain, C.A., Scheffner, N.W., 1994. ADCIRC: An Advanced Three-dimensional Circulation Model for Shelves, Coasts and Estuaries. Report 2: Users’Manual for ADCIRC-2DDI. Department of the Army US Army Corps of Engineers, Washington, D.C.
Yang, Z., Myers, E.P., 2008. Barotropic tidal energetics and tidal datums in the Gulf of Maine and Georges Bank region. Estuar. Coast. Model. 74e94. http://dx.doi.org/10.1061/40990(324)5.
Zijlema, M., van Vledder, G.P., Holthuijsen, L.H., 2012. Bottom friction and wind drag for wave models. Coast. Eng. 65, 19e26. http://dx.doi.org/ 10.1016/j.coastaleng.2012.03.002.
Zou, Q.P., 2004. A simple model for random wave bottom friction and dissipation. J. Phys. Oceanogr. 34(6), 1459e1467. http://dx.doi.org/ 10.1175/1520-0485(2004)034<1459:ASMFRW>2.0.CO;2.
Zou, Q.P., Bowen, A.J., Hay, A.E., 2006. Vertical distribution of wave shear stress in variable water depth: Theory and field observations. J. Geophys. Res.: Oceans 111(C9), C09032.http://dx.doi.org/10.1029/2005JC003300.
Fig. 9. Snapshots of meteorological and wave-driven residual currents at 1400 UTC, April 16, 2007.