2015
Development of rural curve driving models using
lateral placement and prediction of lane departures
using the SHRP 2 naturalistic driving data
Nicole Lynn Oneyear Iowa State University
Follow this and additional works at:https://lib.dr.iastate.edu/etd
Part of theCivil Engineering Commons, and theTransportation Engineering Commons
This Dissertation is brought to you for free and open access by the Iowa State University Capstones, Theses and Dissertations at Iowa State University Digital Repository. It has been accepted for inclusion in Graduate Theses and Dissertations by an authorized administrator of Iowa State University Digital Repository. For more information, please contactdigirep@iastate.edu.
Recommended Citation
Oneyear, Nicole Lynn, "Development of rural curve driving models using lateral placement and prediction of lane departures using the SHRP 2 naturalistic driving data" (2015).Graduate Theses and Dissertations. 14632.
by Nicole Oneyear
A dissertation submitted to the graduate faculty in partial fulfillment of the requirements for the degree of
DOCTOR OF PHILOSOPHY
Major: Civil Engineering (Transportation Engineering) Program of Study Committee:
Shauna L. Hallmark, Major Professor Alicia L. Carriquiry
Jing Dong Omar Smadi Sri Sritharan
Iowa State University Ames, Iowa
TABLE OF CONTENTS
LIST OF FIGURES v LIST OF TABLES vi ACKNOWLEDGEMENTS viii ABSTRACT xi CHAPTER 1: INTRODUCTION 1 Background 1Background on SHRP 2 Naturalistic Driving Study 2 Background on SHRP 2 Roadway Information Database 2
Previous Research 3
Factors contributing to run off the road crashes 3 Crash Surrogates Related to Roadway Departures 7 Vehicle Path Trajectories and Lateral Position within curves 8
Summary 12
Problem statement 13
Research Question 1: How do drivers normally negotiate a single isolated
horizontal curve? 14
Research Question 2: How do drivers negotiate horizontal curves? 15 Research Question 3: Which factors increase the likelihood of a lane
departure? 16
Study limitations 16
Study implications 18
Organization of the Dissertation 19
Additional Contributions 20
References 20
CHAPTER 2: DEVELOPMENT OF A CONCEPTUAL MODEL OF CURVE DRIVING FOR ISOLATED RURAL TWO LANE CURVES USING SHRP 2
NATURALISTIC DRIVING DATA 24
Abstract 24
Introduction 25
Background on SHRP 2 Naturalistic Driving Study 26 Background on SHRP 2 Roadway Information Database 26
Previous Research 27
Methodology 28
Identification of Curves of Interest 29
Data Collection and Data Reduction 30
Data Sampling 36
Analysis 41
Results 42
Results for Outside of Curve 44
Summary and Conclusions 45
Limitations 46
Acknowledgements 47
References 47
CHAPTER 3 - CONCEPTUAL LINEAR MIXED EFFECTS MODEL OF RURAL TWO LANE CURVE DRIVING USING SHRP 2 NATURALISTIC
DRIVING DATA 50
Abstract 50
Introduction 51
Background on SHRP 2 Naturalistic Driving Study 52 Background on SHRP 2 Roadway Information Database 52
Previous Research 53
Methodology 55
Identification of Curves of Interest 55
Data Collection and Data Reduction 56
Data Sampling 62
Analysis 67
Results 69
Summary and Conclusions 72
Limitations 74
Acknowledgements 75
References 75
Appendix 3: Random Intercepts 77
CHAPTER 4: PREDICTION OF LANE ENCROACHMENT ON RURAL TWO LANE CURVES USING THE SHRP 2 NATURALISTIC DRIVING STUDY
DATA 80 Abstract 80 Introduction 81 Objective 82 Data 83 Data Sources 83 Data Request 84 Data Reduction 85 Data Sampling 90 Analysis 95
Lane Encroachment Probability 95
LME models 95
Results 96
Lane Encroachment Logistic Regression Model 96 Speed at Point of Curvature Linear Mixed Effects Model 98 Offset at Point of Curvature Linear Mixed Effects Model 99
Discussion and Conclusions 101
References 104
Appendix 4 – Random Effects Intercepts 106
Logistic Regression 106
Linear Mixed Model – Speed 107
Linear Mixed Model – Offset 108
CHAPTER 5: CONCLUSIONS AND DISCUSSION 109
General Conclusions 109
Contribution to State Of The Art 111
Limitations 112
Data accuracy 112
Limited sample sizes 114
Use of surrogates 114
Additional Research 115
Expand current models 115
Develop crash prediction model 116
References 116
APPENDIX A: DATA EXTRACTION METHODOLOGY 117
Roadway Data 117
Environmental factors 126
Exposure factors 129
LIST OF FIGURES
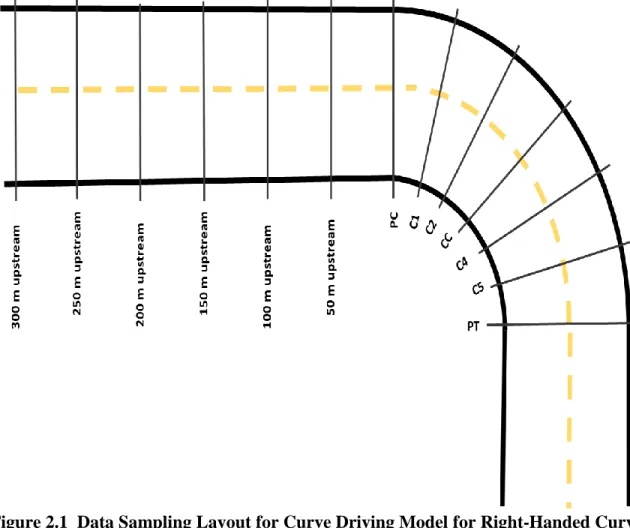
Figure 1.1 Models of Curve Negotiation Developed by Spacek 9 Figure 1.2 Curve Negotiation as Defined by Campbell et al. 12 Figure 2.1 Data Sampling Layout for Curve Driving Model for Right-Handed
Curve 37
Figure 3.1 Data Sampling Layout for Curve Driving Model for Right-Handed
Curve 63
Figure 3.2 Parameter estimates of vehicle trajectories 71
Figure 4.1 Glance Locations 89
Figure A.1 Description of Variables to Calculate Lane Position 118 Figure A.2 Subjective Measurement of Vehicle Following 119 Figure A.3 Presence of Edge Line Only Rumble Strips 123 Figure A.4 Subjective Measure of Lane Marking Condition Using Forward
Imagery 124
Figure A.5 Subjective Measurement of Vehicle Following 125 Figure A.6 Subjective Measure of Roadway Pavement Surface Condition
Using Forward Imagery 126
Figure A.7 Pavement Surface Condition from Forward Imagery 127 Figure A.8 Image Shows Some Reduced Visibility but May Be Due to Sun
Angle or Image Resolution 128
LIST OF TABLES
Table 2.1 Roadway Variables Extracted and Main Source 31 Table 2.2 Summary Statistics for Select Variables 38
Table 2.3 Variables Explored in Analysis 39
Tahle 2.4 Driver Characteristics 40
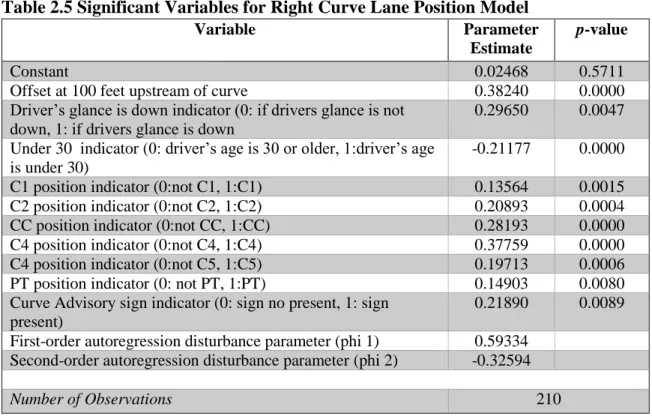
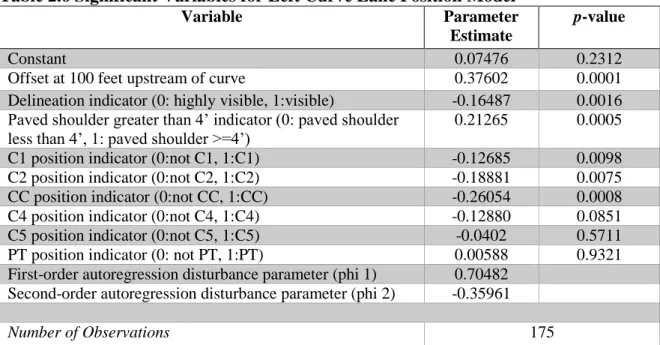
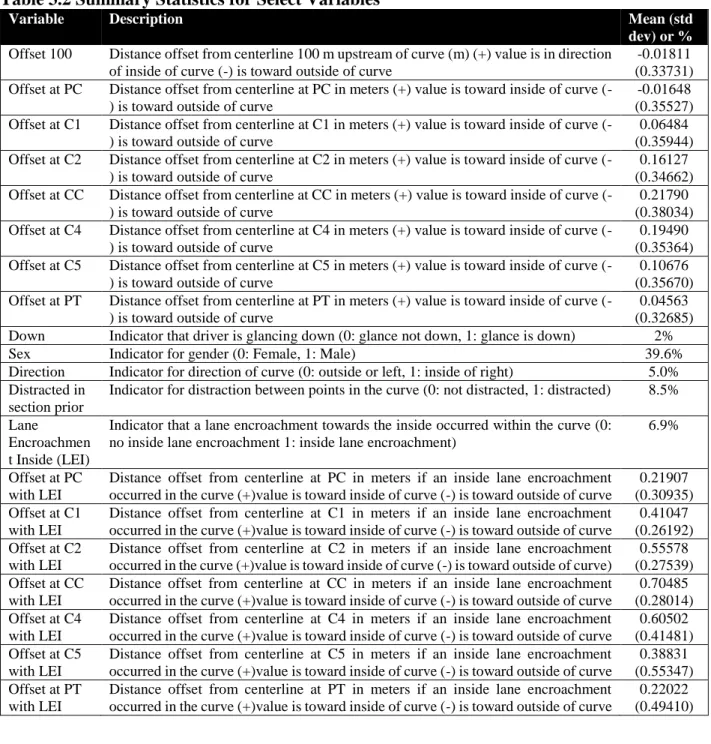
Table 2.5 Significant Variables for Right Curve Lane Position Model 43 Table 2.6 Significant Variables for Left Curve Lane Position Model 45 Table 3.1 Roadway Variables Extracted and Main Source 57 Table 3.2 Summary Statistics for Select Variables 65
Table 3.3 Variables Explored in Analysis 66
Table 3.4 Driver Characteristics 67
Table 3.5 Curves and Traces by Curve Radius 67
Table 3.6 Best fit model 69
Table A3.1 DriverID 77
Table A3.2 CurveID in DriverID 78
Table 4.1 Distribution of Curve Characteristics 92 Table 4.2 Distribution Driver Age and Gender 92 Table 4.3 Environmental, Driver, and Other Factors 93
Table 4.4 Roadway Factors 94
Table 4.5 Parameter Estimates for Inside Encroachments 97 Table 4.6 Confidence Intervals for Inside Encroachments 97 Table 4.7 Parameter Estimates for Speed at PC 99 Table 4.8 Parameter Estimates for Offset at PC 100 Table A4.1 Logistic Regression Curve Random Intercepts 106
Table A4.2 Speed LME Curve Random Intercepts 107 Table A4.3 Offset LME Curve Random Intercepts 108
Table A.1 Eye Glance Coding 130
ACKNOWLEDGEMENTS
This work was sponsored by the Federal Highway Administration in cooperation with the American Association of State Highway and Transportation Officials, and it was conducted in the Strategic Highway Research Program, which is administered by the Transportation Research Board of the National Academies. In addition I’d like to thank the Federal Highway
Administration Dwight David Eisenhower Transportation Fellowship Program for their support of my graduate studies and this research. I would also like to thank the Midwest Transportation Center for their additional financial support in conducting this research.
I’d also like to thank my committee, especially my major professor Shauna Hallmark, for their insight, guidance and constructive comments in the development of this dissertation.
Additionally, thank you to everyone who helped in reducing data for this project, specifically Cher Carney at University of Iowa, Bo Wang and Jordan Turner at Iowa State University. Skylar Knickerbocker and Zach Hans also provided help in utilizing the RID data. Finally, thank you to Samantha Tyner who helped answer all of my statistics related questions.
ABSTRACT
Roadway departure crashes are a major cause of fatalities on rural horizontal curves. In 2008, the Federal Highway Administration estimated that 27% of all fatalities occurred on rural highways and that among those 76% were single vehicles leaving the roadway and striking a fixed object or overturning while another 11% were head-on collisions (AASHTO 2008). Addressing crashes on rural two lane curves, specifically run off the road crashes, remains a priority for our local, state and national roadway agencies.
Much research has been conducted to look at what factors affect curve negotiation, and which factors are more likely to contribute to roadway departures. Previous research has studied how roadway factors, such as radius and shoulder width and environmental factors, such as weather affect crashes, yet limited research has been conducted looking at how driver behaviors affect crash risk. Additional research has been conducted on developing curve negotiation trajectories using small sets of curves and without much driver information.
The recent completion of the Strategic Highway Research Program 2 (SHRP 2) Naturalistic Driving Study (NDS) and Roadway Information Database (RID) allows one to expand on gaps in current literature by utilizing data from a wide variety of participants in multiple states across a broad age ranges. It also allows one to include driver factors such as age and gender, as well as drivers glance behavior and presence of distractions.
This dissertation utilizes early data from the SHRP 2 NDS and RID to develop models which provide an additional understanding of rural curve negotiation. Through three papers, two curve driving models were developed as well a model which predicts the likelihood of lane departures based off kinematic vehicle data.
In the first paper (Chapter 2) a model of normal curve driving trajectories on isolated rural two lane curves was developed using generalized least squares with an autocorrelation
structure. This model found that a drivers offset 100 meters upstream of the start of the curve could help predict a vehicles position at various points throughout the curve. Additionally, the model was able to predict the average path a driver would take through seven points in the curve. These estimators suggest that drivers tend to cut the curve and are more susceptible to a lane departure at certain points in the curve.
Chapter 3, the second paper, builds on the model developed in Chapter 2 and includes additional non-isolated curves as well as non-normal driving (i.e. lane encroachments). This linear mixed effects model of curve driving trajectories included random effects for the repeated samples of drivers and drivers within the same curve as well as the same autocorrelation structure. This model was able to determine a difference in the offset at each point in the curve for those traces where a lane departure towards the inside of curve occurred and when it did not. This allowed for a boundary between normal and non-normal driving to be established. A similar correlation between the driver’s lane position upstream of the curve and lane position in the curve was also found. Smaller radii, looking down and being distracted were all found to affect trajectories in rural curves.
The final paper, Chapter 4, includes a mixed logistic regression which included a random effect for curve which took into account the repeated samples for the curves. This model
produced odds-ratios for the three variables and found that increasing the amount over the advisory speed by 1 mph at the Point of Curvature (PC) of the curve increased odds of a lane encroachment towards the inside of the curve by 1.11. Shifting lane position by 0.1 m towards the inside of the curve at the PC increased odds of an inside lane departure by 1.5. In addition to the logistic regression model, two linear mixed effects models were developed which allow one
to predict the speed and offset at the PC using data from 100 m upstream. This allows one to predict the probability of a lane departure 100 m upstream of the curve in addition to at the PC.
CHAPTER 1: INTRODUCTION
1.1 Background
According to the Federal Highway Administration, a horizontal curve is a part of the roadway that changes the alignment or direction of the road. Horizontal curves make up a small portion of our total roadway miles, yet they were the site of 27% of all fatalities in 2008. Of this 27% of total fatal crashes, 76% were single vehicles leaving the roadway and striking a fixed object or overturning. Another 11% were head-on collisions (AASHTO 2008). Therefore, in 2008 approximately 23% of all fatalities were the result of lane departure crashes on horizontal curves.
Due to the small percentage of roadway miles curves represent, yet the large amount of crashes we see, fatal crashes tend to be overrepresented on curves. A study by Glennon et al. (1985), found that the crash rate on curves is approximately three times the rate on tangent sections. Preston (2009) reported that 25% to 50% of severe road departure crashes in Minnesota occurred on curves, even though they only account for 10% of the system mileage. Addressing crashes on rural two lane curves, specifically run off the road crashes, remains a priority for our local, state and national roadway agencies.
Reducing serious injuries and fatalities due to lane departures is an area of focus in the majority of Strategic Highway Safety Plans (SHSP). In addition to the States’ SHSP’s, FHWA has recently published a Roadway Departure Strategic Plan which hopes to reduce fatalities by half from 17,000 annually to 8,500 by 2030. In order to accomplish this their mission is to develop, evaluate and deploy life-saving countermeasures and promote data-driven application of safety treatments (FHWA 2013).
1.1.1 Background on SHRP 2 Naturalistic Driving Study
The SHRP 2 NDS represents the largest naturalistic driving study to date. The study was conducted by Virginia Tech Transportation Institute (VTTI). Drivers in six states (Florida, Indiana, New York, North Carolina, Pennsylvania and Washington) had their vehicles equipped with a Data Acquisition System (DAS) which collected information such as speed, acceleration, GPS data, and radar, as well as four cameras which collected forward, rear, drivers face and over the shoulder video. These equipment captured all of the trips a driver made over a period of six months up to two years. Males and females ages 16 to 98 and older participated in the study. Over the three years of the study approximately 3,400 participants drove over 30 million data miles during 5 million trips(Antin 2013 and VTTI 2014).
1.1.2 Background on SHRP 2 Roadway Information Database
In conjunction with the SHRP 2 Naturalistic Driving Study, another project was
conducted to collect roadway information for the main roads traveled in the NDS. The Center for Research and Education (CTRE) lead the effort which used mobile data collection vans to collect 12,500 center line miles of data across the six states where the NDS was focused. Data collected included information on roadway alignment, signing, lighting, intersection location and types, presence of rumblestrips as well as other countermeasures. In addition to the mobile data collection effort, existing roadway data collected by local agencies were leveraged to increase the data available. Additionally, supplemental data such as crash data, changes to laws, and construction projects were also collected to further strengthen the database (Smadi 2012).
1.2 Previous Research 1.2.1 Factors contributing to run off the road crashes
Previous research has addressed environmental factors, driver factors and to a large extent roadway factors which contribute to run off the road crashes. In the next few sections major research contributions addressing that factors which have been found to affect run off the road crashes and curve negotiation will be addressed. Studies are discussed in chronological order.
1.2.1.1 Roadway
Roadway factors are among the most studied factors affecting roadway departure crashes. This is due to roadway data being largely available and easily accessible. From the literature, it has been found that degree of curve or radius of curve, presence of spirals, distance between curves and shoulder width and type are the most relevant curve characteristics that affect lane negotiation and lane departures.
Zegeer et al. (1991), studied crash rates at 10,900 horizontal rural two lane curves in Washington State. They studied how roadway factors affect these rates and found through their weighted least squares models that crash rates were significantly higher on shaper curves, narrower widths (lane + shoulder), curves without spirals and as the difference between actual super elevation and optimal super elevation increases.
Miaou and Lum (1993) used a Poisson regression model with data on truck crashes from 1985-1989 obtained from five states in the Highway Safety Information System. Models showed a relationship between crash rates the degree of curvature.
Fink and Krammes (1995) found that crash rates increased for curves following long tangent sections as well as very short tangent sections.
Council (1998) used a database containing the same 10,900 curves used by Zegeer et al (1991) and crash data from 1982 to 1986 to model the effect of spirals on curve crash rates. They found based on a logistic regression model using 8,271 records that on level terrain spirals are beneficial on sharper curve (degree of curvature greater than 3 degrees).
Milton and Mannering (1998) used crash frequencies from principal arterials in
Washington State for 1992 and 1993 to create a negative binomial regression model to predict crash frequency. A strong relationship between curve radius and crash frequency was found that as radius increases, crash frequency decreases. It was also found that the longer tangent lengths before the curve led to higher crash frequencies.
A study by Caliendo et al (2007) determined using a negative multinomial regression model built on data from 5 years of crashes on a 4 lane median divided motorway in Italy that both total and severe crashes increase with the length, decreases in curvature, pavement friction and longitudinal slope.
Montella (2009) evaluated crashes occurring from 2001-2005, before and after installation of delineation improvements such as (chevron signs, curve warning signs, and sequential flashing beacons or a combination of all three) on 15 curves in Italy using empirical Bayes. All curves were characterized by a small radius (mean = 365 meters), large deflection angle, and sight distance issues. The study found that increasing delineation with all three of the treatments listed reduced crashes by approximately 47.6%. It also found improved delineation was more effective for smaller radii curves.
A Bayesian semi-parametric estimation procedure was used by Shively et al. (2010) to model counts of crashes on rural two lane roads in the Puget Sound region of Washington State in 2002. A relationship between crashes and curve rates once a radius becomes 1400 feet or less
was found. Their model found that as degree of curve increased from 4 to 12 degrees the expected number of crashes increased by 0.06 crashes. They also found that as curve length increased, the expected number of crashes would also increase.
Location of a curve in relation to other curves was taken into consideration to evaluate the safety of a curve in this study. Spatial considerations of the curves influence the safety of the curves because of the driver’s expectation to encounter additional curves.
A study by Findley et al (2012) highlighted the importance and significance of spatial considerations for the prediction of horizontal curve safety. The study results showed that distance to adjacent curves was a significant factor in estimating the observed collision in a curve. The study revealed that more closely spaced curves had fewer prediction collisions than those curves which were more distant to each other. The study revealed that a series of curves is expected to be safer than a curve which is isolated from other curves.
1.2.1.2 Environmental
Environmental factors, such as the roadway surface condition will also have an impact on a driver’s ability to safely negotiate a curve.
Neuman et al. (2003) found using the 1999 statistics from FARS that for two lane undivided, non-interchange, non-junction roadways that 11% of single vehicle ROR crashes were on wet surfaces, and 3% more occurring when snow or ice were present.
Caliendo et al. (2007) found that both total and severe crashes increased significantly during rain by a factor of 2.7 for total and 3.26 for severe compared to dry using models based on data from 5 years of crashes on a 4 lane median divided motorway in Italy.
McLaughlin et al. (2009) evaluated run-off-road crashes (ROR) and near-crashes in the VTTI 100 car study where 30% of all these crash and near crashes occurred on curves. They
found that ROR events were 1.8 times more likely on wet roads than dry, 7 times more likely on roads with snow or ice than dry roads, and 2.5 times more likely in nighttime versus daytime conditions.
1.2.1.3 Driver
Research on driver factors and behaviors which affect ROR crashes have found age, speeding and distraction to all be contributing factors.
A study by McGwin and Brown (1998) found that older drivers were less likely to have crashes on curves based on an analysis of 1996 crash data from Alabama.
Driver error on horizontal curves is often due to inappropriate speed selection, which results in an inability to maintain lane position. FHWA estimates that approximately 56% of ROR fatal crashes on curves are speed related. A study by Davis et al. (2006) using two case control analyses of ROR crashes from Australia and Minnesota and Bayesian relative risk regression found that 5 out of 10 fatal crashes in Minnesota which they investigated would have been prevented had the driver adhered strictly to the posted speed limit.
Distracting tasks such as radio tuning or cell phone conversations can draw a driver’s attention away from speed monitoring, changes in roadway direction, lane keeping, and detection of potential hazards (Charlton 2007). Other factors include sight distance issues, fatigue, or complexity of the driving situation (Charlton and DePont 2007, Charlton 2007).
McLaughlin et al. (2009) evaluated ROR crashes and near crashes in the Virginia Tech Transportation Institute (VTTI) 100-car naturalistic driving study and found that distraction was the most frequently identified contributing factor, occurring in 40% of all events. Additionally fatigue, impairment, and maneuvering errors also contributed.
1.2.1.4 Exposure
As would be expected, the larger the ADT, the more chances for a lane departure. A study by Caliendo et al (2007) confirmed this with their Negative Multinomial regression model built on data from 5 years of crashes on a 4 lane median divided motorway in Italy that found both total and severe crashes increase as AADT of the curve increases.
1.2.2 Crash Surrogates Related to Roadway Departures
The factors listed above have been determined to affect the crash risk on rural curves. Crashes tend to be rare and the use of crash data to address safety problems is a reactive
approach which is not able to take into account events that lead to successful outcomes (Tarko et al., 2009). Consequently, researchers have proposed use of crash surrogates, as a measure of safety. Additionally, the use of surrogates provides an opportunity to study what happens preceding and following an incident or event.
Time to collision is one of the most common lane departure crash surrogates used. The concept is logical and provides a repeatable and easily understood metric to assess level of crash risk. Risk can be measured as a function of TTC, where at TTC = 0, the subject vehicle and another vehicle/object collide. This makes setting boundaries relatively straightforward. However, it requires one to determine the safety critical event which is not easily defined in roadway departures on curves. As a result other surrogates have been utilized in the research of horizontal curves.
Vehicle lateral placement is one of the operating measures identified as a contributing factor to crash risk on horizontal and used quite extensively in the literature available on rural curve negotiation. In the section below studies which have utilized lateral placement as a surrogate on horizontal curves will be discussed.
1.2.3 Vehicle Path Trajectories and Lateral Position within curves
Previous research has been conducted to develop conceptual models of curve driving. These studies had looked at vehicle path trajectories as a means of evaluating the safety of highway alignments and determining how various factors and countermeasures affect safety. Lateral placement or lane position have been utilized in a majority of studies as a safety surrogate to assess the effectiveness of various countermeasures and safety at curves.
Radius and direction of curve were found to affect lateral position in the curve in studies which developed vehicle path trajectories. Additionally, it was found that most drivers tended to move towards the inside of the curve as they approached the center and therefore flattened the path in which they traveled.
Glennon et al. (1971) mounted a video camera to an observation box on the bed of a truck and used it to capture the path of a study vehicle it was following. Each curve studied was
marked with strips at twenty foot intervals along the centerline. Five non-spiraled curves ranging from two to five degrees were traversed by approximately 100 vehicles. The lateral placement was used at the twenty foot intervals to calculate the instantaneous vehicle path radius. It was found that most vehicles will have a path radius that is less than the highway curve radius at some point in the curve.
Glennon et al. (1985) furthered the work conducted in ‘71 by evaluating lateral positon at six curves in Ohio and Illinois. Cameras were used to collect data in this study and used
pavement reference markers 150 m upstream of the curve as well as at the PC and every 25 feet after. Results from the analysis indicated that drivers drifted towards the inside of the curve as they neared the center.
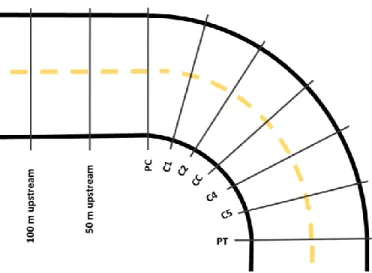
Spacek (1998) developed a model of curve negotiation behavior based on lateral position across seven points in a curve. The data were collected for two-lane roads for curves at least 200 meters from another curve or traffic control. Cameras were used to at collet data at a point upstream and downstream of curves as well as at five locations within a curve for 12 sites during off peak hours during daylight and with good weather.
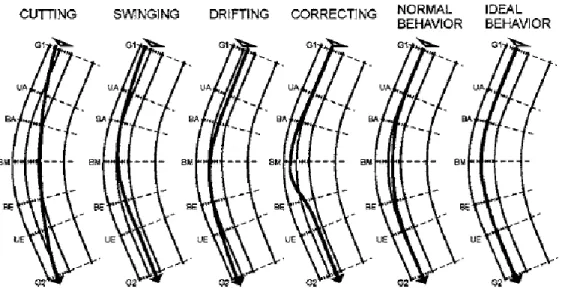
Spline interpolation was used to develop six track profiles which were commonly observed in the field. The models disaggregated curve paths to normal behavior, common intentional lane deviations (cutting and swinging), and two profiles that indicated driver adjustments after misjudging a curve (drifting and correcting). The normal behavior found that drivers tended to drive more towards the inside of the lane, effectively flattening their paths. These paths are shown in Figure 1.1.
Figure 1.1 Models of Curve Negotiation Developed by Spacek (1998) Felipe and Navin (1998) also evaluated lateral placement through curves using an instrumented vehicle along a two-lane mountainous road and found that vehicles mostly
that drivers in both directions followed a flattened path to minimize speed change. They report that variation in path selection was a function of road geometry, surrounding traffic and the driver. They also found that drivers limited speed on curves with small radii based on comfortable lateral acceleration, which corresponded to 0.35 to 0.4g.
A study by Räsänen (2005) used a before and after analysis at a curve in Finland whose pavement markings were worn out and then replaced. Additionally two months after the initial repainting, centerline rumblestrip were also added. Unobtrusive video cameras were used to determine the lateral position through the curve. It was found that oncoming vehicles shifted drivers towards the shoulders by 15-20 cm. Results also indicated that the standard deviation of lateral position decreased from 35 cm to 28 cm with repainting of centerline and 24 cm after the rumble strips were added. Additionally, encroachments decreased from 7.3% to 4.2% and then with rumblestrips to 2.4%.
Levison et al. (2007) developed a driver vehicle module to use with the Interactive Highway Safety Design Model. One component of this model was path selection which assumes the drivers desired path profile is one where drivers drive the curve as if it had a larger radius than it does.
Gunay and Woodward (2007) collected data on traffic flow at five roundabout and three horizontal curve sites in Northern Ireland in 2005 using a camcorder that was hidden from sight as much as possible. Software was used to determine a vehicles lane position from the lane line. They found that on horizontal curves, driver path shifted towards the inside of the curve, with the shift increasing with decreasing radii.
Stodart and Donnell (2008) collected data upstream and within six curves using instrumented vehicles with 16 research participants during nighttime conditions. They used
ordinary least squares regression and compared change in lateral position from the upstream tangent to the curve midpoint and found curve radius and curve direction had the largest effect on changes in lateral position between the tangent and midpoint of the curve.
Ben-Bassat and Shinar found similar findings in a study conducted in a driving simulator in 2011. 11 male and 11 female undergraduate students drove through a mixture of tangent and curved sections of differing radii with various shoulder widths and guardrail presence on divided four lane roads. They found as radii of curves decreased, drivers tended to deviate in their lane more than in large radii curves and tangent sections.
Most recently, Fitzsimmons et al. (2014) modeled vehicle trajectories using mixed effects models for a rural and an urban curve in Iowa. Pneumatic road tubes were used to collect lateral position of the vehicles at 5 points throughout each curve. Similar to the Spacek study, it was found that most vehicles tended to traverse the curve as if the radius was larger than the design radius of the curve and therefore tended to travel towards the inside of the curve as they
approached the center. The study also found that time of day, direction of curve and vehicle type all affected lateral positon in the curve.
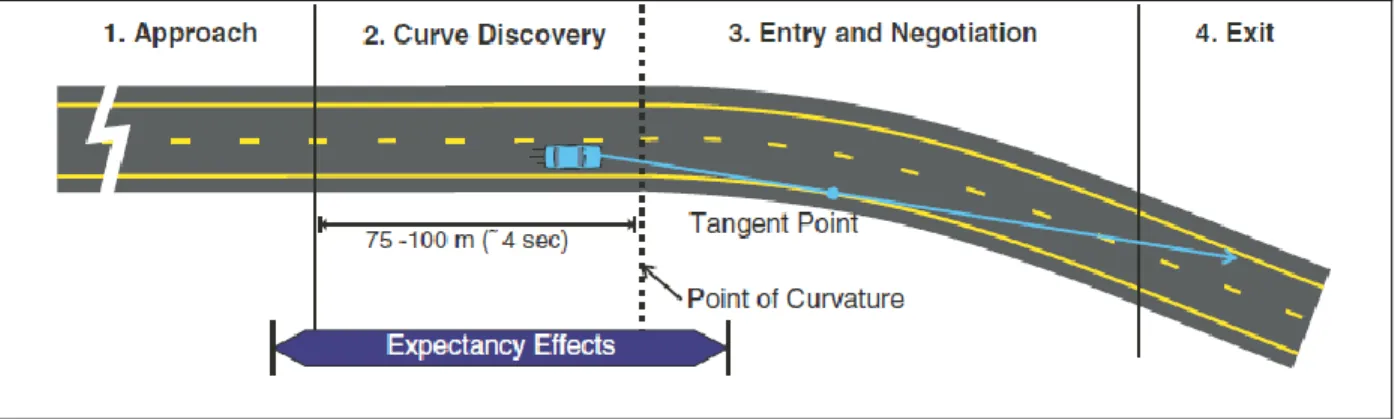
Campbell et al. (2012) also created a model of conceptual curve driving breaking the driving task through a curve into four areas (approach, curve discovery, entry and negotiation, and exit) which require different levels of attention and driving tasks as shown in Figure 1.2. Driving tasks during the approach include scanning for visual cues to locate the curve (i.e. signing), obtaining speed information from signing, and making initial speed adjustments. During this phase, visual demand is low and driver workload to maintain position is low. In curve discovery, drivers use visual and roadway cues (i.e. delineation) to determine the amount sharpness, assess roadway conditions, make necessary speed and steering adjustment to enter
curve. At this point, driver workload is moderate but increases to just after the PC. Drivers at the entry and negotiation state use visual and roadway cues (i.e. chevrons) to adjust their speed based on curvature and steering to maintain safe lane position. The primary cues for a driver to adjust speed and position are lateral acceleration and vehicle handling. Driver visual demand and workload are high as drivers adjust speed and trajectory to stay within their lane with higher demands for curves with shorter radii and narrow lane width. At the exit point, drivers use visual and roadway cues (i.e. termination of chevrons) to adjust back to the tangent speed or prepare for negotiation of a subsequent curve. At this point visual demand is low and driver workload is moderate.
Figure 1.2 Curve Negotiation as Defined by Campbell et al. (2012) 1.2.4 Summary
The studies discussed in this section have provided information regarding what curve characteristics are most relevant and driver behaviors which contribute to crashes on curves, and which factors affect vehicle paths through curves; yet information is lacking. These studies in general have focused on looking at larger samples of traces across a small set of curves to determine how driver’s behavior differs across those few curves. Having a limited sample size allows them to determine how drivers path varies based off roadway characteristics such as radius or things such as time of day. They do not however determine the general driving
behavior of drivers on curves across various states and curve types and how driver behaviors such as glances and distraction affect negotiation. Having a better understanding of how drivers interact with various roadway feature and countermeasures in different environments in
determining vehicle paths will provide information to decision makers in determining how to best allocate limited resources to reduce crashes on curves. The Strategic Highway Research Program 2 (SHPR 2) Naturalistic Driving Study (NDS) and Roadway Information Database (NDS) provide a unique dataset which allow for one to develop models which give insight into how the roadway, environment and driver interact when negotiating horizontal curves.
1.3 Problem statement
The objective of this research is to develop models which provide a better understanding of how drivers traverse curves looking at smaller samples of traces per curve over a larger sample of curves and drivers in order to gain insight into areas which lead to run off the road crashes and ways in which to mitigate these areas. The ultimate goal of this research is to help to reduce fatal crashes on our roads. Roadway departure crashes on curves account for a large percentage of the total fatal crashes, so by reducing these we can help reduce fatal crashes. Countermeasures such as adding paved shoulders, installing chevrons or rumble strips have been found to help reduce crashes on horizontal curves. In order to be able to efficiently and effectively use countermeasures on horizontal curves, a better understanding of how they affect drivers’ negotiation of curves based on roadway, environmental and driver factors so we can tailor the installation of each to situations where they will provide the best safety benefit. Additionally, by having a better understanding of how drivers traverse curves normally and situations which lead to lane departures, technologies that are developed or are being developed can be improved upon by the insight provided. These technologies provide potentially the
greatest opportunity to reduce crashes as they remove or reduce the driver decision making. As driver error is a cause in the majority of crashes, removing the chance for driver error should lead to a reduction in crashes.
The models developed will help to address the three research questions outlined below. 1.3.1 Research Question 1: How do drivers normally negotiate a single isolated horizontal curve?
A conceptual model of curve driving will be developed to assess changes in metrics as the driver negotiates the curve. Understanding how a driver normally negotiates a curve provides insight not only into how characteristics of the roadway, driver, and environment influence driving behavior, but also into areas that can lead to roadway departures. Knowing how much drivers normally deviate in their lane as well as how they choose their speed could potentially have implications on policy or design.
A conceptual model will be developed based off past work for isolated curves only (i.e. curves with at least 300 meters between them). The models that were previously modeled differed slightly in approach, but had similar findings. Radius and direction of curve were found to affect lateral position in the curve and models were developed to look at changes in lateral position between upstream and center of the curve or at points (five to seven) within the curve (Spacek 1998, Felipe and Navin, 1998, Stodart and Donnell 2008, Fitzsimmons et al. 2013). These previously developed models of rural curve driving have taken into account roadway, environmental, and to a limited extent driver factors yet none have taken into account driver behavior and how distraction can affect lateral position. This study expands on these previous models by also including additional driver and environmental factors.
A model will be developed for the inside or right curve and outside/left curve to determine lateral position throughout the curve as at points as a driver negotiates their way through using the NDS and RID data. Vehicle offset from the center of the lane will be used as the dependent variable in the model. Key factors which will be used in the analysis include:
Roadway factors: Curve Radius, length of curve, superelevation, distance between curves, presence of countermeasures (i.e. chevrons, rumble strips, raised pavement markings, curve advisory signs), direction of the curve, and the speed limit upstream and within the curve
Environmental factors: Time of day, surface condition (wet, dry, snow), pavement condition, lane marking condition, the visibility, if driver is following another vehicle, if driver is passing other vehicles
Driver factors: age, sex, distractions, glance location, and vehicle type 1.3.2 Research Question 2: How do drivers negotiate horizontal curves?
The second objective of this research is to expand the work from Research Question 1 to include other horizontal curves such as S-curves or other non-isolated curves. Additional data will be incorporated which may strengthen the models and allow for random effects to be captured and results to be applicable to more situations. Additional variables on whether the curve is an S-curve and if so which curve (first encountered or second encountered) will also be included in the analysis. If enough instances of lane departure are present they will also be incorporated into the model to determine how curve negotiation changes in cases of lane departure.
1.3.3 Research Question 3: Which factors increase the likelihood of a lane departure? The third objective of this research is to develop a model which will determine which driver, roadway and environmental factors affect the probability of a lane departure. This will be
accomplished by using the baseline NDS data along with data in which lane departures occur. The following factors will be explored in the analysis:
common roadway characteristics: radius of curve, length of curve, superelevation, direction of curve, upstream and curve advisory (if present) speed limits,
countermeasures(i.e. rumblestrips, chevrons, RPMS, guardrail)
kinematic driving factors: driver’s glance locations, presence of distractions, vehicle offset, speed and acceleration upstream and at various points in the curve
traditional environmental factors: time of day, weather conditions, and visibility
exposure factors: presence of oncoming vehicles, if driver is following another vehicle Additionally, if any kinematic factors are included in the model, an attempt to develop additional models that predict these values based off upstream driving conditions will be developed. These will provide a means of predicting probability of the lane departure upstream from the driver entering the curve thereby leaving time to warn drivers of the potential for the lane departure.
1.4 Study limitations
The author would like to note early on that there were a few major limitation of the research due to the fact that it was being conducted while the NDS and RID data collection were taking place. Among these are data accuracy issues, limited sample size, and use of surrogates.
Data accuracy issues included significant noise being present in variables such as offset, which is expected for large-scale data collection of this nature. It was also due to issues with the
machine learning algorithm used in the DAS which depends on lane lines or differences in contrast between the roadway edge and shoulder in order to establish the position. When discontinuities in lane lines occur, offset is reported with less accuracy. Discontinuities occur due to lane lines being obscured or not visible, natural breaks being present in lane lines (e.g., turn lanes, intersections), or visibility being compromised in the forward roadway view. A moving average used to smooth the data helped to reduce some noise, but could not account for large distances of not accurate lane lines. Additionally it should be noted that the fact that offset data were more accurate for highly visible lane lines may lead to some inherent bias in our data samples, which could be addressed with larger samples sizes to include a more equal distribution of highly visible, visible and obscured lane lines.
In other cases, variables of interest were not sufficiently available to be utilized. For instance steering wheel variability would have been helpful for looking at driver’s reaction or drowsiness, but was not available for a majority of the data provided. Additionally, although a passive alcohol detector was present, at the time data were collected it did not appear to be reliable enough to identify potential intoxicated drivers. Radar data were also included in the data, but QA/QC had not been conducted, so it could not be included in the analysis.
Additionally, the quality of the driver face video was not always clear enough to be able to see the pupil. This especially occurred at night and when the driver was wearing sunglasses. In these cases driver’s head position was used to measure approximate glance location, which may have led to missing some of the more subtle glances such as looking at the rear-view mirror or at the steering wheel. These traces were still included in order to have an adequate sample size and to be able to include night driving as it was thought that missing these subtle glances would not significantly alter the results.
Sample size limitations were due to only one third of the data being available, as well as time and budget constraints limited how much data could be reduced (specifically driver glance data). Accuracy issues with the offset variable, which were described previously, also
significantly reduced the samples for these studies as accurate offset was required. Approximately 10% of the data reduced had accurate enough offset to be included in the analysis. The limited sample size also limited the amount of driver and roadway characteristic which could be included. For instance while a large sample of curves with rumblestrips were requested, only two curves which we had reduced data for had rumblestrips. Having a larger sample size would have helped to answer questions that had hoped to be answered in the course of the study but were unable to be determined. For instance with enough data it is thought that the effect of countermeasures such as rumblestrips or chevrons could be determined.
Finally, as crash and near crash data were not available at the time the data for these studies was collected, the use of surrogates was required for the analysis. While surrogates provide some expected correlation with crashes, the exact relationship was not able to be established. Therefore the results of the research cannot be translated to risks of crashes, but to risks of lane encroachments. Having adequate data on the crashes and near crashes would allow one to develop this relationship.
1.5 Study implications
These conceptual models, which will be among the first developed using the SHRP 2 NDS, will advance understanding by providing valuable insight into the interaction and effect that roadway attributes and countermeasures (i.e. chevrons, pavement markings, rumblestrips), driver behaviors and attributes (i.e. distraction, speed and age), and environmental factors (i.e. day vs night or low visibility) have on drivers lateral lane position throughout a curve. It will also
provide information on how drivers typically traverse curves. The results of these models can be used by States in developing their performance measures and performance targets in their Strategic Highway Safety Plans by helping to select countermeasures more appropriately and provide areas to target education.
The predictive lane departure model will help gain insight into which driver behaviors are safety critical. The model may also provide data to include in lane departure warning systems or curve speed warning technologies that have not previously been included. Most current lane departure warning systems utilize cameras which track the lane line along with algorithms which predict the likelihood of a lane departure. The model developed as part of question 3 may
provide information on how roadway features and driver behavior in the upstream affect the probability of a lane departure and could predict before even entering the curve if the driver is likely to depart their lane in that curve. The long-term impact of these technologies being in passenger cars is that they could result in a large decrease in lane departure resulting in crashes as it takes away opportunities for driver error in deciding their risk of a lane departure.
1.6 Organization of the Dissertation
This dissertation contains five chapters. Chapter 1 introduced the problem of lane departures on rural curves. It also contained the review of existing literature related to curve negotiation and risks associated with lane departures. Chapter 2 addresses research question 1. The development of a conceptual model of rural curve driving on isolated rural curves using the SHRP 2 NDS is represented in this chapter, Chapter 3 expanded on the work conducted in Chapter 2 to include a larger sample size of curves and drivers as well as traces where lane encroachments occur. Chapter 4 presents results of a study that used a slightly expanded data set from chapter 3 to develop a model to predict the likelihood of lane encroachments as well as
models to predict input variables to this model. This chapter address research question 3. For the papers contained in Chapters 2-4, Nicole served as the main author and performed the major analysis. The additional authors provided additional expertise in determining and conducting the data reduction process, the statistics to use, and the method for the driver kinematic data
reduction. Chapter 5 provides conclusions and main contributions of this dissertation, limitations of the studies and recommendations for future research.
1.7 Additional Contributions
In addition to the work presented in the dissertation, additional contributions were made on the same topic. One of these contributions was second author on an official SHRP 2 report that was peer-reviewed multiple times by a variety of reviewers. The work done as part of this SHRP 2 project has been presented multiple times across the country as well as internationally. Additionally, a paper was accepted to the Journal of Safety Research which will be published in the near future in which I am an author.
1.8 References
AASHTO. Driving Down Lane-Departure Crashes: A National Priority. American Association of State Highway and Transportation Officials, Washington, D.C., 2008.
Antin, J. Technical Coordination & Quality Control (S06). Presented at the 8th SHRP 2 Safety Research Symposium, Washington D.C., 2013.
Ben-Bassat, T., and D. Shinar. Effects of shoulder width, guardrail and roadway geometry on driver perception and behavior. Accident Analysis and Prevention. Vol 43. Issue 6, 2011, pp 2142-2152.
Campbell, J.L., M.G. Lickty, J.L. Brown, C.M. Richard, J.S. Graving, J. Grahm, M. O’Laughlin, D. Torbic, and D. Harwood. Chapter 6: Curves (Horizontal Alignment). NCHRP Report 600. Human Factors Guidelines for Road Systems, Second Edition. Transportation Research Board of the National Academies. Washington DC. 2012.
Caliendo, C., M, Guida, and A. Parisi. A crash-prediction model for multilane roads. Accident Analysis and Prevention. Vol 39. Issue 4, 2007, pp 657-670.
Charlton, S.G. The role of attention in horizontal curves: A comparison of advanced warning, delineation, and road marking treatments. Accident Analysis and Prevention. Vol 39, Issue 5. 2007, pp 873-885.
Charlton, S.G., and J.J. DePont. Curve Speed Management. Land Transport New Zealand Research Report 323. Land Transport New Zealand, Wellington, New Zealand, 2007. Council, F.M. Safety Benefits of Spiral Transitions on Horizontal Curves on Two-Lane Rural
Roads. Transportation Research Record: Journal of the Transportation Research Board, No. 1635, 1998, pp. 10–17.
Davis, G., S. Davuluri, and J. Ping Pei. A Case Control Study of Speed and Crash Risk, Technical Report 3, Speed as a Risk Factor in Run-off Road Crashes. Center for Transportation Studies. Minnesota, 2006.
Findley, D.J., J.E. Hummer, W. Rasdorf, C.V. Zegeer and T.J. Fowler. Modeling the impact of spatial relationships on horizontal curve safety. Accident Analysis and Prevention. Vol 45, Issue 0, 2012, pp 296-304.
Felipe, E. and F. Navin. Automobiles on Horizontal Curves: Experiments and Observations. Transportation Research Record: Journal of the Transportation Research Board, No. 1628, 1998, pp. 50–56.
FHWA. FHWA Roadway Departure (RwD) Strategic Plan. Federal Highway Administration, Washington D.C., 2013.
Fink, K.L., and R.A. Krammes. Tangent Length and Sight Distance Effects on Accident Rates at Horizontal Curves on Rural Two-Lane Highways. Transportation Research Record: Journal of the Transportation Research Board, No. 1500, 1995, pp. 162–168. Fitzsimmons, E., V. Kvam, R.R. Souleyrette, S.S. Nambisan, and D.G. Bonett. Determining
Vehicle Operating Speed and Lateral Position along Horizontal Curves Using Linear Mixed-Effects Models. Traffic Injury Prevention, Vol. 14, Issue, 3, 2013, pp. 309-321. Glennon, J.C., and G.D. Weaver. The Relationship of Vehicle Paths to Highway Curve Design.
Texas Transportation Institute. Texas. 1971.
Glennon, J.C., T.R. Neuman, and J.E. Leisch. Safety and Operational Considerations for Design of Rural Highway Curves. Report FHWA/RD-86-035. Federal Highway Administration, Washington, D.C., 1985.
Gunay, B. and D. Woodward. Lateral Position of traffic negotiating horizontal bends. Transport 160. Issue TRI, 2007, pp 1-11.
Hallmark, S.L., N. Oneyear, S. Tyner, B. Wang, C. Carney and C. McGehee. SHRP 2 S08D: Analysis of the SHRP 2 Naturalistic Driving Study Data. Strategic Highway Research Program 2, Transportation Research Board, Washington, D.C., 2015a.
Hallmark, S.L., S. Tyner, N. Oneyear, C. Carney, and D. McGehee. Evaluation of Driving Behavior on Rural 2-Lane Curves using the SHRP 2 Naturalistic Driving Study Data. Journal of Safety Research. Manuscript accepted for publication, 2015b.
Lamm, R., E. M. Choueiri, J.C. Hayward, and A. Paluri. Possible Design Procedure to Promote Design Consistency in Highway Geometric Design on Two-Lane Rural Roads.
Transportation Research Record: Journal of the Transportation Research Board, No. 1195, 1988, pp. 111–122.
Levison, W.H., J.L. Campbell, K. Kludt, A.C. Vittner Jr., I. Potts, D. Harwood, J. Hutton, D. Gilmore, J.G. Howe, J.P. Chrstos, R.W. Allen, B. Kantowitz, T. Robbins, and C.
Schreiner. Development of a Driver Vehicle Module (DVM) for the Interactive Highway Safety Design Model (IHSDM). Federal Highway Administration. Report FHWA-HRT-08-019. November 2007.
McGwin G., and D.B. Brown. Characteristics of traffic crashes among young, middle-aged and older drivers. Accident Analysis and Prevention. Vol 31. Issue 3, 1995, pp 181-198. McLaughlin, S.B., J.M. Hankey, S.G. Klauer, and T.A. Dingus. Contributing Factors to
Run-Off-Road Crashes and Near-Crashes. Report DOT HS 811 079.National Highway Traffic Safety Administration, Washington, D.C., 2009.
Miaou, S.-P., and H. Lum. Statistical Evaluation of the Effects of Highway Geometric Design on Truck Accident Involvements. Transportation Research Record: Journal of the
Transportation Research Board, No. 1407, 1993, pp. 11–24 .
Milton, J. and F. Mannering. The Relationship among Highway Geometric, Traffic-Related Elements, and Motor-Vehicle Accident Frequencies. Transportation, Vol. 25, 1998, pp. 395–413.
Neuman, T.R., R. Pfefer, K.L. Slack, K.K. Hardy, F. Council, H. McGee, L. Prothe, and K. Eccles. Guidance for Implementation of AASHTO Strategic Highway Safety Plan, Volume 6: A Guide for Addressing Run-Off-Road Collisions. NCHRP Report 500. Transportation Research Board of the National Academies, Washington DC. 2003. Preston, H. Low-Cost Treatments for Horizontal Curve Safety. PowerPoint presentation from
FHWA webinar, 2009.
Räsänen, M. Effects of a rumble strip barrier line on lane keeping in a curve. Accident Analysis and Prevention. Vol 37, Issue 3, 2005, pp 575-581.
Shively, T.S., K. Kockelman, and P. Damien. A Bayesian semi-parametric model to estimate relationships between crash counts and roadway characteristics. Transportation Research Part B. Vol 44, pp. 699-715. 2010.
Smadi, O. SHRP 2 S-04A Roadway Information Database Development and Technical
Coordination and Quality Assurance of the Mobile Data Collection Project. Presented at the 7th SHRP 2 Safety Research Symposium, Washington D.C., 2012.
Spacek, P. FahrverhaltenunUnfallgeschehen in Kurven, Fahrverhalten in Kurvenbereichen. InStitutFürVerkehrsplanung, Transporttechnick, Strassen- unEisenbahnbaur, ETH Zürich, 1998.
Stodart, B.P. and E.T. Donnell. Speed and Lateral Position Models from Controlled Nighttime Driving Experiment. ASCE Journal of Transportation Engineering, Vol. 134, No. 11, 2008, pp. 439–449.
Tarko, A., Davis, G., Saunier, N., Sayed, T., & Washington, S. Surrogate measures of safety. TRB Annual Meeting White Paper. Washington, DC. 2009.
VTTI. InSight Data Access Website SHRP 2 Naturalistic Driving Study. https://insight.shrp2nds.us/. Accessed July 31st, 2014.
Zegeer, C.V., J.R. Stewart, F.M. Council, and D.W. Reinfurt. Safety Effects of Geometric Improvements on Horizontal Curves, University of North Carolina, Chapel Hill, NC, 1991.
CHAPTER 2: DEVELOPMENT OF A CONCEPTUAL MODEL OF CURVE
DRIVING FOR ISOLATED RURAL TWO LANE CURVES USING SHRP 2
NATURALISTIC DRIVING DATA
Modified from a paper to be published in the conference proceedings of the 5th International
Symposium on Highway Geometric Design
Nicole Oneyear, Shauna Hallmark, Samantha Tyner, Daniel McGehee and Cher Carney
Abstract
Approximately 27% of all fatalities in 2008 occurred on horizontal curves. Of these, over 80% were run off the road crashes, with the majority of these fatal crashes occurring on rural two lane highways. Consequently, run off the road crashes on rural highway curves present a
significant safety concern. Therefore addressing lane-departure crashes on rural curves is a priority for National, State, and local roadway agencies. Much research has been conducted to look at how roadway factors, such as radius and shoulder width and environmental factors, such as weather affect crashes, yet limited research has been conducted looking at how driver
behaviors affect crash risk.
This paper utilizes data from the SHRP 2 Naturalistic Driving Study (NDS) and Roadway Information Datasets (RID) to present interim results on the develop a conceptual model of normal curve driving on isolated rural two lane curves that explores how drivers interact with the roadway environment. This includes driver, roadway, and to limited extent environmental
conditions. The model helps identify zones where driver are more likely to have lane departures. Times series data, at the level of 0.1 second were used as the data input. Models were developed using generalized least squares with offset of the center of the vehicle from the center of the lane as the dependent variable. Models for both inside (right-hand curve from the
perspective of the driver) and outside (left-hand curve from the perspective of the driver), were developed. Results indicate that lane position within the curve is influenced by lane position
upstream of the curve, drivers glancing down, age, shoulder width, pavement delineation, presence of curve advisory signs, as well as distance into the curve.
2.1 Introduction
Approximately 27% of all fatalities in 2008 occurred on horizontal curves. Of these, over 80% were run off the road crashes, with the majority of these fatal crashes occurring on rural two lane highways (1). Additionally, research has found that the crash rate on curves is
approximately three times the rate on tangent sections (2). Consequently, run off the road crashes on rural horizontal curves present a significant safety concern.
The objective of this paper was to understand how a driver negotiates a curve normally. Normal driving is defined as no lane line crossings, crashes, or conflicts. This was done by developing a conceptual model of curve driving on rural two lane curves utilizing the SHRP 2 Naturalistic Driving Study (NDS) and Roadway Information Database (RID).
A better understanding of the interaction between driver characteristics and curve negotiation needs can potentially lead to better design and application of countermeasures. For instance, if older drivers have the hardest time with curve negotiation because they are less likely to see visual cues, the best solution might be larger chevrons. On the other hand, a solution geared towards younger drivers might include more closely spaced chevrons to help drivers gauge the sharpness of the curve. Distracted drivers would perhaps require another solution, such as a tactile cue from transverse rumble strips.
Studies of roadway factors, such as degree of curve (3,4,5,6), presence of spirals (7), or shoulder width and type (8), have provided some information regarding the most relevant curve characteristics, but information is still lacking. In addition, little information is available that identifies driver behaviors that contribute to curve crashes. As a result, a better understanding of
how drivers interact with various roadway features and countermeasures may provide valuable information to highway agencies for determining how resources can best be allocated in order to prevent potential lane departures and reduce crashes.
2.1.1 Background on SHRP 2 Naturalistic Driving Study
The SHRP 2 NDS is the largest naturalistic driving study to date. The study was conducted by Virginia Tech Transportation Institute (VTTI). Drivers in six states (Florida, Indiana, New York, North Carolina, Pennsylvania and Washington) had their vehicles equipped with a Data Acquisition System (DAS) which collects information such as speed, acceleration, and GPS data, as well as four cameras which collected forward, rear, drivers face and over the shoulder video. These equipment captured all of the trips a driver made over a period of six months up to two years. Males and females ages 16 to 98 participated in the study. Over the three years of the study approximately 3,300 participants drove over 30 million data miles over 5 million trips (9,10).
2.1.2 Background on SHRP 2 Roadway Information Database
In conjunction with the SHRP 2 Naturalistic Driving Study, another project was
conducted to collect roadway information for the main roads traveled in the NDS. The Center for Research and Education (CTRE) led the effort which used mobile data collection to collect 12,500 centerline miles of data across the six states where the NDS was focused. Data collected included information on roadway alignment, signing, lighting, intersection location and types, presence of rumblestrips and other countermeasures. In addition to the mobile data collection effort, existing roadway data collected by local agencies was leveraged to increase the data available. Additionally, supplemental data such as crash data, changes to laws, and construction projects were also collected to further strengthen the database (11).
2.2 Previous Research
Limited research has been conducted to develop conceptual models of curve driving. Models developed differed slightly in approach, but had similar findings. Radius and direction of curve were found to affect lateral position in the curve. Additionally, it was found that most drivers tended to move towards the inside of the curve as they approached the center and
therefore flattened the path in which they traveled. The approaches of five models are discussed in further detail.
Spacek (1998) developed a model of curve negotiation behavior based on lateral position across seven points in a curve. Spline interpolation was used to develop six track profiles which were commonly observed in the field. The models disaggregated curve paths to normal behavior, common intentional lane deviations (cutting and swinging), and two profiles that indicated driver adjustments after misjudging a curve (drifting and correcting). The normal behavior found that drivers tended to drive more towards the inside of the lane, effectively flattening their paths (12).
Felipe and Navin (1998) also evaluated lateral placement through curves using an instrumented vehicle along a two-lane mountainous road and found that vehicles mostly
followed the center of the lane for both directions with large radii. With smaller radii, they found that drivers in both directions followed a flattened path to minimize speed change. They report that variation in path selection was a function of road geometry, surrounding traffic and the driver (3).
Stodart and Donnell (2008) collected data upstream and within six curves using instrumented vehicles with 16 research participants during nighttime conditions. They used ordinary least squares regression and compared change in lateral position from the upstream
tangent to the curve midpoint and found curve radius and curve direction had the largest effect on changes in lateral position between the tangent and midpoint of the curve (4).
Fitzsimmons et al (2014) modeled vehicle trajectories using mixed effects models for a rural and an urban curve in Iowa. Pneumatic road tubes were used to collect lateral position of the vehicles in 5 points throughout each curve. Similar to the Spacek study(12), it was found that most vehicles tended to traverse the curve as if the radius was larger than the design radius of the curve and therefore tended to travel towards the inside of the curve as they approached the center. The study also found that time of day, direction of curve and vehicle type all affected lateral positon in the curve (13).
Levison et al. (2007) developed a driver vehicle module to use with the Interactive Highway Safety Design Model. One component of this model was path selection and was assumes the drivers desired path profile is one that drivers the curve as if it had a larger radius than it does (14).
Previously developed models of driving on rural curves have taken into account roadway, environmental, and to a limited extent driver factors yet none have not taken into account driver behavior and how distraction can affect lateral position. This papers hopes to expand on these previous models by also including additional driver and environmental data as well as studying a larger number of curves.
2.3 Methodology
Data were acquired from two main sources, unless noted otherwise. These were the SHRP 2 Naturalistic Driving Study (NDS) and the SHRP 2 Roadway Information Database (RID). The NDS included time series data collected through a data acquisition system (DAS), as well as video data collected from 4 cameras placed in the vehicle which captured the forward
view, rear view, driver’s face and over the shoulder. As the driver’s face and over the shoulder video contained potentially identifying information, these data were viewed and information reduced at the secure enclave housed at VTTI.
2.3.1 Identification of Curves of Interest
At the time this project was conducted, the NDS and RID had not been linked. As a result, the team manually identified curves of interest and then requested any trips on these curves from the NDS. To identify potential curves of interest, the project team made use of weighted trip maps. VTTI prepared trip maps used a subset of trip data in the early stages of the NDS data collection. Trips were overlain with a roadway database and showed an estimate of where trips were likely to have occurred. The trip maps were overlain with the RID and rural 2-lane curves on paved roadways were identified. A one-half mile tangent section upstream and downstream of each curve was also selected. Curves were identified in all states except for Washington since much of the roadway mileage was urban.
A spatial buffer (polygon) was created around each curve. In some cases curves were located near one another and multiple curves were included in a single buffer. The buffers were provided to VTTI and were overlain with the NDS. If a trip fell within a buffer and met certain criteria (i.e. GPS data present, speed data present, etc.) then it became a potential event (one trip through one buffer) to use in the analysis. At the time of the data request, around one-third of the NDS data had been processed and were available. The initial query resulted in around 4,000 traces (one trip through one buffer). Each trace was reviewed and traces where a needed variable was not present or reliable were removed from further consideration. Once these traces were removed, a total of 987 events across 148 curves were selected to represent a good cross-section
of curve and driver characteristics. Further details on how the data were requested can be seen in the SHRP2 S08D Final report (15).
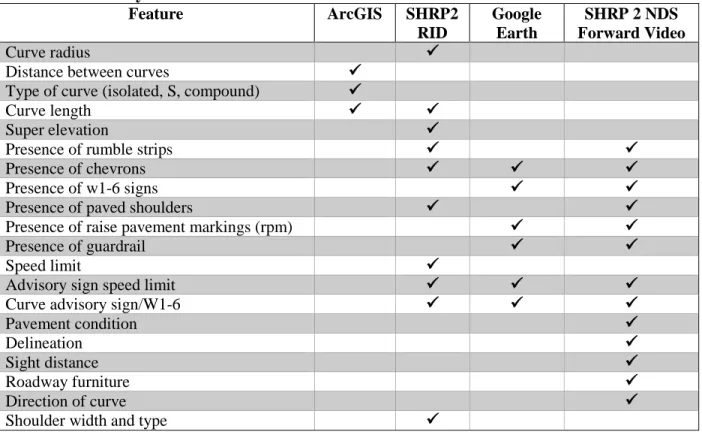
2.3.2 Data Collection and Data Reduction 2.3.2.1Roadway Variables
Roadway variables were extracted for the 148 curves using the RID data when available. In some cases a variable was not collected, and in other cases the RID was not available for the study segment because the RID did not cover all roads in the NDS. When the information was not available through the RID, other sources were used to manually extract the data. These additional sources were also used to confirm data collected through the RID, such as speed limit and advisory speed limit.
ArcGIS was used to measure distances between curves using the PC included in the RID. ArcGIS was also used to determine whether the curve was an S-curve or a compound curve based on the distance between curves and direction of curves.
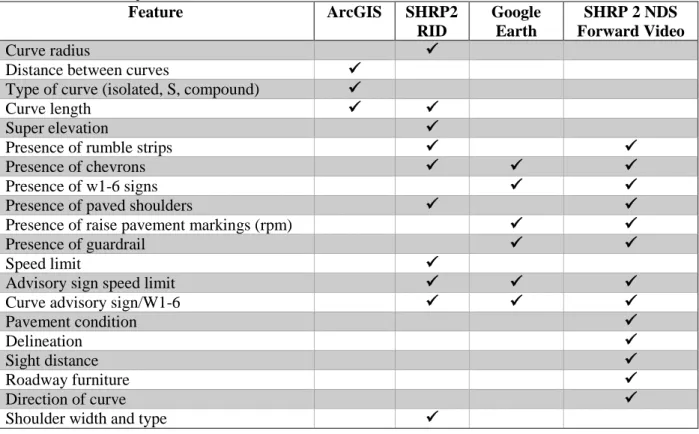
Google Earth was used to extract the roadway features not included in the RID. It was also used to collect countermeasures before the forward video was available, such as chevrons and RPMs, which were later confirmed with the NDS forward video. Radius was provided for most curves in the RID and was reported as radius by lane. When RID data were not available, which only included a few curves in Florida, radius was measured using aerial imagery and the chord-offset method. This method was verified using curves with known radii. NDS forward video was used to determine subject measures for delineation, pavement condition, roadway lighting, and roadway furniture (which describes objects around the road that provide some measure of clutter). Variables collected are shown in Table 2.1.
Table 2.1 Roadway Variables Extracted and Main Source Feature ArcGIS SHRP2 RID Google Earth SHRP 2 NDS Forward Video Curve radius
Distance between curves
Type of curve (isolated, S, compound)
Curve length
Super elevation
Presence of rumble strips
Presence of chevrons
Presence of w1-6 signs
Presence of paved shoulders
Presence of raise pavement markings (rpm)
Presence of guardrail
Speed limit
Advisory sign speed limit
Curve advisory sign/W1-6
Pavement condition
Delineation
Sight distance
Roadway furniture
Direction of curve
Shoulder width and type
2.3.2.2 Vehicle, Traffic, Static Driver and Environmental Variables
Each of the traces or events represents one driver trip through a selected roadway segment. One spreadsheet (containing DAS data), one forward video, and one rearview video were provided by VTTI for each trace. Each row of data represents 0.1 seconds, and spatial location was provided at one-second intervals. A time stamp was also provided to link the various videos with the DAS data. A list of the main DAS variables provided and used in the analysis include the following:
Acceleration, x-axis: vehicle acceleration in the longitudinal direction vs. time
Acceleration, y-axis: vehicle acceleration in the lateral direction vs. time
Lane markings, probability, left/right: Probability that vehicle based machine vision lane marking evaluation is providing correct data for the left/right side lane markings