Working Paper/Document de travail
2008-11
An Examination of Canadian Firms
Delisting from U.S. Exchanges
Bank of Canada Working Paper 2008-11
April 2008
An Examination of Canadian Firms
Delisting from U.S. Exchanges
by
Jonathan Witmer
Financial Markets Department Bank of Canada
Ottawa, Ontario, Canada K1A 0G9 [email protected]
Bank of Canada working papers are theoretical or empirical works-in-progress on subjects in economics and finance. The views expressed in this paper are those of the author.
Acknowledgements
I would like to thank Toni Gravelle, Teodora Paligorova, Zhaoxia Xu, Scott Hendry and seminar participants at the Bank of Canada for helpful comments and advice. Thanks to Louis Gagnon, Craig Doidge, Kee-Hong Bae, Andrew Karolyi, Mike Welker, and seminar participants at the FMA, Queen’s University, Ryerson University, and the University of Alberta for helpful comments and suggestions on an earlier version of this paper.
Abstract
This paper examines Canadian and other foreign firms that have been involuntarily delisted from major U.S. exchanges. I find that, for most countries, less than 10% of firms get delisted from a U.S. exchange during my sample period. For Canada, more than 25% of firms listed in the United States get involuntarily delisted. This effect is more pronounced in Nasdaq-listed firms, where more than 40% of Canadian firms eventually get delisted, compared to about 15% of other foreign firms. After controlling for firm characteristics that have an impact on involuntary delistings, such as size, exchange listing, previous year’s return, volatility, and leverage, Canadian firms still have a higher propensity to get delisted than other foreign cross-listed firms. However, in a comparison to a U.S. matched sample, there is no statistically significant difference in the likelihood of Canadian firms being delisted, relative to these U.S. firms. These results suggest that Canadian firms may have been treated more similarly to U.S. firms under the U.S. exchanges’ rules and enforcement of their continued listing criteria, and that the bonding provided by U.S. exchanges may be stronger for Canadian and U.S. firms. Also, Canadian firms may have fewer impediments to listing in the United States such that small, high-growth Canadian firms have been more able to access U.S. markets compared to foreign firms.
JEL classification: G30, G38
Bank classification: Financial markets; International topics
Résumé
L’auteur étudie les sociétés canadiennes et étrangères dont les titres ont été radiés de grandes bourses américaines sans leur accord. Il constate que, dans le cas de la plupart des pays, moins de 10 % des entreprises étrangères cotées aux États-Unis ont vu leurs titres radiés pendant la période considérée. Or, cette proportion dépasse 25 % chez les firmes canadiennes inscrites à une bourse américaine. La différence est plus nette pour les sociétés du Nasdaq : le taux de radiation excède 40 % parmi les entreprises canadiennes contre environ 15 % du côté des autres firmes étrangères. Même si l’on tient compte des diverses caractéristiques d’une entreprise qui peuvent pousser les bourses à retirer un titre (comme la taille de la société, la bourse à laquelle elle est inscrite, le niveau d’endettement, le rendement de l’action durant l’année précédente et sa volatilité), les entreprises canadiennes demeurent plus susceptibles de subir une radiation que les autres sociétés étrangères intercotées. Pour autant, elles ne présentent pas sur ce plan d’écart statistique significatif si on les compare aux sociétés d’un échantillon composé d’entreprises américaines ayant les mêmes caractéristiques. Ces résultats portent à croire que le traitement réservé par les places boursières aux firmes canadiennes se rapproche davantage de celui accordé aux entreprises
américaines, du point de vue tant des règles à respecter pour maintenir la cotation que de leur application. Ils semblent aussi indiquer que ces deux groupes d’entreprises bénéficient davantage de la crédibilité par association donnée par le parquet d’une bourse américaine. Par ailleurs, il est possible que les firmes canadiennes rencontrent moins d’obstacles que les sociétés étrangères pour s’inscrire à une bourse aux États-Unis, au point de favoriser, sur le marché américain, l’entrée de petites entreprises canadiennes en forte croissance.
Classification JEL : G30, G38
1.
Introduction
In this paper, I examine U.S.-listed foreign firms that get involuntarily delisted by the U.S. exchanges over the period from 1988 to 2006. This includes firms that fail to meet the firms’ numerical criteria for continued listing, as well as firms that get delisted for more qualitative reasons such as an impending bankruptcy or for the protection of investors. Across most foreign countries, approximately 10% of U.S.-listed firms eventually get involuntarily delisted. For Canada, on the other hand, more than 25% of U.S.-listed firms eventually involuntarily delist. This effect is more pronounced among Nasdaq-listed firms, where more than 40% of Canadian firms eventually get delisted, compared to about 15% of other foreign cross-listed firms.
Cross-listing is important from a Canadian perspective because a large number of Canadian firms are cross-listed on U.S. exchanges. Theories suggest that firms cross-list to opt-in to the regulation and for other benefits of U.S. capital markets. These benefits include increased liquidity in their shares, increased firm visibility, bonding to U.S regulatory institutions, access to a larger pool of capital, and ultimately, higher firm valuations and a lower cost of capital [Hail and Leuz (2004)].
The high propensity to delist for Canadian firms listed in the United States implies that a large segment of Canadian firms may not have benefited fully from a U.S. listing and that the benefits of listing in the United States may be temporary given that many firms do not maintain a U.S. listing. Moreover, a U.S. delisting entails negative consequences for Canadian firms since they experience negative stock returns of about 10% in Canada and a sharp drop in home market liquidity following an involuntary delisting. Therefore, it is important to examine what factors contribute to Canadian firms being delisted in the United States.
Canadian firms may have a higher propensity to get delisted in the United States for two reasons. First, due to exchange guidelines, the Multi-Jurisdictional Disclosure System (MJDS), and similarities between Canada and the United States, Canadian firms may have a lower cost of listing in the United States such that small, high-growth Canadian firms with minimal current cash flows have been more able to access U.S. markets compared to foreign firms.1 Second,
1 Fama and French (2004) find an increase in the mortality of U.S. listed firms over time and suggest that this is due
differences in exchange listing criteria, discretion in enforcing these criteria [Macey, O’Hara, and Pompilio (2004)], and differences in the form of U.S. listing (i.e., via ADRs or ordinary shares) could have contributed to more Canadian firms being delisted. This paper uses a Cox (1972) proportional hazard model to determine whether the characteristics and previous performance of firms can fully explain the higher proportion of Canadian firms that have been delisted.
Firms may cross-list in the United States to bond themselves to increased monitoring and stiffer penalties from the SEC, auditors, U.S. exchanges, institutional shareholders, debt-rating agencies, and better boards of directors [Coffee (1999, 2002), Stulz (1999)]. There are several recent studies providing arguments and evidence both for [Doidge, Karolyi, and Stulz (2004); Doidge (2004); Doidge, Karolyi, Lins, Miller, and Stulz (2005); King and Segal (2004)] and against [Licht (2003); Siegel (2004)] the bonding hypothesis.2 This paper examines the role played by U.S. exchanges in bonding and shows that the different exchange listing criteria for foreign firms and the exchanges’ discretion in enforcing their continued listing criteria may have resulted in fewer non-Canadian foreign firms getting delisted compared to Canadian firms, which suggests that the bonding benefit provided by U.S. exchanges may have been greater for Canadian firms than for other foreign firms.
The main contribution of this paper is to investigate differences in U.S. listing requirements for U.S., Canadian, and other foreign firms and test to see whether or not they had an impact on the likelihood of Canadian firms delisting from the United States. While some continued listing requirements are different for Canadian firms, these differences may not translate into more delistings if they are not enforced or if they are not a binding constraint on maintaining a listing. If the propensity to delist for Canadian firms is not different after controlling for firm characteristics, this would suggest it is the ease of listing for Canadian firms that has resulted in more firms being delisted. If there is still a difference after controlling for firm characteristics, it would suggest that differences in delisting rules and their enforcement may have caused more
into the future have been able to access U.S. markets. Chaplinsky and Ramchand (2007) also find a similar increase in mortality for foreign firms listed on U.S. exchanges.
2 King and Segal (2004) differentiate between legal bonding (i.e., through the courts) and reputational bonding (i.e.,
Canadian firms to delist (or that firm characteristics and quality are not fully being accounted for in the analysis).
After controlling for firm characteristics that have an impact on involuntary delistings such as size, exchange listing, previous year’s return, volatility, and leverage, Canadian firms have a higher propensity to get delisted than other foreign cross-listed firms, suggesting there may be some differences in delisting rules and enforcement. Also, in a comparison to a U.S. matched sample, there is no statistically significant difference in the likelihood of being delisted, relative to these U.S. firms. These results suggest that Canadian firms may have been treated more similarly to U.S. firms under the U.S. exchanges’ rules and enforcement of their continued listing criteria, and that the bonding provided by U.S. exchanges may be stronger for Canadian and U.S. firms.
I would also like to note that the magnitude of the difference in the propensity to delist between Canadian and foreign firms is much smaller than when firm characteristics are not used to explain delisting, so the ease of entry for Canadian firms does still partially explain why Canadian firms are more prone to be delisted. This may be good news in that it indicates the larger number of Canadian delistings is partially the result of small Canadian firms with growth opportunities having been able to access U.S. markets.
Like U.S. firms, Canadian firms list their ordinary shares directly in the United States whereas most foreign firms list using American Depositary Receipts (ADRs). This would make it easier for foreign firms to meet the minimum price criteria of the exchanges because a firm can choose its price on the U.S. exchange since it can reset its ADR ratio (number of home market shares represented by one ADR) to facilitate trading in the ADR and to avoid approaching the minimum price criteria of the exchanges. However, I do not find evidence that ADRs are less likely to be delisted when compared with a sample of about 75 non-Canadian foreign firms with ordinary share listings in the United States.
I extend the literature on the impacts of delisting by showing that an involuntary delisting from a U.S. exchange results in negative abnormal returns of about 10% for Canadian firms, which compares with previous research that shows U.S. firms experience a negative abnormal return of 8.5% on the delisting announcement day [Sanger and Peterson (1990)] and that foreign firms’ returns are about -4.5% when delisting in the United States [Liu (2004)]. Also, I show that
Canadian firms’ home market liquidity declines substantially after delisting in the United States, similar to the experience of U.S. firms delisting from a major exchange and subsequently trading either in Pink Sheets or OTC Bulletin Board [Macey, O’Hara and Pompilio (2004), Panchapagesan and Werner (2004)]. My results are interesting because the home market liquidity could potentially increase after a delisting if trading migrates back to the home exchange after delisting; however, I show that this is not the case.
Finally, this paper also contributes to the cross-listing literature by examining some of the benefits of cross-listing over a longer time horizon, in that I follow the cross-listed stocks until they delist or until the end of the sample period. Financial managers cite increased liquidity as one of the primary reasons for cross-listing in the United States [Fanto and Karmel (1997), Mittoo (1992)] and several papers have found a positive liquidity effect after cross-listing in the United States [Foerster and Karolyi (1998), Smith and Sofianos (1996), Domowitz, Glen and Madhavan (1997)]. Here, I examine liquidity over a much longer time period and find that those Canadian firms that delist from the Nasdaq, who comprise more than 40% of Canadian Nasdaq listed firms, do not have a high level of liquidity while cross-listed. The median Nasdaq-listed Canadian firm that eventually delists does not trade on 10% of trading days.
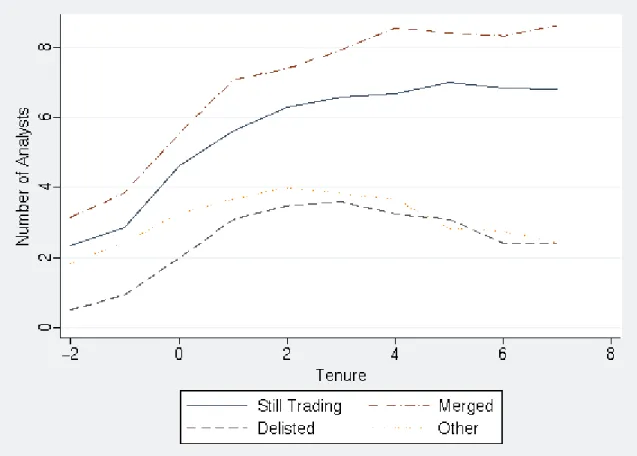
A firm may also cross-list to increase its visibility [Merton (1987), Foerster and Karolyi (1999); King and Segal (2006)]. Several studies use analyst following as a proxy for visibility and find an increase in analyst following after cross-listing and a positive correlation between the change in firm value around cross-listing and the change in analyst following [Baker, Nofsinger and Weaver (1998); Lang, Lins and Miller (2002)]. I follow Canadian firms’ analyst coverage from two years before cross-listing to seven years after cross-listing. Canadian firms that stay listed and those firms that eventually get acquired enjoy a sustained increase in coverage following listing. Those firms that eventually involuntarily or voluntarily delist begin with a low level of coverage, and have a small temporary increase in coverage in the two years after cross-listing before it declines again. Again, on average, Canadian firms seem to have experienced a sustained increase in analyst following, but there is a significant segment of Canadian cross-listed firms that had only a temporary increase in analyst following.
The rest of the paper is organized as follows. In Section 2, I briefly review the listing criteria for foreign firms listing on the major U.S. exchanges. Section 3 describes the dataset while Section
4 examines post-delisting stock performance of Canadian firms. I examine why foreign firms get involuntarily delisted in the United States in Section 5, and then conclude in Section 6.
2.
Listing and delisting requirements for foreign firms on major U.S.
exchanges
The initial listing criteria for foreign companies differ from the listing criteria for U.S. companies, depending on which major U.S. exchange the security is listed on. Moreover, Canadian firms are subject to different listing criteria than other foreign firms, and this could affect the type of firm that can list in the United States. On the NYSE, domestic listing requirements require a minimum number of shares and shareholders within the United States. For North American issuers only (i.e., Canadian, U.S., and Mexican issuers), the NYSE will consider all North American stockholders and trading volume requirements when applying its standards. As a result of these NYSE standards, it is much easier for small Canadian and Mexican companies to list their shares on the NYSE. However, the NYSE has Alternate Listing Standards for foreign private issuers to “encourage major non-U.S. companies to list their shares on the Exchange.” These Alternate Listing Standards are much stricter in terms of their requirements, but foreign companies may use their worldwide distribution of shares rather than its U.S. distribution to meet these standards.
Except for the minimum bid price, the Nasdaq allows foreign companies to use the underlying home market shares to meet the listing criteria if the ADRs do not qualify on their own merits,3 so there does not appear to be much differential between Canadian and other foreign firms when initially listing on the Nasdaq. While Nasdaq’s initial listing standards are similar for Canadian and non-Canadian firms, ongoing requirements, such as disclosure standards, are different. As an example, without shareholder approval to do otherwise, any company listing common stock is required to disclose their equity compensation plans to Nasdaq. Companies listing only American Depositary Receipts do not have to provide this disclosure to Nasdaq.
2.1. Numerical Criteria for Continued Listing
The major U.S. exchanges may suspend trading in a security or delist a security for failing to meet certain numerical criteria, such as minimum firm size, price, number of publicly held shares, number of shareholders, and trading volume, or for more qualitative reasons relating to factors such as corporate governance, impending bankruptcy or protection of the public interest.4 These continued listing criteria are usually less stringent than the initial criteria for listing and are used to maintain the exchange’s reputation5 and to eliminate those firms which are unprofitable
to the exchange or market-makers [Macey, O’Hara and Pompilio (2004)].
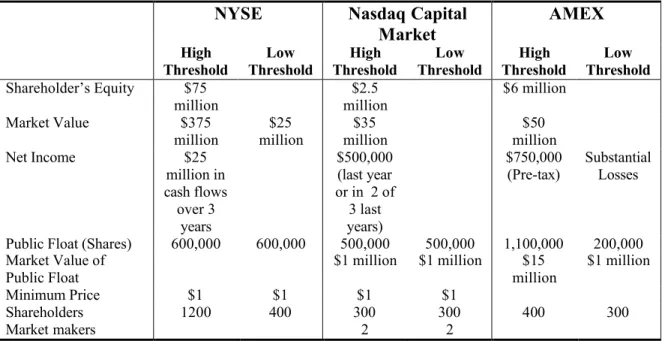
For each exchange, Table 1 shows a high and a low required threshold for each of the numerical listing criteria.6 If a firm is below the high threshold for one criteria, it may be able to maintain its listing if it meets certain thresholds along some of the other criteria. However, if the firm is below any of the low threshold criteria, it would be subject to suspension or delisting. At a minimum, the NYSE requires domestic and non-U.S. issuers to have at least $25 million in global market capitalization, at least 600,000 public float shares, 400 shareholders, and a 30-day average closing price above $1.
Also, a firm may be delisted if it fails to meet a combination of other criteria relating to shareholder’s equity, global market capitalization, revenue, or net income, depending upon the standard under which the company originally listed. Both the Nasdaq and the NYSE have similar criteria in terms of public float number of shares, number of shareholders, and minimum bid price.
There has been a change to the Nasdaq’s minimum bid price criteria over the sample period which may have had an impact on the number of Canadian firms delisting compared to the number of non-Canadian foreign firms delisting. This criterion was first introduced in 1997, and applied to Canadian and U.S. firms. In 2005, the Nasdaq’s minimum bid price criterion was expanded to be applied to foreign, non-Canadian issuers.
4 NYSE manual and Nasdaq Listing Requirements manual.
5 In a model by Chemmanur and Fulghieri (2003), investors infer the exchange’s reputation by the performance of
listed firms on that exchange.
6 This table is only meant as a top-level display of the exchanges continued listing criteria. For full details on each
Also, Nasdaq implemented a moratorium on enforcing some of its continued listing criteria (including the minimum bid price) in the period shortly after September 11th, 2001 when a number of firms experience large declines in share price.
However, these differences in criteria may not have had an impact on foreign firms delisting for two reasons. First ADR-listed foreign firms can change their ADR ratio to raise their U.S. ADR price above $1. Muscarella and Vetsuypens (1996) label this a reverse “solo split” and provide some anecdotal evidence of two firms that experienced positive price reactions around the announcement. U.S. and Canadian firms can perform a reverse stock split to comply with the minimum bid price criteria, but this typically involves shareholder approval and results in significant negative returns [Chambers and Woolridge (1983) Marchman (2007)]. Second, firms often fail to meet more than one of the continued listing criteria when they get delisted [Macey, O’Hara, and Pompilio (2004)]. I test later to see whether Canadian firms are more likely to get delisted, after controlling for firm characteristics, and find evidence in support of this.
2.2. Qualitative Criteria for Continued Listing
The exchanges also can decide to delist firms due to poor corporate governance, impending bankruptcy or protection of the public interest. The corporate governance standards may be more lenient for foreign firms, both in terms of the rules regarding foreign firms and their enforcement [Macey, O’Hara, and Pompilio (2004)]. For example, Nasdaq Marketplace Rule 4350(a) (1) exempts foreign private issuers from certain Nasdaq governance requirements, so long as the company's practices are not prohibited by home country law and it is disclosed in annual reports to the S.E.C. However, foreign issuers cannot become exempt from certain governance requirements, such as audit committee requirements.
3.
Data
In this paper, I examine a sample of foreign firms that are cross-listed on a major U.S. exchange (NYSE, AMEX, or Nasdaq) between 1988 and 2006. To develop this sample, I first identify all foreign firms in the CRSP dataset based on their CRSP share code7 and then match these firms to Datastream based on the security’s name, CUSIP, ticker and country. COMPUSTAT, Datastream, company websites, and Internet searches are used to identify a company’s country
7 This includes issues with a share code of 30 or 31 (ADR’s) and issues with a share code of 12 (ordinary shares of
of incorporation, and I exclude companies that are incorporated in tax havens such as the Cayman Islands and Bermuda. After performing these screens, I have a universe of 1070 U.S. cross-listed, foreign firms for a total of 9,512 firm-years. I also identify 178 involuntary delists, liquidations or bankruptcies in the cross-listed universe during the 1988 to 2006 time period using delisting codes from the CRSP database,8 and verify that these were in fact involuntary delistings and liquidations using information from Datastream, company websites, Lexis-Nexis and Internet searches. Accounting information is taken from COMPUSTAT and analyst coverage is from I/B/E/S.
3.1. Description of Sample
In Table 2, I analyze the sample of involuntary delistings, liquidations, and U.S. listings of foreign stocks over time. The number of U.S. cross-listed foreign stocks increases over time from just over 200 in 1988 to a peak over 700 in 2001, and then decrease to just under 600 by the end of 2006. I document fewer US exchange-listed foreign stocks than reported in Karolyi (2004) Table 4, but this is due to the fact that I require a home exchange listing for the foreign stock (i.e., a match in Datastream) and remove multiple listings of the same company, whereas Karolyi is looking at all foreign listings. There seems to be a higher frequency of involuntary delistings occurring on the Nasdaq between 1999 and 2002, with the largest number of delisting occurs in 2002, when 20 foreign firms were delisted from the Nasdaq stock exchange. This is consistent with a regulation change that occurred in early 2002, when Nasdaq removed the moratorium it had placed on delisting stocks during the period directly following September 11th, 2001 after many stocks experienced a large decline in price. Since its peak in 2001, the number of foreign stocks cross-listed on Nasdaq has declined.
Involuntary delistings explain only about a quarter of the drop in the number of Nasdaq listings. Mergers and acquisitions explain about half of the drop in Nasdaq listings over this period and voluntary delistings explain the remaining portion of the decline. On the other hand, the number of NYSE listings has remained relatively stable over this period, which is consistent with Doidge, Karolyi, and Stulz (2007) who find that New York has not lost its competitiveness relative to the London Stock Exchange since the passing of Sarbanes-Oxley.
8 Specifically, stocks with delisting codes below 500 were not classified as delistings. Also, stocks with delisting
codes 501,502, 503, 505, 510, 513, 516 and 517 were not classified as delistings since these stocks moved to another U.S. exchange.
3.2. Canadian firms vs. other foreign cross-listed firms
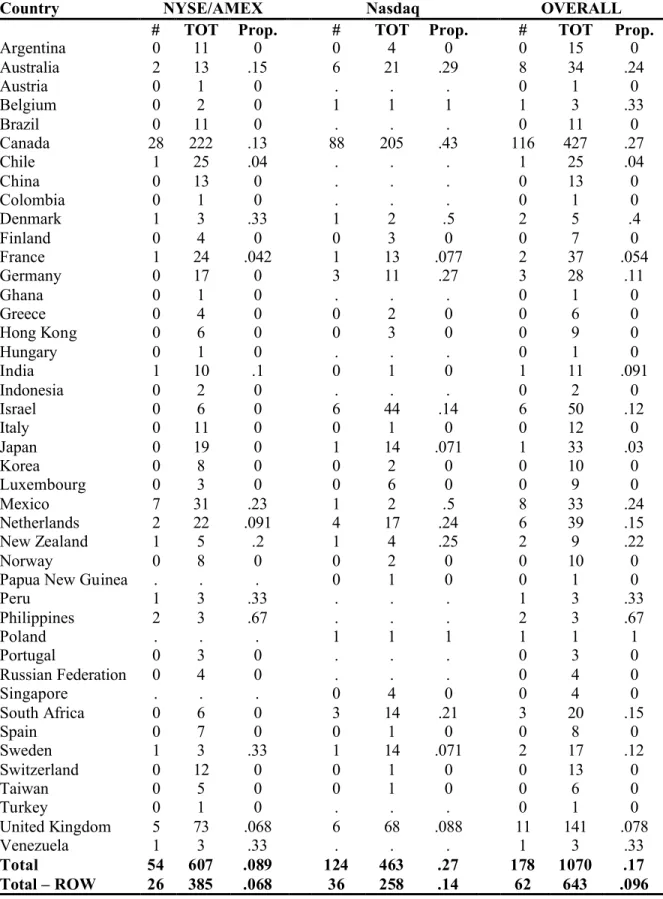
Table 3 shows the number of involuntary delistings, liquidations and U.S.-listed foreign stocks by country. There seems to be an abnormally high number of involuntary delistings and liquidations in Canada relative to the number of U.S. cross-listed Canadian firms, with more than one quarter of Canadian firms getting involuntarily delisted or liquidated from a major U.S. exchange. In almost every other country, fewer than 10% of firms get involuntarily removed from a U.S. exchange. Australia and Mexico are two exceptions with a similar experience to Canada. Moreover, on the Nasdaq, more than 40% of Canadian firms have been involuntarily delisted during the sample period compared with an average of almost 15% from all other foreign countries.
This result could be misleading if Canadian firms are, on average, listed for a longer period of time during the sample period. In Figure 1, I examine the yearly percentage of foreign firms getting involuntarily delisted for Canada and the rest of the world (ROW) by each stock exchange in two sample periods: Pre-2001 and Post-2001. In each sample period, the numerator includes the number of firms that were involuntarily delisted during the period, and the denominator includes the number of firm-year observations during the period. Even on a yearly basis, a much higher proportion of Canadian firms involuntarily delist when compared with the rest of the world. More recently, the proportion of Canadian firms involuntarily delisting has decreased, although this proportion is still almost double that of the rest of the world.
Since cross-listed Canadian firms are much smaller than their foreign counterparts and smaller firms are more likely to be involuntary delisted, these results could be caused by the size distribution of firms. However, Figure 2 shows that small (< $100M in total assets) Canadian firms are more than three times more likely to get delisted than small foreign firms. This result is robust to thresholds of $50M and $20M in total assets as well. Larger Canadian firms appear to have a similar propensity to get delisted compared with foreign firms.
In Table 4, I examine summary statistics for the sample of Canadian firms and other foreign firms cross-listed on U.S Exchanges. Panels A and B display statistics for Canadian and foreign firms cross-listed on either the NYSE or AMEX. Canadian cross-listed firms, in both the full sample and in sub-samples based on whether the firm eventually delisted, are smaller, have fewer analysts covering them and have a lower stock price than non-Canadian foreign
cross-listed firms. Involuntary delists have large, negative stock returns and return on equity, while the remaining firms have positive returns. Also, involuntary delists are smaller, have a higher standard deviation, a lower stock price and fewer analysts following them. There does not appear to be much difference in the median Debt / Equity ratio, probably because the majority of firms are delisted for reasons other than bankruptcy.
Similar relationships are found for Nasdaq firms (See Panels C and D). Canadian cross-listed firms are smaller, attract fewer analysts, and have a lower stock price than non-Canadian foreign cross-listed firms. In addition, Canadian firms are more volatile and have exhibited poorer stock and accounting returns than their foreign counterparts. As with NYSE/AMEX firms, Nasdaq’s involuntary delists have large, negative stock returns and return on equity, are smaller, have a higher standard deviation, a lower stock price and fewer analysts following them. Furthermore, involuntary delists are illiquid. While many firms cross-list in the United States to improve their liquidity [Fanto and Karmel (1997), Mittoo], Canadian cross-listed firms that get delisted from Nasdaq, who make up more than 40% of Canadian Nasdaq-listed firms, experience low levels of liquidity (relative to those firms that do not delist) in the United States while cross-listed. The median Nasdaq-listed Canadian firm that eventually becomes involuntarily delisted trades on only 90% of the days, suggesting minimal liquidity benefits of cross-listing for many Nasdaq-listed Canadian firms. However, this low liquidity for Canadian firms may also be related to the fact that small Canadian growth firms, who may not have very liquid shares, have an easier time to get cross-listed in the United States in the first place. In Section 5, I examine the determinants of delisting to determine whether this can explain why so many Canadian firms have been delisted relative to firms from other countries.
Since visibility and shareholder awareness are also cited as benefits of cross-listing [(Merton (1987); Foerster and Karolyi (1999)], I also examine the analyst coverage of Canadian firms following their listing as a measure of shareholder awareness. Figure 3 shows the average analyst coverage from two years prior to listing to seven years after listing for Canadian firms cross-listing on a U.S. exchange between 1988 and 1999. A similar analysis is performed by Baker, Nofsinger and Weaver (1998) and Lang, Lins, and Miller (2002), but they only measure analyst coverage for a short time period after cross-listing so this study takes a more long-term view of the effect of cross-listing on analyst coverage and visibility. The average number of
analysts following the firm is presented for only those firms where a match has been found in I/B/E/S, so results may be biased towards increased coverage if the firms without a match had no analyst coverage throughout the sample period.
Canadian firms that eventually delist do not initially attract analysts after their initial listing but lose this coverage over time. On average, coverage increases from about one analyst in the year prior to listing to a peak of just over three analysts in the few years following listing and then declines afterwards. Firms that either get acquired or maintain their listing start off with higher analyst coverage before listing and experience an increase in coverage in the year of listing and maintain this increased coverage throughout the next seven years.
Overall, top level statistics show that Canadian firms have a higher propensity to get delisted compared to other foreign firms, but these statistics also show that Canadian firms have characteristics, such as a smaller firm size, that make them more likely to get delisted. Therefore, a more in-depth analysis is needed to determine whether it is Canadian firm characteristics, which are related to the ease of Canadian firms to list in the United States, or differences in exchange delisting rules and their enforcement that have caused a higher number of Canadian firms to get delisted.
4.
The impact of delisting on Canadian firms
Previous research has shown that U.S. firms experience a negative abnormal return of 8.5% on the delisting announcement day [Sanger and Peterson (1990)] and that foreign firms’ returns are also negative at about -4.5% when delisting in the United States [Liu (2004)]. Also, firms suffer a drop in trading volume and an increase in spreads and volatility when delisting from major U.S. exchanges and subsequently trading in the OTC Bulletin Board or Pink Sheets [Macey, O’Hara and Pompilio (2004), Panchapagesan and Werner (2004)]. Given that Canadian firms are different from other foreign firms, and that many Canadian firms continue trading in Canada after delisting, it remains an empirical question as to what happens to Canadian firms when they delist in the United States, but continue trading in Canada.
4.1. The impact of delisting on the returns of Canadian firms
I use a standard event study methodology [Mackinlay (1997)] to examine the short-run stock price performance of Canadian firms that get delisted. Abnormal returns are calculated using a
2-factor market model, with the Canadian SP60 Index and the U.S. SP500 Index as the two market factors. Specifically, coefficients are estimated for each security over the period from 350 days prior to the delisting to 50 days prior to the delisting using the following regression:
t i t SP SP i t SP SP i t i
r
r
r
,=
α
+
β
, 60 60,+
β
, 500 500,+
ε
,Stocks with a price of less than $0.20 and stocks that traded on less than 50 days during this 300 day estimation window are removed. Stocks that have ceased trading in Canada prior to the U.S. delisting or within the ten days following the delisting are also excluded. Therefore, our sample does not include those Canadian firms that went bankrupt or those that trade on the U.S. OTC Bulletin Board or Pink Sheets but not in Canada. These screens reduce the sample to 52 delistings. Then, Average Abnormal Returns (AAR) is calculated for each day in the window [-20, 20] by averaging the market model abnormal returns across all of the delisting stocks and Cumulative Abnormal Returns (CARs) were calculated over this window [See Campbell, Lo, and Mackinlay (1997)]. As a robustness check, abnormal returns are also estimated using two other methods: (1) the market model using just the SP60 return; and (2) raw, unadjusted returns. The choice of methodology does not have an impact on the results, which is probably because the variance of abnormal returns is not reduced much by using different models of abnormal returns [Brown and Warner (1980, 1985)].
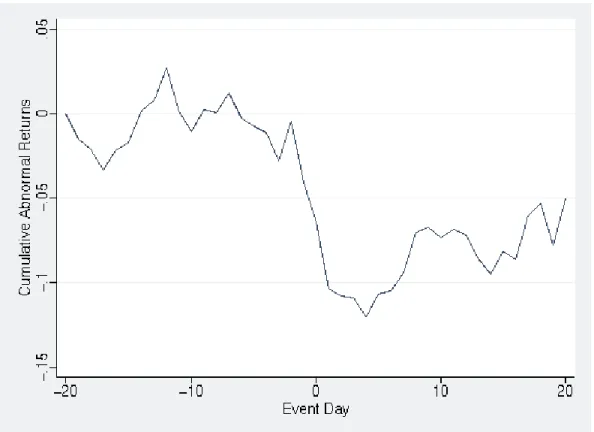
Figure 4 shows the average cumulative abnormal returns starting 20 days prior to the announcement day and ending 20 days after the announcement day. Cumulative Abnormal Returns are close to zero leading up to the delisting. In the event window [-1, 1], there is a statistically significant negative CAR of -10%. Post-delisting, there is a small, statistically insignificant rise in CARs.
This -10% abnormal return is much larger than the abnormal US market return for all foreign involuntary delistings in Liu (2004), and is more similar to the abnormal returns experienced by U.S. firms [Sanger and Peterson (1990)]. Canadian firms are smaller than other foreign cross-listed firms and may be more comparable in size to U.S. firms that get decross-listed. Nonetheless, the results show that the U.S. delisting has a large negative impact on the stock price of Canadian firms.
4.2. The impact of delisting on the liquidity of Canadian firms
A loss in liquidity is often cited as one of the main reasons for the negative returns upon delisting. Indeed, studies by Panchapagesan and Werner (2004) and Macey, O’Hara and Pompilio (2004) show a sharp drop in liquidity after U.S. firms delist from major exchanges. However, it is possible that home market liquidity in Canadian firms could increase after the delisting if trading migrates back to the home exchange after delisting.
Figure 5 shows the average dollar volume of trading in Canada during the time period around the delisting for the sample of stocks we describe above. The average dollar volume appears to be higher prior to the delisting. On the day of the delisting, there is also a spike up in dollar volume, possibly due to trading on the information contained in the announcement. In the period from 50 days before the delisting to 10 days before the delisting, the average Canadian dollar volume is $653,000. From 10 days after to 50 days after delisting, the dollar volume averages $155,000. This decline in dollar volume is statistically significant at the 1% level. Therefore, a U.S. delisting is associated with a large drop in home market liquidity.
5.
Are Canadian more prone to be delisted than other foreign firms?
Given that a delisting has several negative consequences for firms, it is important to determine what has caused so many Canadian firms to delist from U.S. exchanges. Table 5 outlines the primary reason given for the involuntary delisting. A large percentage of foreign and Canadian involuntary delistings are due to bankruptcy or firm size (insufficient capital equity, or assets). Only a few firms have been delisted to protect the interests of investors, and the Canadian firms delisted for this reason are small, mining companies. Most importantly, about thirty percent of Canadian delistings on the Nasdaq are due to a failure to meet the minimum bid price criteria, whereas less than 10% of foreign firms delist from the Nasdaq because of a low share price. However, these results should be interpreted with caution since firms can be failing to meet more then one criterion when they get delisted, and CRSP only records the primary reason for delisting.
I use duration analysis by means of a Cox (1972) proportional hazard model to examine the factors that contribute to a foreign, U.S. cross-listed firm involuntarily delisting and to test whether more Canadian firms have been delisted after accounting for these factors. Similar
methods have been used to model the initial cross-listing decision [e.g., Pagano, Roell, and Zechner (2002); Doidge et al. (2005)] and to model bankruptcy and bond defaults [ e.g., Shumway (2001); Chava and Jarrow (2004); McDonald and Van de Gucht (1999)]. The Cox proportional hazard model models the probability of delisting in year t, conditional on the firm still being cross-listed in the United States, using time-dependent covariates.9 The hazard rate for firm i, h(t | xi ), is the instantaneous rate of involuntary delisting and is specified as follows:
h(t | xi ) = h0(t ) exp( xi ßx)
In this equation, xi represent the time-varying independent variables, ßx is the vector of
coefficients, and h0(t ) is the baseline hazard. The model is semi-parametric, so that the only
assumption about the baseline hazard is that it is identical for all firms. All variables in the analysis are sampled at the end of each calendar year, and all explanatory variables are lagged by one year, so the sample runs from 1989 to 2006. Once a firm stops being listed in the United States (either because it is involuntarily delisted, voluntarily delisted, liquidates, or gets acquired), it is removed from the analysis. A failure is defined as a firm getting involuntarily delisted. To test whether Canadian firms are more likely to get involuntarily delisted, I include a dummy variable indicating whether a firm is Canadian.
5.1. Control Variables
The following control variables are also included:
1.Logarithm of total assets (book value in USD): The U.S. exchanges have specific criteria relating to firm size, number of shareholders, and number of market makers. The logarithm of total assets is used as a proxy for these criteria, and should be negatively related to involuntary delistings.
2. The past year’s stock return: The past year’s stock return is an indicator of financial performance, and poorly performing firms are more likely to fall below the exchanges’ continued listing criteria. I expect a negative sign on this variable, as firms that have lower returns in the previous year should be more likely to get delisted.
9 Shumway (2001) shows that a discrete duration model, similar to the one applied here, is identical to a
3. Post-2001 Dummy: As suggested by Macey, O’Hara, and Pompilio (2004), Nasdaq and NYSE may have tightened their application of corporate governance listing standards following corporate governance scandals such as Worldcom and Enron. Since the exchanges have discretion in how they apply their listing standards, they may have chosen to be stricter in applying these standards in the Post-2001 period. In addition, firms may also be more likely to get delisted if they don’t meet Sarbanes-Oxley requirements. Also around this time, foreign firms were required to file electronically with SEC’s EDGAR filing service and were required to file more documents with the SEC (translated into English). While it is possible that more firms may have been delisted for failing to file the required financial documents, few firms were actually delisted for being “delinquent in filing”.
4.Nasdaq Dummy: This dummy variable indicates whether a firm is listed on the Nasdaq stock exchange and is included because U.S. exchanges have different exchange listing criteria, and descriptive statistics show that at a top-level Nasdaq firms have a higher propensity to get delisted.
5.Daily Standard Deviation: I use the standard deviation of the stock’s daily returns over the previous year as a control variable. All else equal, a stock that is more volatile is more likely to fall below the $1 minimum price criteria and may also be more likely to meet other minimum listing criteria.
6.Logarithm of Share Price: Sequin and Smoller (1997) show that share price is an important predictor of mortality for firms listed on the Nasdaq, as those firms that list on the Nasdaq as penny stocks (price less than $3) have a much higher mortality rate than those that are not penny stocks. Therefore, the logarithm of share price is included in some models to control for the high mortality of low-priced firms.
7.Industry Dummies: Industry dummies are used because different industries may have a different propensity to get delisted (see Figure 6). Mineral and Construction Industries have the highest proportion of involuntary delists, which partially explains why Canada and Australia contain more firms that have been involuntarily delisted since they have a higher proportion of firms from these industries. These industries experience more delists since they are both cyclical and because several mining companies in the sample have been delisted following alleged frauds.
8.ADR Dummy: Firms listing using ADRs have more freedom to choose their U.S. trading price by setting the ratio of home market shares that each ADR represents, and they may perform a reverse stock split in the United States without performing a stock split at home by changing the ratio of home market shares that each ADR represents. Also, stock splits generally require shareholder approval, whereas ratio changes do not so it may be less of a nuisance for an ADR to meet the minimum price criteria of the exchanges. Therefore, I would expect ADR listings to be less likely to be involuntarily delisted.
5.2. Cox Survival Analysis
Table 6 displays the results of the Cox Hazard model. Across all models, the Canada Dummy variable is positive and significant showing that, after controlling for different firm characteristics, Canadian firms are more likely to be delisted. The only other variable in the first model is a Nasdaq dummy, whose coefficient is positive and statistically significant, so before controlling for any firm characteristics, Canadian firms and Nasdaq-listed firms are more likely to be involuntarily delisted. Model (2) includes several of the firm characteristic control variables including industry dummy variables, and shows that firms that have a higher volatility, lower returns, and firms with a lower stock price are more likely to be involuntarily delisted. For the sake of brevity, coefficients on the industry dummy variables are not reported. A Wald test rejects the hypothesis that the industry coefficient dummy coefficients are equal. The Post-2001 dummy variable is not statistically significant, indicating that Sarbanes-Oxley and changes to corporate governance standards have not substantially changed the likelihood that a foreign firm will get delisted. The Nasdaq dummy variable is now only significant at the 10% level (and is insignificant in later models) due to the correlations between a Nasdaq listing and firm volatility as well as firm stock returns.
Model (3) includes accounting variables measuring firm leverage and size, which reduces the number of involuntary delists included in the sample by almost one-third. The magnitude and significance of the coefficients in Model (2) is robust to this reduced sample size. The coefficient on the size variable is not statistically significant, given the correlation between stock price and firm size. This confirms the results of Seguin and Smoller (1997), who find firm mortality is related to a firm’s price, and not to its market capitalization. More levered firms are also more likely to delist.
In Models (2) and (3) the Canada dummy coefficient is still statistically significant, but its magnitude is much smaller than in Model (1), which did not include any firm-level characteristics. The characteristics and performance of Canadian firms seem to explain a portion, but not all, of the higher propensity of Canadian firms to get delisted. However, the control variables may not completely capture all relevant firm characteristics, and the effect of any omitted variables may be to reduce the coefficient of the Canadian dummy if omitted variables measuring firm quality are negatively correlated with the Canada dummy.
In Model (4), an ADR dummy is included since a large portion of non-Canadian foreign firms list using ADRs and these firms may have more freedom in choosing their initial U.S. listed price by choosing an appropriate ADR ratio. Also, ADR firms may also change their ADR ratio (i.e., a reverse solo split), which does not require shareholder approval, to conform to the exchanges’ minimum price criteria. The sign on this coefficient is positive and is not significant at the 10% level, and the Canadian dummy variable retains its significance, which does not support the hypothesis that more Canadian firms are delisted because they do not list using ADRs.10 However, the sample of non-Canadian foreign firms that do not list in the U.S. using ADRs contains about 75 firms and is concentrated in countries like Israel and the Netherlands, so it is difficult to conclude definitively that it is the form of listing, and not some country-level effect, that is driving these results.
Table 7, Models (5) and (6) repeat the analysis by segmenting companies based on what exchange they are listed on. Model (5) includes all AMEX and NYSE listed companies, while Model (6) examines only Nasdaq-listed companies. On the NYSE and AMEX, the Canada Dummy is statistically insignificant, while on the Nasdaq, it is statistically significant. Therefore, these results seem to be driven by Canadian firms listing on the Nasdaq.
Instead of defining a failure as an involuntary delist, Model (7) defines a failure as delisting for failing the exchanges’ minimum bid price requirement, while Model (8) examines the determinants of firms being involuntarily delisted for reasons other than the minimum bid price requirement. In both models, Canadian firms are still more likely to delist after controlling for factors affecting whether a firm delists. Leverage only affects delisting for non-price reasons,
10 Although not reported in this paper, ADR firms are more likely to perform reverse stock splits than other
non-ADR foreign firms. This could be the case if it is easier for non-ADR firms to perform a reverse stock split, or if these firms need to perform more reverse splits to meet listing criteria in their home markets.
probably because bankruptcy is one of the major reasons in this category for being delisted. The ADR dummy is positive and statistically significant in Model (7), showing that ADR-listed firms are more likely to be delisted than other non-ADR foreign firms for failing to meet the minimum bid price requirements. Again, although this is contrary to the hypothesis that these firms can use reverse solo splits to meet the minimum price requirements and avoid a delisting, it is based on a small comparison sample of non-Canadian, foreign firms that do not list in the United States using an ADR.
5.3. Comparison to U.S. matched sample
So far, Canadian firms have been compared to other foreign firms listed in the United States. However, the delisting experience with Canadian firms may be more similar to that of U.S. firms since the listing requirements and the characteristics of Canadian firms listing are more similar to those of U.S. firms. Fama and French (2003) study the survival of U.S. firms listed on major U.S. exchanges in the 1980-1991 period, and find that 44% of new lists and 18% of seasoned firms are “delisted for cause” within the next ten years. In this paper, almost 30% of Canadian firms have been involuntarily delisted over the sample period, but this proportion is not directly comparable to those of Fama and French (2003) because they include voluntary delistings in their definition of firms “delisted for cause”.
To make a true comparison to U.S. firms, each Canadian firm is matched with a corresponding U.S. firm. For each Canadian firm, I search for a U.S. firm that is listed on the same stock exchange and require that the U.S. firm lists on the exchange in the same year that the Canadian firm originaaly lists on the exchange. This way, the firms are of comparable age (in terms of time listed in the United States), and this is important to control for because Fama and French (2003) find differences in survival rates based on listing year. Essentially, this is comparing Canadian firms that cross-list in the United States to U.S. firms that went public (via an IPO) in the same year. Next, the firm is matched by size by selecting the U.S. firm that is closest in market value to the Canadian firm and is in the same industry as the firm (based on 1 digit SIC codes). If no match is found that meets these criteria and is within 30% of the Canadian market value, then I search for firms within 30% of market value in other industries. If still no match is found, the Canadian firm is assumed not to have a match and is dropped from the sample. This
results in a sample of 384 matched pairs of Canadian and U.S. firms, of which 291 are in the same industry.11
Figure 7 provides a summary of the proportion of firms being delisted by exchange for the matched sample of firms. Furthermore, the sample is broken down between those firms that are penny stocks (price < $3) and those that are not.12 Canadian and U.S. firms that are not penny stocks have a similar propensity to delist. Canadian penny stocks on all exchanges, however, seem to be delisted more when compared with U.S. penny stocks. For firms in both countries, penny stocks and Nasdaq-listed firms have been delisted more. In the United States on Nasdaq, 6.6% of penny stock firms are involuntarily delisted on a yearly basis, compared with 8.1% of Canadian penny stock firms. This is a considerable difference given that these firms are already matched on size, listing year and stock exchange.
I examine characteristics of the Canadian and U.S. matched sample in Table 8. The results for the sample of Canadian firms are similar to the earlier results for Canadian firms reported in Table 4, but are slightly different because of a smaller sample due to some firms dropping out in the matching process. Focusing on the Nasdaq exchange (Panels C and D), the median Canadian firm size in both categories (delisting and not delisting) is larger than the median U.S. firm in the same categories.13 Generally, those firms getting delisted from the Nasdaq have large negative stock returns of approximately 30% in both countries. The U.S. sample of firms that do not delist, however, has a median stock return of about 4% whereas Canadian firms have a median stock return that is close to zero, so that Canadian firms may have underperformed after cross-listing on the Nasdaq. This corroborates the results of King and Segal (2006) and Mittoo (2003), who both find that Canadian firms cross-list following strong stock price performance and then underperform the market in the long-term (3 to 5 years) subsequent to the cross-listing. Here, however, Canadian cross-listed firms are compared to U.S. IPO firms, who have also been shown to underperform the market post-IPO. Perhaps managers may be better able to take
11 Matching could also be performed based on propensity score. However, since the number of Canadian firms is so
small, most propensity scores are lower than 2%. Also, dimensionality is not a big concern given the limited number of variables used in the Cox Survival Analysis for Canadian and matched U.S. firms.
12 This status is determined at the initial time of listing, or at the beginning of the sample period if the firm listed in
the U.S. prior to the start of the period.
13 Since I matched on firm size, the overall median firm size on Nasdaq is similar for Canada and United States, but
since more Canadian firms delist from the Nasdaq this results in a higher median for both categories of firms. That is, the not delisting category contains a smaller number of the largest Canadian firms, while the delisting category contains a smaller number of the smallest U.S. firms.
advantage of opportunities to cross-list, rather than issue public equity for the first time, when the market is overvaluing their stock.
In Table 9, I perform the Cox survival analysis on this matched sample of firms. Model (1) includes just a Canada dummy variable and the Nasdaq dummy variable. With just these two variables in the analysis, Canadian firms are not more likely to be delisted compared to U.S. firms. In Models (2) and (3), the Canada dummy variable is still insignificant when controlling for additional variables such as the Percentage of Days Traded, Standard Deviation, Logarithm of Market Value, Logarithm of Stock Price and the Previous Stock Return. I confirm the earlier results that show that more volatile firms and smaller firms, low-priced firms, and poor performing firms are more likely to get delisted.
6.
Conclusion
In sum, I find that more than one quarter of Canadian cross-listed firms have been involuntarily delisted from U.S. exchanges during the 1988 to 2006 period, with an even higher percentage of Canadian firms getting delisted from the Nasdaq stock exchange. While many Canadian firms expect to benefit from increased visibility and liquidity following a U.S. cross-listing, those Canadian firms that eventually delist, who make up a large proportion of Canadian cross-listed firms, have had poor liquidity and only a small increase in analyst following after cross-listing. Moreover, a delisting entails negative consequences for Canadian firms given the significant drop in their share price and home market liquidity following an involuntary delisting in the United States.
After controlling for firm characteristics that have an impact on involuntary delistings, such as size, exchange listing, previous year’s return, volatility, and leverage, Canadian firms have a higher propensity to get delisted than other foreign cross-listed firms. This suggests that differences in exchange continued listing rules and their application to Canadian and foreign firms which may have contributed to more Canadian firms being delisted. As such, in a comparison to a U.S. matched sample, there is no statistically significant difference in the likelihood of being delisted after accounting for firm characteristics. These results suggest that Canadian firms may have been treated more similarly to U.S. firms under the U.S. exchanges’ rules and enforcement of their continued listing criteria.
References
Amihud, Y. and H. Mendelson, 1986, Asset pricing and the bid-ask spread, Journal of Financial Economics 17, 223-249
Baker, H., J. Nofsinger and D. Weaver, 1999, International cross-listing and visibility,
http://ssrn.com/abstract=142287.
Bushee, B. J. and C. Leuz, 2004, Economic consequences of SEC disclosure regulation: evidence from the OTC Bulletin Board, AFA 2004 San Diego Meetings.
http://ssrn.com/abstract=307821
Campbell, John Y., Andrew W. Lo and A. Craig MacKinlay, "Event-Study Analysis", Chapter 4 in The Econometrics of Financial Markets (Princeton University Press ISBN 0-691-04301-9, 1997) pp149-180
Cantale, S. 1996, The choice of a foreign market as a signal, INSEAD working paper.
Chava, S., Jarrow, R., 2004, Bankruptcy prediction with industry effects. Review of Finance 8, 537–569.
Chemmanur, T.J. and P. Fulghieri, 2003, Competition and competition among exchanges: a theory of cross-listing and endogenous listing standards, http://ssrn.com/abstract=496563
Chowdhry, B. and V. Nanda, 1991, Multimarket trading and market liquidity, Review of Financial Studies 4, 623-656.
Coffee, J., 1999, The future as history: the prospects for global convergence in corporate governance and its implications, Northwestern University Law Review 93, 641-708. Coffee, J., 2002, Racing towards the top? the impact of cross-listings and stock market
competition on international corporate governance, Columbia Law Review 102, 1757-1831.
Cox, D., 1972, Regression models and life-tables (with discussion), Journal of the Royal Statistical Society 34B, 187-220.
Doidge, C., 2004, US cross-listings and the private benefits of control: evidence from dual-class firms, Journal of Financial Economics 72, 519-553.
Doidge, C., A. Karolyi, and R. Stulz, 2004, Why are foreign firms listed in the US worth more?, Journal of Financial Economics 71, 205-238.
Doidge, C., G.A. Karolyi, K. Lins, D. Miller, and R. Stulz, 2005, Private benefits of control, ownership, and the cross-listing decision, ECGI Finance working paper.
Domowitz, I., J. Glen and A. Madhavan, 1998, International cross-listing and order flow migration: evidence from an emerging market, Journal of Finance 53, 2001-27.
Fanto, J.A. and R.S. Karmel, 1997, A report on the attitudes of foreign companies regarding a US listing, NYSE Working Paper 97-01, forthcoming Stanford Journal of Law, Business and Finance.
Foerster, S.R. and G.A. Karolyi, 1999, The effects of market segmentation and investor recognition on asset prices: evidence from foreign stocks listing in the United States, Journal of Finance 54, 981-1013.
Foerster, S. R. and G. A. Karolyi. 2000, The long-run performance of global equity offerings, Journal of Financial and Quantitative Analysis 35, 499-528.
Karolyi, G.A., 1998, Why do companies list shares abroad? A survey of the evidence and its managerial implications, Financial Markets, Institutions & Instruments 7, New York University Salomon Center.
Karolyi, G.A., 2004, The world of cross-listings and cross-listings of the world: challenging conventional wisdom, NYSE working paper 2004-2.
King, M. and D. Segal, 2004, International cross-listing and the bonding hypothesis, Bank of Canada working paper 2004-17.
King, M. and D. Segal, 2006, The long-term effects of cross-listing, investor recognition, and ownership structure on valuation, Working paper.
Lang, M., K. Lins and D. Miller, 2002, ADR’s, analysts and accuracy: does cross-listing in the US improve a firm’s information environment and increase market value? NYSE working paper 2002-05.
Licht, A., 2003, Cross-listing and corporate governance: bonding or avoiding? Chicago Journal of International Law, 141-163.
Lins, K., D. Strickland and M. Zenner, 2003, Do non-U.S. firms issue equity on US stock exchanges to relax capital constraints?, Journal of Financial and Quantitative Analysis. Liu, S., 2004, The impacts of involuntary foreign delistings: an empirical analysis,
http://ssrn.com/abstract=680641
Liu, S. and J. Stowe, 2004, The shareholder wealth effects of voluntary foreign delistings: an empirical analysis, forthcoming in Applied Financial Economics Letters.
Macey, J., M. O’Hara, and D. Pompilio, 2004, Down and out in the stock market: The law and finance of the delisting process, Working Paper.
McDonald, C.G., Van de Gucht, L.M., 1999, High-yield bond default and call risks. Review of Economics and Statistics 81, 409–419.
Merton, R., 1987, A simple model of capital market equilibrium with incomplete information, Journal of Finance 42, 483-510.
Miller, Darius, 1999, The market reaction to international cross-listings: evidence from depositary receipts, Journal of Financial Economics 51, 103-123.
Mittoo, U., 1992, Managerial perceptions of the net benefits of foreign listing; Canadian evidence, Journal of International Financial Management and Accounting 4, 40-62. Mittoo, U., 2003, Globalization and the value of US listing: revisiting Canadian evidence,
Journal of Banking and Finance 27, 1629-1661.
Noronha, G., A. Sarin and S. Saudagaran, 1996, Testing for liquidity effects of international dual listings using intraday data, Journal of Banking and Finance 20, 965-983.
Pagano, M., A. Roell, and J. Zechner, 2002, The geography of equity listing: why do companies list abroad? Journal of Finance 57, 2651-2594.
Pulatkonak, M. and G. Sofianos, 1999, The distribution of global trading in NYSE-listed non-U.S. stocks, NYSE Working Paper 99-03.
Sanger, G. C. and J. D. Peterson, 1990, An empirical analysis of common stock delistings, Journal of Financial and Quantitative Analysis, 25(2).
Sarkissian, S. and M. Schill, 2004, The overseas listing decision: new evidence of proximity preference, Review of Financial Studies, forthcoming.
Shumway, T., 2001, Forecasting bankruptcy more accurately: a simple hazard model. Journal of Business 74, 101–124.
Siegel, J., 2004, Can foreign firms bond themselves effectively by renting US securities laws?, Journal of Financial Economics, forthcoming.
Smith, K. and G. Sofianos, 1997, The impact of an NYSE listing on the global trading of non-US stocks, NYSE working paper 97-02.
Tinic, S. M. and R. R. West, 1974, Marketability of common stocks in Canada and the U.S.A.: a comparison of agent versus dealer dominated markets, Journal of Finance 29, 729-746.
Figure 1: Involuntary Delistings. This graph examines the yearly percentage of cross-listed firms involuntarily delisting by country and stock exchange. For example, in each period (Pre-2001 and Post-2001), the numerator includes the number of firms that were involuntarily delisted during the period, and the denominator includes the number of firm-year observations during the period. ROW indicates firms listing in the United States from all countries except Canada and the United States.
Figure 2: Involuntary Delistings by Size and Country. This graph examines the yearly percentage of cross-listed firms involuntarily delisting by size grouping and country. ROW indicates firms listing in the United States from all countries except Canada and the United States.
Figure 3: Number of Analysts. This graph shows the average analyst coverage from two years prior to listing to seven years after listing for Canadian firms cross-listing on a U.S. exchange between 1988 and 1999. The average number of analysts following the firm is presented for only those firms where a match has been found in I/B/E/S, so results may be biased towards increased coverage if the firms without a match had no analyst coverage throughout the sample period. Firms are grouped into categories based on their current status. Other is mainly comprised of voluntary delistings.
Figure 4: Event Study of Involuntary Delisting Returns. Abnormal returns are calculated using a 2-factor market model, with the Canadian SP60 Index and the U.S. SP500 Index as the two market factors. Specifically, coefficients are estimated for each security over the period from 350 days prior to the delisting to 50 days prior to the delisting using the following regression:
t i t SP SP i t SP SP i t i
r
r
r
,=
α
+
β
, 60 60,+
β
, 500 500,+
ε
,Stocks with a price of less than $0.20 and stocks that traded on less than 50 days during this 300 day estimation window are removed. Stocks that have ceased trading in Canada prior to the U.S. delisting or within the ten days following the delisting are also excluded. Event Day 0 is the date of the delisting in the United States. The sample includes 52 Canadian firms.
Figure 5: Liquidity around the delisting date. This figure shows the average dollar trading volume for Canadian stocks that delisted in the U.S. and maintained their listing in Canada. Stocks with a price of less than $0.20 and stocks that traded on less than 50 days during this 300 day estimation window are removed. Stocks that have ceased trading in Canada prior to the U.S. delisting or within the ten days following the delisting are also excluded. Event Day 0 is the date of the delisting in the United States. The sample includes 52 Canadian firms.
Figure 6: Involuntary Delistings by Industry. This graph examines the yearly percentage of cross-listed firms involuntarily delisting. For example, in each industry, the numerator includes the number of firms that were involuntarily delisted in that industry, and the denominator includes the number of firm-year observations in that industry.
Figure 7: Canadian vs. US matched Sample. This graph examines the yearly percentage of cross-listed firms involuntarily for Canadian and matched U.S. firms. The sample includes 386 matched pairs of firms. In each subset, the numerator includes the number of firms that were involuntarily delisted during the period, and the denominator includes the number of firm-year observations during the period.
Table 1: Numerical Continued Listing Criteria of U.S. Exchanges. For each exchange, this table shows a high and a low required threshold for each of the numerical listing criteria. If a firm is below the high threshold for one criteria, it may be able to maintain its listing if it meets certain thresholds along some of the other criteria. However, if the firm is below any of the low threshold criteria, it would be subject to suspension or delisting. This table is only meant as a top-level display of the exchanges continued listing criteria. For full details on each exchange’s listing criteria, refer to the exchange listing manual.
NYSE Nasdaq Capital Market
AMEX High
Threshold Threshold Low Threshold High Threshold Low Threshold High Threshold Low
Shareholder’s Equity $75
million million $2.5 $6 million
Market Value $375
million million $25 million $35 million $50
Net Income $25 million in cash flows over 3 years $500,000 (last year or in 2 of 3 last years) $750,000 (Pre-tax) Substantial Losses
Public Float (Shares) 600,000 600,000 500,000 500,000 1,100,000 200,000 Market Value of Public Float $1 million $1 million $15 million $1 million Minimum Price $1 $1 $1 $1 Shareholders 1200 400 300 300 400 300 Market makers 2 2
Table 2: Involuntary Delistings by Year.
Year NYSE / AMEX Nasdaq
# Delists # Firms Listed # Delists # Firms Listed
1988 0 83 0 124 1989 0 97 0 138 1990 1 110 7 147 1991 0 124 6 145 1992 1 139 9 162 1993 1 167 1 175 1994 2 213 9 198 1995 7 232 3 216 1996 0 275 6 253 1997 3 324 8 272 1998 5 347 9 279 1999 5 360 14 291 2000 7 390 8 320 2001 3 409 12 309 2002 6 415 20 281 2003 5 420 3 240 2004 6 432 1 218 2005 1 428 6 204 2006 1 405 2 170 Total 54 5,370 124 4,142
Table 3: Delistings by Country.
Country NYSE/AMEX Nasdaq OVERALL
# TOT Prop. # TOT Prop. # TOT Prop.
Argentina 0 11 0 0 4 0 0 15 0 Australia 2 13 .15 6 21 .29 8 34 .24 Austria 0 1 0 . . . 0 1 0 Belgium 0 2 0 1 1 1 1 3 .33 Brazil 0 11 0 . . . 0 11 0 Canada 28 222 .13 88 205 .43 116 427 .27 Chile 1 25 .04 . . . 1 25 .04 China 0 13 0 . . . 0 13 0 Colombia 0 1 0 . . . 0 1 0 Denmark 1 3 .33 1 2 .5 2 5 .4 Finland 0 4 0 0 3 0 0 7 0 France 1 24 .042 1 13 .077 2 37 .054 Germany 0 17 0 3 11 .27 3 28 .11 Ghana 0 1 0 . . . 0 1 0 Greece 0 4 0 0 2 0 0 6 0 Hong Kong 0 6 0 0 3 0 0 9 0 Hungary 0 1 0 . . . 0 1 0 India 1 10 .1 0 1 0 1 11 .091 Indonesia 0 2 0 . . . 0 2 0 Israel 0 6 0 6 44 .14 6 50 .12 Italy 0 11 0 0 1 0 0 12 0 Japan 0 19 0 1 14 .071 1 33 .03 Korea 0 8 0 0 2 0 0 10 0 Luxembourg 0 3 0 0 6 0 0 9 0 Mexico 7 31 .23 1 2 .5 8 33 .24 Netherlands 2 22 .091 4 17 .24 6 39 .15 New Zealand 1 5 .2 1 4 .25 2 9 .22 Norway 0 8 0 0 2 0 0 10 0
Papua New Guinea . . . 0 1 0 0 1 0
Peru 1 3 .33 . . . 1 3 .33 Philippines 2 3 .67 . . . 2 3 .67 Poland . . . 1 1 1 1 1 1 Portugal 0 3 0 . . . 0 3 0 Russian Federation 0 4 0 . . . 0 4 0 Singapore . . . 0 4 0 0 4 0 South Africa 0 6 0 3 14 .21 3 20 .15 Spain 0 7 0 0 1 0 0 8 0 Sweden 1 3 .33 1 14 .071 2 17 .12 Switzerland 0 12 0 0 1 0 0 13 0 Taiwan 0 5 0 0 1 0 0 6 0 Turkey 0 1 0 . . . 0 1 0 United Kingdom 5 73 .068 6 68 .088 11 141 .078 Venezuela 1 3 .33 . . . 1 3 .33 Total 54 607 .089 124 463 .27 178 1070 .17 Total – ROW 26 385 .068 36 258 .14 62 643 .096