The Impact of Equal Employment Opportunity -Affirmative
Action in U.S. and New Economic Policy in Malaysia on
Employment and Reverse Discrimination
====================================================== Oleh: Muhamad Ali Embi dan Norapiah Abd. Rahman
ABSTRACT
Penggubalan polisi Equal Employment Opportunity -Affirmative Action (EEO-AA) bertujuan memastikan wujud keseimbangan peluang pekerjaan di antara kaum majoriti dan minoriti di Amerika Syarikat. Di Malaysia pula, Dasar Ekonomi Baru (DEB)diwujudkan bagi menyeimbangkan status ekonomi di antara pelbagai etnik. Kajian ini pertamanya bertujuan untuk menganalisis sejauhmana EEO-AA dan DEB dapat mencapai matlamat untuk menyeimbangkan peluang pekerjaan di Amerika Syarikat dan juga status ekonomi antara etnik di M alaysia. Keduanya, untuk menganalisis sama ada EEO-AA dan DEB ini
PHQ\HEDENDQ EHUODNXQ\D ³UHYHUVH GLVFULPLQDWLRQ´ Hasil kajian mendapati EEO-AA hanya memberi impak yang kecil kepada golongan minoriti di Amerika Syarikat. Di Malaysia pula, DEB telah berjaya meningkatkan jumlah partisipasi Bumiputera di dalam pelbagai sektor. Manakala kedua-dua polisi tidak
PHQ\HEDENDQ EHUODNXQ\D ³UHYHUVH GLVFULPLQDWLRQ´
Keywords: discrimination, affirmative action, equal employment opportunity, reverse discrimination
I. INTRODUCTION
In the United States (US), the discriminations towards minorities, especially on employment before 1960s, have made American government develop law on employment discrimination. This law is basically based on Title VII of
the Civil Right Act 1964 (as Amended in 1972) is to make sure Equal Employment Opportunity (EEO) and affirmative action (AA) has been followed in employment. But, one widespread criticism of AA is that it has resulted "reverse
DEMOKRASI Vol. VIII No. 2 Th. 2009 128
discrimination", that is hiring and promoting women and minorities over presumably better qualified white males1. While in Malaysia, the New
Economic Policy (NEP) was drawn up in 1970 to combat what the Malaysian government perceived as the underlying causes of communal tension poverty and imbalance between the economic status of different ethnic groups2. This policy
also has been criticized to cause a reverse discrimination in employ-ment, education and business, because in practice implementation of NEP has centered on establishment of quotas. Although these two policies are different in concept and practice, both have similarity impact on employ-ment and raised a question of reverse discrimination.
II. PURPOSE OF THE STUDY
The purpose of this study is to see the impact of EEO-AA in US and NEP in Malaysia in aspect of employment and reverse discrimination. This study were divided in two discussion. First, it will focus on the impact of EEO-AA on White, African American and Hispanic in terms of employment in
1
Benokraitis, N.V, and Feagin, J.R. 1978. Affirmative Action and Equal Employment Opportunity Action. Inaction, Reaction. Colorado: West view Press.
2
Bunge, F.M. 1984. Malaysia A Country Study.
(4th. ed.). Foreign Area Study.
the civilian labor force, income level and reverse discrimination in civilian labor force. Second, in Malaysia, this study will concentrate the impact of the NEP on Bumiputera (literally son of the soil), Chinese and Indians in terms of employment by sector, work category and reverse discrimination in aspect of professional high paying works.
III. EEO-AA IN U. S. Background
EEO policy has been acted Under Title VII of the Civil Right Act on 1964 to end discrimination based on race, color, religion, sex or national origin in condition of employment3. In addition of EEO
policy, AA is the effort to seek out and prepare members of minorities for opportunities in business, industry and education4. In practice, AA
concept was established the quotas for minorities and led to what was described as reverse discrimination to White men, but the establishment a fixed quota is not allowed as US Supreme Court held in the case of University of California Regents v.
3
Battles, M. S. & et. al. 1977. 7he Manager's Guide To Equal Employment Opportunity.
New York: Executive Enterprise Publication.
4
Lee, R.A. 1983. Encyclopedia USA. Florida: Academic international Press.
Bakke5:
"The fixed quotas may not be set for places for minority applicants for medical school if white applicants are denied a chance to compete for these places. The court however said that professionals may not consider race as a factor in making decision on admission."
5
Gwinn, R.P. 1985. 7he New Encyclopedia Britannica (Val. 1). Chicago: Encyclopedia Britaininca Inc.
Implementation
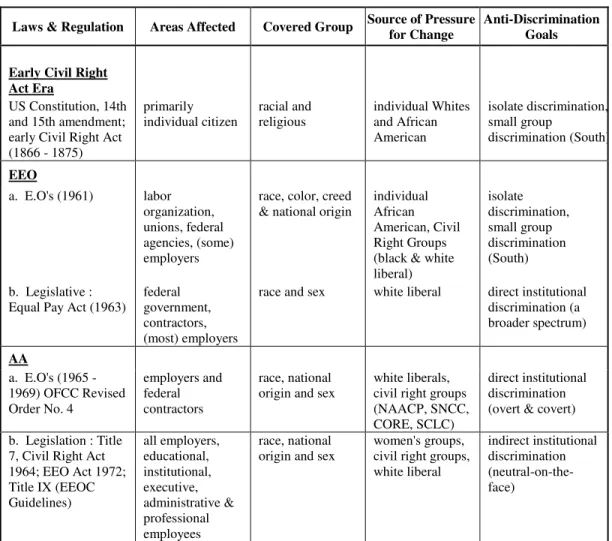
The implementations of EEO-AA are based on several laws and regulations. We can see more information about these laws and regulations in Table I that summarize information on anti-discrimination in U. S. This strategies are including covered group, source of pressure for change and the goals.
DEMOKRASI Vol. VIII No. 2 Th. 2009 130
Table 1. Characteristic of Anti discrimination Strategies (Employment)
Laws & Regulation Areas Affected Covered Group Source of Pressure for Change
Anti-Discrimination Goals Early Civil Right
Act Era
US Constitution, 14th and 15th amendment; early Civil Right Act (1866 - 1875) primarily individual citizen racial and religious individual Whites and African American isolate discrimination, small group discrimination (South) EEO a. E.O's (1961) labor organization, unions, federal agencies, (some) employers
race, color, creed & national origin
individual African American, Civil Right Groups (black & white liberal) isolate discrimination, small group discrimination (South) b. Legislative :
Equal Pay Act (1963)
federal government, contractors, (most) employers
race and sex white liberal direct institutional discrimination (a broader spectrum) AA a. E.O's (1965 - 1969) OFCC Revised Order No. 4 employers and federal contractors race, national origin and sex
white liberals, civil right groups (NAACP, SNCC, CORE, SCLC)
direct institutional discrimination (overt & covert) b. Legislation : Title
7, Civil Right Act 1964; EEO Act 1972; Title IX (EEOC Guidelines) all employers, educational, institutional, executive, administrative & professional employees race, national origin and sex
women's groups, civil right groups, white liberal
indirect institutional discrimination (neutral-on-the-face)
Source: Feagin and Benokritis, Affirmative Action and Equal Opportunity: Action Inaction, Reaction; p(196), Table 7.1.
IV. NEP IN MALAYSIA
Background
The riots 1969 (race's conflict) in Malaysia shows the major causes for the crisis in economic inequality among Malays, Chinese and Indians.
The failure of earlier economic policies to address the relative deprivation of the Malays in comparison to non Malays as being
the underlying root cause of the crisis. Generally, Chinese tend to have higher level of schooling, a more diverse occupational structure and above average incomes. Indians tend
to hold an intermediate status between Chinese and Malays. Table 2 show that the income gap between Malays and non-Malays had widened in the relative.
Table 2.
Malaysia ± Mean and Median Household Income by Ethnicity
(in RM$ per month)
Ethnicity 1957/58 1970
mean median mean median
Bumiputera 139 112 177 122
Chinese 300 223 399 269
Indians 237 188 310 195
TOTAL 215 156 267 167
Source: Osman Rani, 1990. "Malaysia's New Economic Policy After 1990"; Southeast Asia Affair 1990, p(212) Table 3.
To correct the economics in-equality between races in Malaysia, Malaysian government had launched NEP in 1970. This policy set a goal of 30 percent Bumiputera ownership in the commercial and industrial sectors by 1990 and non- Malay would control 40 percent6. Objective And Implementation
There are two objectives to be achieve in NEP. The first objective is "eradicating poverty by raising income levels and increasing
6
Bunge, F.M. 1984. Op cit.
employment opportunities for all Malaysian, irrespective of race", and the second objective is "accelerating the process of restructuring the Malaysian society to correct economic imbalance, so as to reduce and eventually eliminate the iden-tification of race with economic function7.
In practice, the implementation of the NEP has centered on the establishment of quotas, incentive, loan programs and state enterprise
7
Osman Rani. 1990. "Malaysia's New Economic Policy After 1990" in Southeast Asean Affair 1990. Colorado: West view Press.
DEMOKRASI Vol. VIII No. 2 Th. 2009 132
such as MARA (Trust Council for Indigenous People), PNB (National Corporation), MIDA (Malaysia Industrial Development Authority), and PERNAS (National Corpo-ration) to benefit indigenous ethnic group - primarily the Malays.
V. ANALYSIS
There are two main purposes of this analysis. First, to find out the impact of EEO-AA on employment opportunities and income level to minorities (African American and Hispanic) and reverse discri-mination to White workers in U.S. Second, to determine the impact of
NEP on employment opportunities to Bumiputera and reverse discrimination to Chinese and Indian workers in Malaysia. The percentage was used to find out the impact of EEO-AA and NEP on employment, and simple regression analysis was used to analyzed reverse discrimination.
1 Impact Of EEO-AA Employment
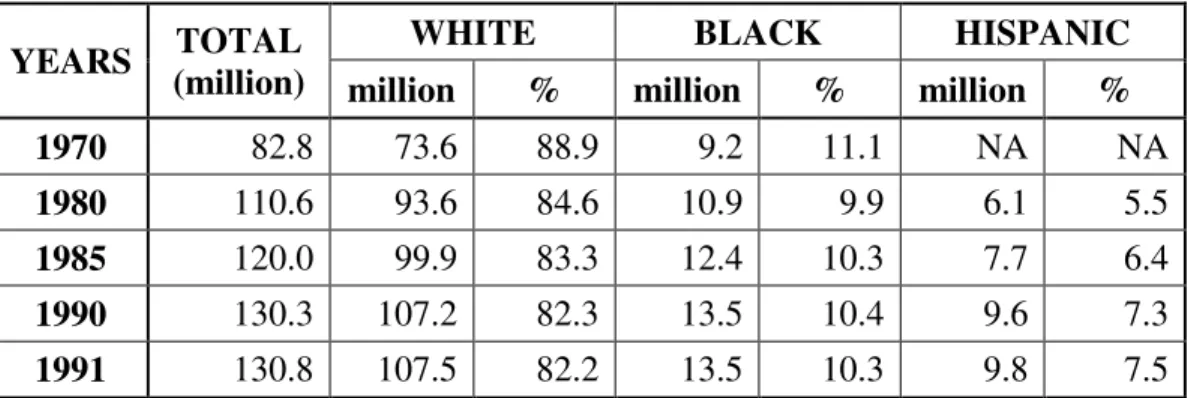
The analysis was primarily based on Civilian Labor Force data, recorded from 1970, until 1991.
Table 3.
Civilian Labor Force by Race in United State
YEARS TOTAL
(million)
WHITE BLACK HISPANIC
million % million % million %
1970 82.8 73.6 88.9 9.2 11.1 NA NA
1980 110.6 93.6 84.6 10.9 9.9 6.1 5.5
1985 120.0 99.9 83.3 12.4 10.3 7.7 6.4
1990 130.3 107.2 82.3 13.5 10.4 9.6 7.3
1991 130.8 107.5 82.2 13.5 10.3 9.8 7.5
Source: Statistical Abstract of United States 1992 (112th. ed.), page 381
Table 3 shown that percentage of White workers in civilian labor force has been declined. In 1970, the
percentage of White workers was 88.9%. In 1980, this percentage was declined 4.3% to 84.6%. In year
after, the percentage of White workers was declined on average 1% every year. African American had higher percentage on employment in Civilian Labor Force but actually these higher percentages were included with other races. Inyear after, the percentages of African American in civilian labor force were slightly increase, except in 1991 the percentage of African American workers was dropped 0.1 % to 10.3%. However, the increasing percentage of Hispanics workers
showed higher than African American in civilian labor force. For instance, among 1980 to 1991 the increasing averages were 0.7% each year. From this discussion we can conclude that EEO-AA have small positive impact on employment to minorities.
Income
Income level between White and minorities shown that White income level was higher than minorities. Between the two minorities, Hispanic were doing better.
Table 4.
Percent Distribution of Income Level by Race in United State
INCOME US$ 1970 1990
WHITE BLACK HISPANIC WHITE BLACK HISPANIC
Under $10,000 14.3 28.0 20.3 12.8 30.8 21.1 $10,000 - $14,999 8.2 13.5 13.8 9.2 11.6 12.9 $15,000 - $24,999 17.1 22.3 24.2 17.7 19.1 21.1 $25,000 - $34,999 18.9 15.6 17.4 16.1 13.5 16.5 $35,000 - $49,999 20.8 12.1 15.5 18.0 13.1 14.8 $50,000 - $74,999 14.6 7.0 6.9 15.8 8.1 9.1 Over $75,000 6.1 1.5 2.0 10.4 3.8 4.3
Source: Feagin and Benokritis; Affirmative Action and Equal Opportunity: Action Inaction, Reaction; p(196), Table 7.1.
As Table 4 shown, in 1970 percentage of White income below US$10,000 is 14.3%, compare to African Ame-rican 28% and Hispanic 20.3%. For
income over US$75,000, White has the higher percentage that is 6.1%, African American 1.5% and Hispanic 2.0%. Majorities of White
DEMOKRASI Vol. VIII No. 2 Th. 2009 134
have income level between US$ 35,000 and US$49,999. Majority's income for African American is below US$ 10,000 and Hispanic between US$ 15,000 and US$ 24,999. In 1990, percentage of White income below US$ 10,000 is reduce 1.5% to 12.8%. For, African American and Hispanic, the percentages of income under US$ 10,000 were increased, African American 2.8% to 30.8% and Hispanic 0.8% to 21.1 %.
For income level over US$ 75,000, White has the highest increasing percentage from 6.1% to 10.4%, African American 2.3% to 3.8% and Hispanic 2.3% to 4.3%. Majorities of White still have income between US$ 35,000 and US$ 49,999, African American below US$ 10,000 and majorities of Hispanic have income level below US$ 10,000 and between US$ 15,000 and US$ 24,999.
Reverse Discrimination
This analysis was based on Table 3 recorded from 1970, 1980, 1985, 1990 and 1991. A simple linear regression was used for estimating the relationship between the percentage of White male workers in civilian labor force and number of minorities (African American and Hispanic) workers. To find out the reverse discrimination, the alternative hypotheses (Ha) were established as
shown below:
Ha -The increase of minorities' workers will decrease the percentage of White male workers in civilian labor force.
For the purpose of analysis the model was established as shown below:
PWW = ( o + 1TMW)
PWW = Percentage of White male workers in civilian labor force. TMW =Total number of minorities Parameter o= estimate the level or
intercept of the model.
Parameter 1= estimate the changes number of minorities in civilian labor force.
By running a simple linear regression on percentage of White workers (PWW) against number of minorities' workers (TMW), we obtained the following equation (see Appendix 1 for detail result):
PWW = 93.077 + (-0.477) TMW
0.517 0.027 R2 = 0.991
The very high values of R2 (0.991) suggest the strength of the linear. This coverage the facts that 99.1 % of the percentage of White male workers can be explain by number of minorities. Therefore, only 0.9% of the variable have not accounted for.
The slope 1 for this model is
estimated at -0.477, meaning percentages of White male workers
reduce at an average more than 0.4. As a result, the increase number of minorities in civilian labor force will decline slightly the percentage of White male workers. It seems that the increasing numbers of minorities in civilian labor force have little impact on reverse discrimination to White male workers.
This finding also has been support by Burstein and Monaghan that found the number of reverse discrimination cases decided by the appellate courts has small, just 91 or 4.4% of all EEO cases had been decided by the end of 1983 and the proportion has no tendency to increase as Table 5 shows.
Table 5.
Reverse Discrimination Cases in the Appellate Court
YEAR NO. OF CASES % OF ALL EEO CASES
1965 0 NA 1966 1 12.5 1967 0 0.0 1968 0 NA 1969 1 5.6 1970 1 4.0 1971 1 1.6 1972 3 3.3 1973 4 4.5 1974 2 2.2 1975 8 6.0 1976 6 4.8 1977 2 1.1 1978 8 5.2 1979 9 6.0 1980 11 5.1 1981 14 5.5 1982 10 4.3 1983 10 4.3 TOTAL 91 4.4
Source: Burstein and Monaghan, "EEO and Mobilization of Law"; Law and Society Review; p(380)
DEMOKRASI Vol. VIII No. 2 Th. 2009 136
2 Impact Of NEP Emplovment
Table 6 shown that, in early NEP implementation, Bumiputera were majority in agriculture sector. They were involved in agriculture such
as padi farmers, fishermen, estate workers, rubber small holders, oil palm and coconut. But Chinese shares of employment were spread in all major sectors of economic.
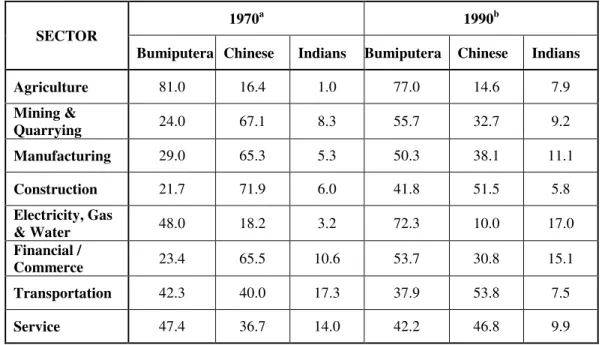
Table 6.
Malaysia ± Percentage Employment Distribution by Sector and Ethnicity, 1970 and 1990
SECTOR
1970a 1990b
Bumiputera Chinese Indians Bumiputera Chinese Indians
Agriculture 81.0 16.4 1.0 77.0 14.6 7.9 Mining & Quarrying 24.0 67.1 8.3 55.7 32.7 9.2 Manufacturing 29.0 65.3 5.3 50.3 38.1 11.1 Construction 21.7 71.9 6.0 41.8 51.5 5.8 Electricity, Gas & Water 48.0 18.2 3.2 72.3 10.0 17.0 Financial / Commerce 23.4 65.5 10.6 53.7 30.8 15.1 Transportation 42.3 40.0 17.3 37.9 53.8 7.5 Service 47.4 36.7 14.0 42.2 46.8 9.9
Note : The percentages do not up to 100 because of rounding errors and the exclusion of the other races.
Source: (a) Department of Statistic 1970, Population Census of Malaysia. Adapted from Sundaram J.K.; A Question of Class; p(294) Table 11.3
After the twenty years of NEP implementation, the policy restructuring employment showed the progress. Bumiputera shares of employment increase in all majors sector of the economy, with double digit growth rates registered in the construction (21 % in 1970 to 41.8 % in 1990), manufacturing (29 % in 1970 to 50.3% in 1990) and
financial sector (23.4% to 53.7%), as shown in Table 6. Although Bumiputera share of employment in agriculture increased, there was a reduction in terms of their number from 1.3 million to 1.2 million, as a result of Bumiputera migrating into the modern sectors of the economy in response to better employment opportunities.
Table 7.
Malaysia - Percentage Of Labor Force By Ethnic And Work Category, 1970 and 1990.
SECTOR
1970a 1990b
Bumiputera Chinese Indians Bumiputera Chinese Indians
Professional & Technical 47.1 39.5 10.8 61.6 29.2 7.8 Administrative & Managerial 24.1 62.9 7.8 30.5 62.9 4.3 Clerical 35.4 45.9 17.2 52.3 38.8 8.7 Sales 26.7 61.7 11.1 33.7 58.6 7.1 Services 44.3 17.3 14.6 62.3 26.9 9.5 Agriculture 72.0 43.7 7.6 77.3 14.0 7.9 Production 34.2 55.9 9.6 49.3 39.7 10.9
Source:(a)Department of Statistic 1970, Population Census of Malaysia. Adapted from Sundaram J.K.; A Question of Class; p(294) Table 11.3
(b) Malaysia, Mid Term Review of the 6th. Malaysia Plan 1991-1995‡p(64) Table 3-2
Table 7 showed that participation of Bumiputera in professional and technical category in 1970 is 47.2%, but 33% of them were in the teaching and nursing profession. In adminis-trative and managerial occupation, the participation of Bumiputera was
24.1 % compare with Chinese 62.9 % and 7.8 % for the Indians.
Table 7 also shown work category by ethnic in 1970 and 1990 and how it changing. In 1990 Bumiputera representation in all work category was increased. Their
DEMOKRASI Vol. VIII No. 2 Th. 2009 138
share in the professional and technical category was increased 14.5% to 61.6%. However, about 45% of them were in teaching and nursing professions. With regard to administrative and managerial
occupations, the share of Bumiputera was 30.5% in 1993 compared with 62.9% for the Chinese. This imbalance was mainly due to the inadequate supply of qualified Bumiputera manpower.
Table 8.
Malaysia -- Registered Professional By Ethnicity; 1985, 1988, 1990, 1992
YEAR BUMIPUTERA CHINESE INDIAN
TOTAL % TOTAL % TOTAL %
1985a 6315 22.2 17408 61.2 3954 13.9
1988a 8583 25.1 19970 58.4 4890 14.3
1990 b 11753 29.0 22641 55.9 5363 13.2
1992 b 15505 31.9 26154 53.8 6091 12.5
Source: (a) Malaysia, Mid Term Review of the 5th. Malaysia Plan 1986-1990. Adapted from as Table 2, p(220) Table 6.
(b) As Table 6, p(66) Table 3
The number of Bumiputera professionals in the high paying registered profession such as architects, accountant and doctors, increased significantly in 1990, as shown in Table 8. However, their share remained relatively low, accounting for 29% of total employment in this occupation in 1990, compared with about 55.9% for the Chinese.
Reverse Discrimination
This analysis was designed to see whether the increasing numbers of Bumiputera workers in professional
high paying work cause reverse discrimination to Chinese and Indians. This study was based on Table 8. The data was recorded from 1985,1988,1990 and 1992. A simple linear regression has been used for estimating the relationship between the percentage of Chinese and Indians and the number of Bumiputera in professional high paying works. To find out the reverse discrimination the alternatives (Ha) were established
Ha - The increase number of Bumiputera workers in professional high paying work will reduce the percentage of Chinese and Indians workers.
For the purpose of analysis, the model was established as shown below:
PCI = 0 + 1 TB
PCI- Percentage of Chinese and Indian in professional high paying work.
TB- Number of Bumiputera in professional high paying work.
0 - estimate the level or intercept of the model.
1 -estimate the changes of number of Bumiputera.
By running a simple linear regression on percentage of Chinese and Indian (PCI) in professional high paying work against the number of Bumiputera workers (TB) we obtained the following equation:
PCI = 81.006 + ( -0.001) TB 0.730 0
R2 = 0.991
The very high values of R2 (0.991) suggest the strength of the linear. This conveys the facts that 99.1% of the percentage of Chinese and Indians workers in professional work can be explained by the number of Bumiputera. Therefore, only 0.9% the variables have not been accounted for.
The slope 1 for this model is
estimate at -0.001, meaning percentage of Chinese and Indians
workers have small negative influence to the number of Bumiputera in professional high paying work. As a result, the increasing numbers of Bumiputera in professional high paying work cause only small reverse discrimination to Chinese and Indians.
VI. CONCLUSION 1. Findings
Overall, EEO-AA policy caused little impact on minorities. For instance, in Civilian Labor Force the minority percentage was increasing slightly especially for African American group. Majorities of minorities also have income level below US$ 10,000 and just a small number of minorities have income over US$ 75,000. However, the NEP policy seems to increase Bumiputera participation in variety of sector and work category. In professional area such as doctor, accountant and lawyer, there are increasing number of Bumiputera participation.
Finally, reverse discrimination doesn't seem to be very widespread during the implementation of EEO-AA and NEP. For instance, increasing of one million minorities in Civilian Labor Force will decrease 0.477 percent of White male workers. However in NEP, increasing of one million Bumiputera in professional high paying works will reduce only 0.001 percent of Chinese and Indians workers.
DEMOKRASI Vol. VIII No. 2 Th. 2009 140
2 . Suggestions
Representative Bureaucracy
In dealing with discrimination, the best way is to have the "watch dog" organization (for example, Equal Employment Opportunity Commission (EEOC) in U.S.) that establish greater social representation. This will help to reduce the bias in action towards discrimination in employment and create responsive-ness to the needs of peoples. Rosenbloom8 in his book "Public
Administration: Understanding Mana-gement, Politics and Law in the Public Sector" says that representative is related to responsiveness because it is assumed that a representative bureaucracy will have similar perspective on question of public policy as the majority in the legislature and in the electorate.
8
Rosenbloom, D.H. 1989. Public Administration: Understanding Manage-ment, Politics, and Law in the Public Sector (2nd. ed.). New York: Random House.
Decentralization
The "watch-dog" organization also should have greater decentralization power. Chandler and Piano9 (1988,179)
stated that decentralization of decision making can contribute to the effectiveness of administrative operations because it's permits some measures of adaptation to local conditions and needs. It also spreads decision making responsibilities among a number of officials and gains greater understanding of problems. Hopefully with decentralization of "watch dog" organization can provide quick resolutions of problems related to prohibited discrimination.
9
Chandler, R.C. and Plano, J.C. 1988. 7he Public Administration Dictionary (2nd. E d ) .
REFERENCES
Battles, M. S. & et. al. 1977. 7he Manager's Guide To Equal Employment Opportunity. New York: Executive Enterprise Publication.
Benokraitis, N.V, and Feagin, J.R. 1978. Affirmative Action and Equal Employment Opportunity Action. Inaction, Reaction. Colorado: West view Press.
Bunge, F.M. 1984. Malaysia A Country Study. (4th. ed.). Foreign Area Study. Burstein and Monaghan.1986. "Equal Employment Opportunity and The
Mobilization of Law". Law and Society Reviews. Vol. 20, No. 3, 1986 Chandler, R.C. and Plano, J.C. 1988. 7he Public Administration Dictionary (2nd.
E d ) . California: ABC-CLIO.
Gwinn, R.P. 1985. 7he New Encyclopedia Britannica (Val. 1). Chicago: Encyclopedia Britaininca Inc.
Lee, R.A. 1983. Encyclopedia USA. Florida: Academic international Press.
Malaysia. 1988. Mid Term Review of the 5th. Malaysia Plan 1986-1990. Kuala Lumpur: Percetakan Nasional Malaysia Bhd.
Malaysia. 1993. Mid Term Review of the 6th. Malaysia Plan 1991-1995. Kuala Lumpur: Percetakan Nasional Bhd.
Osman Rani. 1990. "Malaysia's New Economic Policy After 1990" in
Southeast Asean Affair 1990. Colorado: West view Press.
Rosenbloom, D.H. 1989. Public Administration: Understanding Management, Politics, and Law in the Public Sector (2nd. ed.). New York: Random House.
Sundaram, J.K. 1986. A Question of Class: Capital, the State and Uneven Development In Malaya. New York: Oxford University Press.
United States Department of Commerce. 1992. Statistical Abstract of the United State 1992-(112th. ed.). Washington: Bureau of the Census.
DEMOKRASI Vol. VIII No. 2 Th. 2009 142