Procedia - Social and Behavioral Sciences 217 ( 2016 ) 719 – 728 Available online at www.sciencedirect.com
ScienceDirect
1877-0428 © 2016 Published by Elsevier Ltd. This is an open access article under the CC BY-NC-ND license (http://creativecommons.org/licenses/by-nc-nd/4.0/).
Peer-review under responsibility of Future Academy® Cognitive Trading
doi: 10.1016/j.sbspro.2016.02.132
Future Academy®’s Multidisciplinary Conference
A Development of The 3PL MMM-IRT Model
for Identifying Latent Class
Pattaraporn Jensuttiwetchakul
a*, Sirichai Kanjanawasee
b, Sungworn Ngudgratoke
c aPh.D. Student in the Department of Educational Research and Psychology, Chulalongkorn University, Bangkok 10330, Thailand b
Professor in the Department of Educational Research and Psychology, Chulalongkorn University, Bangkok 10330, Thailand c
Assistant Professor in the Department of Educational Measurement and Evaluation, Sukhothai Thammathirat Open University Nontaburi 11120, Thailand
Abstract
While multilevel mixed-measurement IRT is crucial for identifying latent class, the two-parameter IRT Model used in previous studies is inadequate. The three-parameter is therefore suggested to improve such identification. How can a three parameters multilevel mixed-measurement IRT model be applied to improve the identification, classification, and measurement of school latent class? This research aims to improve the effectiveness of the model for identifying latent class by proposing the three-parameter multilevel mixed-measurement IRT Model (3PL MMM-IRT Model). This study argues that the developed model does not only enhance efficiency of parameter estimation, but is also suitable for using in school context. The proposed model was developed by using Program R. Students’ scores from Thailand’s annual Ordinary National Educational Test (O-NET) were used. Four hundred and sixteen schools were randomly selected into this study. Students’ abilities were first estimated by 3pl-IRT model. Later, abilities of schools were calculated from their students’ abilities. Finally, school latent classes were reached by using latent class model. The results indicated that the developed model improves the effectiveness of the classification and measurement of school latent class. The findings also enable schools and teachers to identify not only varied abilities but also strengths and weaknesses of their students, which are crucial for improving their teaching procedure and class management. This study reveals that the inclusion of guessing parameters into the Multilevel Mixture IRT model helps to improve the effectiveness of such model. Furthermore, the developed model can be applied to classify school latent class based on students’ abilities, which contributes to increased teaching performance and effectiveness.
© 2016 The Authors. Published by Elsevier Ltd.
Peer-review under responsibility of Future Academy® Cognitive Trading. Keywords: 3pl-IRT; Latent Class Model; Multilevel Model
* Corresponding author. Tel.: +6687-672-8158. E-mail address: [email protected]
© 2016 Published by Elsevier Ltd. This is an open access article under the CC BY-NC-ND license (http://creativecommons.org/licenses/by-nc-nd/4.0/).
1.Introduction
Previous educational measurements have classified students into groups according to their learning capacity using the school average point score. However, in reality such classification may not always be correct, because while one student’s latent abilities may be similar to those of another in a different school, it may as well vary from one to another despite their being in the same school. (Tay et al., 2011) As a result, some educators and statistical analysts have developed methods and models to measure unobserved variables, rather than observed variables, such as the Latent Class Model (LCM), a model used to classify students according to their characteristics and abilities, with individual class variables as unobserved variables related to observed variables, which are category variables. According to research by Rost (1990), who conducted the latent class analysis using logistic model and applied the Item Response Theory (IRT) to combine the two models and generated the Mixture IRT Model, this model is capable of classifying students according to their characteristics or individual class abilities, with individual class variables as unobserved variables related to continuous observed variables. This classification is useful because it allows researchers to obtain each individual’s inner characteristics, therefore enabling them to conduct research more accurately. (Mislevy & Huang, 2007) However, when one looks at the general characteristics of educational institution management, the data are multilevel as well as hierarchical nested data. For example, students are grouped into classrooms and taught in schools affiliated with particular divisions, regions, or districts, so the educational data tend to be multilevel and hierarchical nested data, which result from the education system that is complex and has multilevel and hierarchical nested management, with the lowest levels of management all influenced by variables from higher ones. (Bryk & Raudenbush, 1988; Goldstien, 1987; Kanjanawasee, 2011) Therefore, in tests and educational measurements the structure of multilevel data should be considered. To solve this problem, Cho and Cohen (2010) proposed a measurement model called the Multilevel Mixture IRT (MMixIRT). Initially, this model was applied in the examination of different functions of test or assessment to determine whether the quality of such test or assessment leans toward or favors a particular latent class. The model proposed by Cho and Cohen is a model applied to a one-dimensional model, with the integration of the Mixture IRT with one parameter, which is the item difficulty parameter. Tay et al. (2011) later proposed the Multilevel Mixed-Measurement IRT, MMM-IRT, which is a model with similar features but applied to a multidimensional model, with the integration of the Mixed-Measurement IRT with two parameters, the item difficulty and discrimination parameters. The model is applied in the classification of latent class in organizations according to self-reports of emotion on both individual and international levels. (Tay et al., 2011)
Nevertheless, in previous educational assessments there has neither been a comparison among student groups to determine their abilities and compare them with those of others, nor has there been a comparison among schools. Therefore, the classification of ability classes related to cross-level latent characteristics of each individual will yield a more accurate assessment. That being said, the MMM-IRT will be more suitable for the classification of students or individuals according to their latent characteristics, a measurement at the organizational or school level and will be useful in class analysis. Moreover, the results of the analysis will be part of the decision making on instructional design which is capable of bridging the difference among latent student classes or individuals as well as identifying the impact contributing to effective instructional design.
In addition, the characteristic of standardized tests in Thailand is mainly multiple choices with a major weakness that allows students to get correct answers through wild guessing. As a result, the wild guessing problem is a major source of deviation in measurement, which prevents the measurement results from providing sufficient information in diving respondents into the levels of those who truly know, those who partly know, and those who do not know at all. Furthermore, because of wild guessing, certain groups of test takers may have a measurement model different from that of those who do not make a wild guess.
This research therefore aims to develop the three parameters Multilevel Mixed-measurement Item Response Theory (3PL MMM-IRT) model to reduce the deviation concerning wild guessing. 3PL MMM-IRT, which combines the Multilevel, Latent Class, and 3PL IRT models, will be highly useful in classifying individuals into groups according to their latent abilities, and can also be applied in the analysis of the classification of latent characteristics of each individual as well as the division of empirical data.
2.Related Literature Review
The three parameters Multilevel Mixed-measurement IRT model, 3PL MMM-IRT, was developed based on the concept of the Mixture IRT model, MixIRT, which is the integration of concepts of the IRT and Latent class models. The MixIRT was developed with its emphasis on various dimensions concerning the quality of between class characteristics as well as various dimensions concerning the quantity of within class characteristics (Hernandez et al., 2004), and the multilevel concept was developed as a result.
In organizations or educational divisions the multilevel concept has been applied in various dimensions such as the factor analysis and the item response theory, with its main focus on the construct measurement and measurement equivalence among groups. The concept of traditional difference measurement is applied on observed groups, assuming that all individuals have the same measurement model. However, thanks to advancements in information and technology, the dimensional and latent class concepts have been synthesized by classifying latent class using different measurement models. (Rost, 1991; Rost, Carstensen, & von Davier, 1997)
The multilevel model will analyze the structure concerning the nature of educational and psychological data. The integration of the multilevel model, IRT, and LCM is highly useful because it provides the correct estimate of standard deviation of the model. (Fox, 2005) This combination then led to the development of the dimensional psychological assessment of data on item response consisting of the hierarchical structure. Researchers are therefore able to study the effects of various predictors such as school and curriculum on lower predictors such as student. (Fox& Glas, 2001)
The expansion of the multilevel model was developed for the IRT model (Fox & Glas,2001) and for the LC model. (Rabe-Hesketh, Skrondal & Pickles, 2004; Vermunt, 2003) The proposed multilevel expansion of the Mixed-Measurement model (MMIRT) is greatly related to the IRT and LC models. In reality, this model can be divided into three types of expansion. In research (a) The MM-IRT is expanded by creating the hierarchical class model (b) the multilevel latent class model (MLC) by Vermunt (2003, 2008a), which is expanded by adding characteristics at the bottom level, and (c) the MMIRT model by Vermunt (2008b) is expanded by adding the estimate of individual classes. While these three models of the MMIRT constitute only two major features, which are individual and hierarchical classes, the MMM-IRT model constitutes all three major features, which are individual classes, individual traits, and hierarchical classes. Similar models were proposed by Cho and Cohen (2010) and Tay et al. (2011) but each has different concepts. Cho and Cohen limits the scope of the model to the one-dimensional Rasch model and use the Bayesian estimate, while Tay et al. limit their scope of their model to the multidimensional 2PL model and use the maximum likelihood (ML) estimation. In this study, however, the scope will be the multidimensional 3PL model using theBayesian estimate. It can be said that this is a new model which corresponds to the scope of the general unobserved variable model. This model will also be suitable for nested data and two yield results, and it can be used to conduct a survey of LC for each individual. This integration of these models is presented in Venn’s diagram in Figure 1 below:
Fig.1. Venn’s diagram displaying the integration of models to generate MMM-IRT (Cho, 2007)
As for the MMM-IRT model, it is presented in Figure 2, which displays the nested structure of latent classes, hierarchical classes, and individual classes. The results obtained will then be applied to the IRT model.
Fig. 2. MMM-IRT model: data structure and IRT model (adapted from Tay et al., 2011)
In Figure 2, the figure displays different latent groups (hierarchical and individual). The diagram above shows the probability of item response according to individual and characteristic classes. School latent classes (g) are designated relations of latent characteristics to indicators and are direct results of indicators. Individual abilities (
θ
) are determined by responses in each item, and the proportion of individual abilities designates school abilities (g) and classifies latent classes according to schools abilities (k).The 3PL MMM-IRT model is shown as follows: The probability
⎟
⎠
⎞
⎜
⎝
⎛
~ ty
P
of observing a set of responses in hierarchical unit t, in this case schools t, is shown by∑
=⎟
⎠
⎞
⎜
⎝
⎛
π
=
⎟
⎠
⎞
⎜
⎝
⎛
K 1 k ~ t k ~ tP
y
k
y
P
(1)where k, k = 1,…, K represents latent groups (e.g. school t) similar to LC. Similar to the latent class model,
π
kis the probability of hierarchical units (e.g. school) belonging to latent class k.The probability with condition t
~
P y k
⎛
⎜
⎞
⎟
⎝
⎠
( )
y
k
P
k
y
P
tj n j t t 1 ~ =Π
=
⎟
⎠
⎞
⎜
⎝
⎛
(2)where the probability of observing the item response vector of each individual in school t is the statistical independence of each individual in school groups k. This probability with condition is shown by:
( )
∑
( )
∫
⎟
⎠
⎞
⎜
⎝
⎛
⎟⎟
⎠
⎞
⎜⎜
⎝
⎛
=
=1 ~ ~ ~,
j j j tj G g tjk
g
k
P
y
g
f
d
y
P
π
θ
θ
θ
(3)In this case, the probability of individual classes
π
( )
g k
is contingent on school classes k. However, the probability of item response of each individual j is shown as follows:I tj j i 1 tji j ~ ~
P y
, g
P y
, g
=⎛
⎞
⎛
⎞
θ
=
Π
θ
⎜
⎟
⎜
⎟
⎝
⎠
⎝
⎠
(4) Where j = 1, …,n
tof schools t in a set of item I, which depends on individual classes k and individual characteristicsθj
only. It is the not the function of school classes k, which indicate that each individual class g belongs to the same cluster that is defined by the measurement model
P y
⎛
⎜
tjθ
j, g
⎞
⎟
⎝
⎠
and the invariability across schools and school classes. In addition, local independence is taken into account (within each individual class and the response
θ
j
is statistically independent).
The probability of endorsement is shown as follows:
i tji j i ~ ji
1 c
P y
, g
c
1 exp(
)
⎛
⎞
−
θ
= +
⎜
⎟
+
−η
⎝
⎠
(5)Where the linear term
η
jiis equal toβ
i+
λ θ
i j. The coefficientsβ
i,λ
i andc
i represent item difficulty, item discrimination and item lower asymptote parameter (guessing parameter), respectively.3. Methodology
3.1 Population and Research Participants
The population in this study consists of 341,691 Thai students in basic education from Mattayomsuksa 6 (equivalent to Grades 12), Academic Year 2012, of 3,995 schools in 4 educational divisions, as shown in Table 1: Table 1. Population divided according division and size
Division small medium No. of schools large extra large No. of students
Department of Local Administration 70 164 49 19 16,568
Office of Basic Education Commission 516 1,161 428 392 279,979
Office of Higher Education Commission 2 9 10 4 3,712
Office of Private Education Commission 121 216 109 125 41,432
Total 709 1,550 596 540 341,691
The data used in the study are secondary data obtained from the 2012 database in mathematics of the National Institute of Educational Testing Service, or NIETS. The random sampling is then conducted using the two-stage random sampling. In the school random sampling process the stratified random sampling is applied, and in all school
divisions, the size of school is used as the stratified random sampling to divide schools into four sizes: small (fewer than 300 students), medium (300 students or more, but not exceeding 1,000), large (1,000 students or more, but not exceeding 2,000), and extra-large (2000 students or more). The school random sampling is conducted according to the size and division to which each school belongs using the simple random sampling. The proportion is shown in Table 2 below:
Table 2. Sample groups divided according to division and size
Division No. of random-sample schools sampled schoolsNo. of random- sampled studentsNo. of
small medium large extra large
Department of Local Administration 9 20 6 3 38 2,446
Office of Basic Education Commission 62 140 52 48 302 33,827
Office of Higher Education Commission 1 2 2 1 6 784
Office of Private Education Commission 15 26 14 15 70 6,037
Total 87 188 74 67 416 43,094
3.2 Tools
In this study the test is drawn from the Ordinary National Educational Test (O-NET), which assessed the knowledge and perception of Mattayomsuksa 6 (equivalent to Grade 12), Academic Year 2012, Thai students, in accordance with Thailand’s 2008 national core curriculum for basic education. However, in this research only the mathematics test is studied. The test is a 5-multiple-choice test consisting of 32 test items and is classified as the two-yield point test. The test covers 4 learning areas, which are: 1) Number and Operation, covering 4 learning standards; 2) Measurement, covering 2 learning standards; 3) Algebra, covering 2 learning standards; and 4) Probability and Statistics covering 3 learning standards. In this research4 test items are used to determine the school latent classes.
3.3 Data analysis
One goal of this research is to determine latent classes on the school level using the 3PL MMM-IRT. To achieve that goal in this research an analytical model is developed in Program R using the ltm and Mclust packages. Furthermore, two additional syntaxes are written and added into Program R for analytical purposes. The analytical process is divided in to four steps as follows:
Step 1: Estimate the value of the parameter Ɵ, a, b, c of the 3PL-IRT. Then calculate the probability of endorsement ~
,
tji jP y
⎛
⎜
θ
g
⎞
⎟
⎝
⎠
using the ltm package in Program R and the Empirical Bayes value estimation. Step 2: Find individual latent classes g from the probability and Ɵ obtained from Step 1 using the Mclust package in Program R and the EM Algorithm value estimation.
Step 3: Determine the school ability using the proportion of individual latent classes to calculate the school according to the formula
( )
1 K
i k k k
P
=
∑
=π
P
θ
.Step 4: Determine the school latent classes k from the school ability obtained from Step 3 using the Mclust package in Program R and the EM Algorithm value estimation.
4. Results
The analysis result in brief as follow:
1. The estimated values of parameters a, b, c in the analytical model revealed that 4 test items are of good quality with the guessing values (c) ranging from 0.094 to 0.238, the difficulty values (b) from 1.367 to 1.923, and the discrimination values from 1.371 to 2.031, all of which lied in the item selection qualification range (Urry, 1977), and with the log. likelihood of -104874.3. It is also found that the analytical model enable to calculate the probability values which are divided into 16 groups according to their answer pattern, with the ability values of all 16 groups ranging from -0.231 to 2.069
2. For individual latent class, the analytical model used the probability of endorsement obtained from the first step in classification process. The model can classify students into 5 individual latent classes, as shown in Table 3:
Table 3. Individual Latent Class Analysis Results --- --- Gaussian finite mixture model fitted by EM algorithm ---
Mclust EVV (ellipsoidal, equal volume) model with 5 components:
log. likelihood n df BIC ICL
428.6039 16 70 663.1266 663.1266
Clusteringtable:
1 2 3 4 5
5 3 3 3 2
From Table 3, it is found that Class 1 - 5 have 5, 3, 3, 3 and 2 patterns respectively, with the probability values of all 5 classes as shown in Figure 3:
Fig. 3. Endorsement profiles by individual class
3. The model is also able to calculate the school abilities and the proportion of obtaining correct answers using
the
( )
1
K
i k k k
P
=
∑
=π
P
θ
formula, therefore generating the probability values of each student’s ability in all 416 schools to get the correct answer of each test item. The school ability values are shown in Table 4:Table 4. School ability values in obtaining correct answers for each item
School Item1 Item2 Item3 Item4
1 0.174023 0.201468 0.255413 0.251056
2 0.199487 0.230002 0.272315 0.268075
3 0.149574 0.169202 0.245836 0.233355
...
416 0.166694 0.194035 0.249459 0.246363
4. Finally, the analytical model classifies the latent class at the school level of 416 schools into 6 classes using the school ability data shown in Table 5:
Table 5. School class analysis results ---
Gaussian finite mixture model fitted by EM algorithm ---
Mclust EVV (ellipsoidal, equal volume) model with 6 components:
log. likelihood n df BIC ICL
10336.18 416 84 20165.78 20101.04
Clustering table School Class
1 2 3 4 5 6
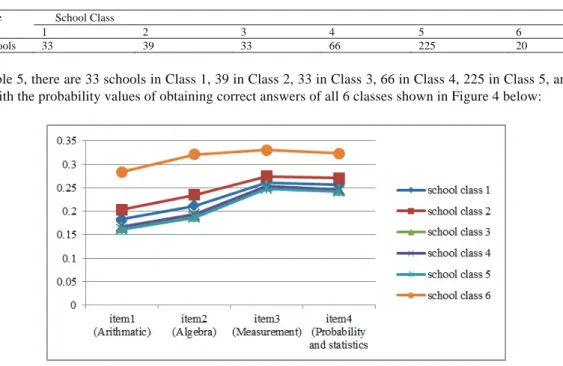
Number of schools 33 39 33 66 225 20
From Table 5, there are 33 schools in Class 1, 39 in Class 2, 33 in Class 3, 66 in Class 4, 225 in Class 5, and 20 in Class 6, with the probability values of obtaining correct answers of all 6 classes shown in Figure 4 below:
Fig. 4. Endorsement profiles by school class 5. Conclusion and discussion
This study aims to develop a model classifying latent class at the school level using the 3PL MMM-IRT principles, and then test the model using real data. As for the development of the model, the research is conducted using Program R along with the use of 2 main packages, ltm and Mclust, where ltm is applied in the estimation of parameter values while Mclust is applied in the classification of latent classes.
Concerning the testing of the model, it can be seen that the developed model is able to generate the estimates of the parameter values, with the log. likelihood value at -104,874.3. The model is also capable of classifying latent classes at both the individual and school levels, as they are shown in Tables 3 and 5, with the BIC values at 663.1266 and 20,165.78 respectively. Such BIC values are the optimal value in determining the number of latent classes at the individual and school levels respectively.
This research has contribution in both theory and practice. In theory, it is the further development from the 2PL MMM-IRT, with the inclusion of the guessing parameter into the model. Such inclusion is suitable for educational purposes as the majority of standardized tests are multiple choices, which therefore allows guessing to affect the measurement model. Furthermore, the suitable measurement results will be suitable for generating the correct classification of latent classes.
The utilization of this research in practice areas follows: in at the policy decision making level, organization as Department of Local Administration, Office of Basic Education Commission, or Office of Higher Education Commission can apply the 3PL MMM-IRT Model to classify school according to student abilities, and such division also facilitate school administration in determining what area needs to be improved. In addition, the model can be used to measure abilities not only in national testing but also in international testing. In the cluster of education institute level such as Rajabhat University Network, Rajamangala University of Technology system can apply the 3PL MMM-IRT model in the similar manner as the application at the national level. At the university or the educational institution level also can apply the model in classifying department or curriculum. Finally, at the individual student or faculty stuff member level, this study enables them to follow the algorithm and apply to understand their student’s latent abilities.
Notwithstanding the contribution above, there are a couple limitations in this study. First, due to the fact that one-random sampling method was used instead of the multiple-one-random sampling method for selecting sample schools, it may indirectly neglect some schools from the sample group. Second, the estimated parameters were also calculated based on one sample group, which may differ from the parameters estimated from whole data set.
The findings of this paper provide several directions and opportunities for future research including: first, researchers may consider improving the recent model by replacing 3PL model with 4PL model or polytomous model; and second, the need to explore how the schools in the highest latent class treat their students.
Acknowledgement
The researchers would like to thank The 90th ANNIVERSARY OF CHULALONGKORN UNIVERSITY FUND
(Ratchadaphiseksomphot Endowment Fund) for funding this research. References
Bryk, A. S., & Raudenbush, S. W. (1988). Toward a more appropriate conceptualization of research on school effects: A three-level hierarchical linear model. American Journal of Education, 97, 65–108.
Cho, S.J. (2007). A Multilevel mixture IRT model for DIF analysis. Doctoral dissertation. Graduate Faculty. The University of Geogia. Cho, S. J., & Cohen, A. S. (2010). A multilevel mixture IRT model with applications to DIF. Journal of Educational and Behavioral Statistics,
35, p. 336-370.
Fox, J.-P., & Glas, C. A. W. (2001). Bayesian estimation of a multilevel IRT model using Gibbs sampling. Psychometrika, 66, 269-286. Fox, J.-P. (2005). Multilevel IRT using dichotomous and polytomous response data. British Journal of Mathematical and Statistical Psychology,
58, 145–172.
Goldstein, H. (1987). Multilevel models in education and social research. London: Charles Griffin and Co.
Hernandez, A., Drasgow, F., & Gonzalez-Roma, V. (2004). Investigating the functioning of a middle category by means of a mixed-measurement model. Journal of Applied Psychology, 89, 687-699.
Mislevy, R., & Huang, C. W. (2007). Measurement models as narrative structures. In M. Von Davier & C. H. Carstensen (Eds.), Multivariate and mixture distribution Rasch models: Extensions and applications. New York: Springer.
Rabe-Hesketh, S., Skrondal, A., and Pickles, A. (2004). Generalized multilevel structuralequation modelling. Psychometrika, 69, 183-206.
Rost, J. (1990). Rasch model in latent classes: An integration of two approaches to item analysis. Applied Psychological Measurement, 14, 271-282.
Rost, J. (1991). A logistic mixture distribution model for polychotomous item responses. BritishJournal of Mathematical and Statistical Psychology, 44, 75-92.
Rost, J., Carstensen, C., & von Davier, M. (1997). Applying the mixed Rasch model to personality questionnaires. In J. Rost & R. Langeheine (Eds.), Applications of latent trait and latent class models in the social sciences. Munster, Germany: Waxman.
Sirichai Kanjanawasee. (2011). Multi-level Analysis. 5th ed. Bangkok: Chulalongkorn University Publishing. (In Thai)
Tay, L., Diener, E., Drasgow, F., & Vermunt, J. K. (2011). Multilevel mixed-measurement IRT analysis : An explication and application to self-reported emotion across the world. Organizational Research Methods,14, 177-207.
Vermunt, J. K. (2003). Multilevel latent class models. Sociological Methodology, 33,213-239.
Vermunt, J. K. (2008a). Latent class and finite mixture models for multilevel data sets. Statistical Methods in Medical Research, 17, 33–51. Vermunt, J. K. (2008b). Multilevel latent variable modelling: an application in education testing. Austrian Journal of Statistics, 37, 285–299.