Balanced Scorecard Utilization Perceived Effect on Customer
Satisfaction
Ijeoma Ogochukwu Anaso1; Dahiru Hussaini.1; and Ahmed Modu Kumshe.1*
Department of Accounting, Faculty of Management Sciences, University of Maiduguri, Borno State, Nigeria * [email protected]
Abstract
The study reviewed management perception of the effect of Balanced scorecard utilisation on customer satisfaction. Customer satisfaction is a lead cause of financial performance and low customer satisfaction will ultimately reflect in the financials of any organisation. The study used the survey technique to elicit information on the effect of Balanced scorecard on customer satisfaction. Ten companies in the consumer goods industry were sampled and eight respondents were contacted per company. It was found that the balanced scorecard had a significant effect on customer satisfaction at a 5% level of significance. The study therefore recommended that management tie the metrics that affect customer satisfaction closely to the organisational objectives to ensure that these are measured and where there is dissatisfaction in the products/services, remedial actions are easier to identify and carried out to restore organisations to a favourable light with customers.
Keywords: Balanced Scorecard Utilisation, Customer Satisfaction, Financial Performance, Consumer Goods
Industry
Introduction
The balanced scorecard, developed by Kaplan and Norton in 1992 is a performance measurement framework that adds strategic non-financial performance measures to the traditional financial metrics to give managers and executives a clearer and holistic view of organisational performance. The scorecard has evolved from its earlier use as a simple performance measurement framework into a full strategic planning and management system. The scorecard was devised because of the need to incorporate non-financial variables into the measures of performance of organisations, it provides a framework that facilitates performance measurement and helps planners identify what should be done, measured and executed.
Performance measurement is a critical factor in the survival of any organisation as it is one of the ways in which the desired strategic vision and mission of any organisation can be achieved. Developing a world class performance measurement system hinges on clear understanding of firms’ competitive strategies, operational goals and definitive statement of the employees’ competencies and behaviors required to achieve the firms’ objective as well as developing well-structured internal business processes.
Nigerian manufacturing companies that are listed on the Nigerian Stock Exchange and operating in various sectors of the economy contribute to economic growth and development. They need to measure and monitor their performances from time to time, most especially because they use scarce resources and need to make economic decisions on how best to use these resources. The balanced scorecard has four perspectives: financial, customer, internal business and learning and growth perspectives.
In the past, performance measurement revolved around the use of accounting or financial data to measure the performance of firms. The use of financial data resulted in misleading information because financial data were subject to manipulation by the preparers. Financial data alone were criticised as being narrow and lacking in qualitative characteristic because they are compiled from only the financial perspective and rely on historical events. Therefore, financial data alone are said to possess very limited predictive ability and are sometime observed to be inadequate to position organisations to perform effectively and efficiently and enable them to respond to customers and environmental complexities in the information age (Kaplan & Norton, 1992). The inclusion of only those items that could be expressed in monetary terms motivated managers to focus excessively on cost reduction and ignore other important variables which were necessary to succeed in the global competitive environment. Consequently, performance evaluation based on financial data alone can cause managers to focus on short term objectives at the detriment of long term objectives and at the detriment of other
stakeholders as well as the organisations they represent. These criticisms led to the emergence of a robust measure of organisational performance which captures both financial and non-financial indices.
The Balanced Scorecard (BSC) has become popular in Europe and America but is still at the rudimentary level in Sub-Saharan Africa. Many studies have focused on the implementation of BSC in both private and public organisations in advanced economies with little reference made to the translation dynamics of BSC in developing economies like Nigeria as observed by Etim and Agara (2011). Studies by Etim and Agara (2011) and Atarere and Oroka (2012) revealed that Nigerian manufacturing companies are faced with challenging issues such as revenue growth, cost reduction techniques, customer satisfaction strategies, production of quality products or services to the customers, improving employees’ performance, and developing employees to meet the quick changing economic environment. These challenges arise mostly because many Nigerian companies have not incorporated non-financial measures in their performance evaluation. There are fewer studies documented on the adoption of BSC in developing economies like Nigeria (compared to the West). This dearth in studies is despite the success recorded by companies that have implemented BSC. Therefore, it is on this premise that this study was embarked upon, specifically to examine the perceived effect of utilising balanced scorecard on customer satisfaction.
The Balanced Scorecard
According to Atarere and Oroka (2012), Parker (1979) was the first to conceive the idea of a balanced view between financial and non-financial measures in judging performance of organisations. Similarly, Parker (1979) did not do much to explain how his view could be translated into concrete useable tools for management. It was thus Kaplan and Norton who set in motion the Balance Scorecard (BSC) approach which successfully enunciated Parker’s point. The BSC was devised by Kaplan and Norton in 1992. Between 1993 and 2001 the BSC underwent several changes in strategies linked to performance measures. According to Kaplan and Norton (1992), an effective strategic learning process requires a shared strategic framework that communicates the strategy and allows all participants to see how their individual activities contribute to achieving the overall strategy.
The BSC recognises that management must consider both financial performance measures (which tend to measure the results of actions already taken—lag indicators) and operational performance measures (which tend to drive future performance, also known as lead indicators) when judging the performance of a company and its subunits. These measures should be linked with the company’s goals and its strategy for their achievement. The BSC represents a major shift in corporate performance measurement. Rather than treating financial indicators as the sole measure of performance, companies recognise that they are only one measure among a broader set. Keeping score of operating measures and traditional financial measures gives management a “balanced” view of the organisation.
According to Chaudron (2003), the BSC is a way of measuring organisational, business unit or departmental success, balancing long-term and short-term actions, balancing the following different measures of success: Financial, Customer, Internal Operations, Human Resource Systems and Development (learning and growth), tying the firm’s strategy to measures of action. Much of the success of the scorecard depends on how the measures are agreed, the way they are implemented and how they are acted upon (Bourne 2002).
Benefits of Balanced Scorecard Utilisation
There are many benefits derivable from the adoption of balanced scorecard as a performance measurement technique. Etim and Agara (2011), states that BSC is capable of enforcing the achievement of corporate strategies. There are causal relationships between the performance of the organisation and the effective management of the dynamics of the four perspectives (Kaplan & Norton, 2006). The implementation of BSC would result in improved operational performance, increased profit, improved communication among staff, improved long and short term planning process, and better management of intangibles including capabilities and human capital. Also, adoption of BSC influences the allocation of resources, the reward for performance, support innovation and positions organisations to function effectively and efficiently in a competitive environment. BSC is said also to help managers to understand the numerous interrelationships and causal effects of internal and external factors that affect the firm to achieve optimal level of operational efficiency (Huang, 2009).
The model is also capable of linking the measures to the reward system of organisations, thereby assisting in the promotion of hardwork among staff (Kaplan & Norton, 1996a). Further, Behery (2005), Woodley (2006) and
Wongkaew (2007) in their individual case studies on the translation to BSC in organisations observe that, if well implemented, the scorecard is a potent model capable of enhancing the performance of the company and also has the capabilities of adaptation in different cultural settings.
Wood and Sangster (2002) identified the following benefits for organisations that adopted the BSC:
iv. The BSC provides management with a tool to focus strategy on and move the organisation in a co-ordinated and transparent manner towards the achievement of its objectives;
v. It facilitates an understanding of how organisational participants can contribute to the strategic success of the organisation by making it clear what items are important indicators of success; and
vi. It guides the transformation of the organisation’s vision and strategy into a set of performance measures. According to Prosatis (2010) the BSC recognized some of the weaknesses and vagueness of previous management approaches, and provides a clear prescription as to what companies should measure to 'balance' the financial perspective. The BSC concept provides strategic feedback and learning, a cross organisational team, more open channels of communications, enthusiastic people, and initiatives are continually measured and evaluated against industry standards. The scorecard is known to help reduce the vast amount of information the company IT systems process into essentials, unique competitive advantage, reduced time-frames, improved decisions and better solutions and improved processes. Many organisations have difficulty establishing mechanisms that translate strategic vision into concrete goals and actions. This means businesses, public service projects, or any prolonged group effort can benefit from the power of the BSC.
Customer Satisfaction
A customer of an organisation is a vital link between its production process and profitability. According to Kairu, Wafula, Okaka, Odera, and Akerele (2013), customer satisfaction perspective captures the ability of the organisation to provide quality goods and/or services, the effectiveness of their delivery, and overall customer service and satisfaction. These will result from price, quality, availability, selection, functionality, service, partnerships and brand value propositions, which will lead to increased customer acquisition and retention (Gekonge, 2005). The BSC demands that managers translate their general mission statement on customer service into specific measures that reflect the factors that really matter to customers (Kaplan & Norton, 1992). Customers’ concerns tend to fall into four categories: time, quality, performance and service cost. Satisfied customers buy a product again, talk favorably to others about the product, pay less attention to competing brands and advertising, and buy other products from the company (Kotler & Armstrong, 2004). Recent management philosophy has shown an increasing realisation of the importance of customer focus and customer satisfaction in any business (Chabrow, 2002; Holloway, 2002; and Needleman, 2003).
According to Horngren, Harrison, and Oliver (2012), the customer perspective of the BSC helps managers evaluate the question, “How do customers see us?” or from Al-Najjar and Kalaf’s (2012) perspective, "To achieve our vision, how should we appear to our customers?" Hongren et al. (2012) further reiterated that customer satisfaction is a top priority for long-term company success. If customers are not satisfied, they will not make repeat purchases nor would they tell others about the company products and/or services. Therefore, customer satisfaction is critical to achieving the company’s financial goals outlined in the financial perspective of the BSC. Customers are typically concerned with four specific product or service attributes: product’s price; product’s quality; service quality at the time of sale; and product’s delivery time (the shorter the better).
Since each of these attributes are critical to making the customer happy, most companies have specific objectives for each of these attributes. Businesses commonly use customer perspective key performance indicators (KPIs), such as customer satisfaction ratings, to assess how they are performing on these attributes. Because customer satisfaction is crucial, customer satisfaction ratings often determine the extent to which bonuses are granted to staff. For example, if customer satisfaction ratings are greater than average, the KPI will be positive. If customer satisfaction ratings are lower than average, management will want to devise measures to improve customer satisfaction. Other typical customer perspective KPIs includes percentage of market share, increase in the number of customers, number of repeat customers, and rate of on-time deliveries. Al-Najjar and Kalaf (2012) identifies other typical measures under this perspective: customer complaints, customer lost/won, sales from new product, and so on.
According to the Balanced Scorecard Institute, recent management philosophy has shown an increasing realisation of the importance of customer focus and customer satisfaction in any business. Poor performance on this perspective is a leading indicator of future decline, even though current financial picture may look good. In developing metrics for customer satisfaction, customers should be analysed in terms of kinds of customers and the kinds of processes for which companies are providing a product or service to those customer groups.
According to Atarere and Oroka (2012), this perspective is focused primarily on the customer and market segment in which the business will compete. It further underpins the revenue element for the financial perspective objective as this will be realised from patronage of customers. Therefore, the achievement of the customer objective should ensure that the target revenue will be generated. The core objectives of this perspective as identified by Atarere and Oroka (2012) are:
i. increasing the market share - which may be through advertisement, sales, promotions, low-price of products and services.
ii. increasing customer retention - Strategic measures that can be taken include; improving customer-organisational relationship, responding to customers’ complaints/suggestions, offering after-sale services to customers, etc.
iii. increasing customer acquisition - the focus here is to increase total sales to new customers. Strategic measures to be taken include giving out free samples to new market segments, penetration of new market segments, and introduction of new products and/or improving on existing old products.
iv. increasing customer satisfaction - The focus here is on customer-survey satisfaction ratings. Strategic measures that can be taken include administering of questionnaires to customers, monitoring number of repeated patronage by old customers, etc.
Wood and Sangster (2002), suggest organisations identify the customer and market segments in which they operate. Measurements should be made of factors such as customer satisfaction, retention, acquisition, customer profitability and market share.
In assessing the performance of organisations using the balanced scorecard, Kaplan and Norton (2001) and Horngren and Foster (2003) were unified in their opinion that there must to be congruency in the performance of the key functions such as the sales and customer service. Also, it is noted that the use of BSC had a positive impact on service delivery and strategic competitiveness as reflected in the sales growth rate. In addition, Kairu
et al. (2013) revealed that the BSC emphasises performance measurement and management in four key
business areas. These four perspectives provide a comprehensive evaluation of the organisation than the traditional emphasis on tangible and financial assets of the organisation. They argue that it is because learning improves the internal business processes; this improvement leads to improved customer satisfaction; which in turn leads to improved financial results.
The Stakeholder theory by Freeman (1984) posited that individuals and groups that have an interest in the well- being of a b u s i n e s s e n t i t y and/or are affected by the goals, operations or activities of the organisation or the behaviour of its members have a ‘stake’ in what the organisation does. Thus, stakeholders in relation to this study are employees and management who are internal to the operations of the organisation, while customers, suppliers, competitors are external to the operations of the organisation. Freeman (1984) observed that there are obvious close links between s t a k e h o l d e r s and strategies can to be put in place to attain organisations’ goal through which the performances of employees are measured.
Methodology
The Study Area
This study was carried out in Nigeria. Nigeria is in Western Africa, sharing geographical border with Chad and Cameroun in the East, Niger Republic in the North, Republic of Benin in the West and the Atlantic Ocean in the South. It operates a Federal system of government: 36 states divided into six (6) geopolitical zones with a Federal Capital Territory (FCT). Nigeria’s population is over 160 million and it is one of the fastest growing
economy in Africa. Nigeria has about 200 listed companies on the stock exchange as at December 2014 divided among different sectors of the economy. The study is focused specifically on consumer goods sector companies that are listed on Nigerian Stock Exchange (NSE) of which there were 29 as at December 2014. The listed companies operate in the market and contribute to economic growth and development, employment generation, direct creation of wealth by contribution to the Gross National Product (GNP), provision of technical innovation, provision of competition and output for other businesses (NSE, 2014). The manufacturing companies are not left out as they play a vital role in provision of employment, consumable products and a source of revenue to the government through payment of taxes.
For this study, the data were obtained from primary sources. The primary data were collected through questionnaire administered among the respondents of the selected companies. The justification for choosing primary source is to be able to obtain first-hand information directly from the target respondents of the selected companies as used in Al-Matarneh (2011).
The population of the study is made up of 29 manufacturing companies registered in the consumer goods sector of the NSE as at December 2014. The choice of the population is justified by the fact that all the companies in the sector have similar characteristics. The companies in this sector convert raw materials into finished produce and have similar organisational structures. The target respondents are the managers/directors of the various units or departments of the selected companies. The choice of these respondents is to ensure reliability and accuracy of the information obtained due to the familiarity of these staff to the operation of the selected organizations. The sample size for the study is 10 selected from 29 companies operating in the consumer goods sector using simple random sampling. The whole sector was considered too large for the study and it was done to give equal chance of appearance to all the companies and to eliminate bias in the selection process as observed in relevant studies. The 10 selected companies had 150 manager and heads of units. In selecting the respondents in the selected companies for questionnaire administration, the study considered and purposively selected 80 respondents comprising of managers and directors that are bestowed with the responsibility of performance measurement within their respective units or departments. The selection is because the companies have the same structural setting. Eight (8) respondents were selected purposively in each of the selected companies; these include one (1) manager/director of finance/accounts, two (2) managers/directors of sales/marketing, one (1) manager/director of planning, two (2) managers/directors of human resource/personnel departments and two (2) other managers/directors. This selection was made because of similarity in the structural settings of the target organisations. The choice of these respondents is justified to give each company equal opportunity of representation and to avoid bias.
Method of data collection
The data for the study were collected through questionnaire. The questionnaires were adopted from Alao (2013) and Al-Matarneh (2011) but were modified to suit the objective of the study. Cronbach’s alpha was employed to ensure the reliability of the instrument, the significant value of the reliability statistics was 0.996. Content validity was conducted by obtaining the opinion of a performance measurement expert on the research instrument. The questionnaires were administered to the managers/directors of the selected departments or units of the selected companies. This was to enable collection of authentic information from the target population. A five point Likert scale was used in the questionnaire. The questionnaires were delivered physically at the offices of the various organisations and retrieved later.
Analysis of Data
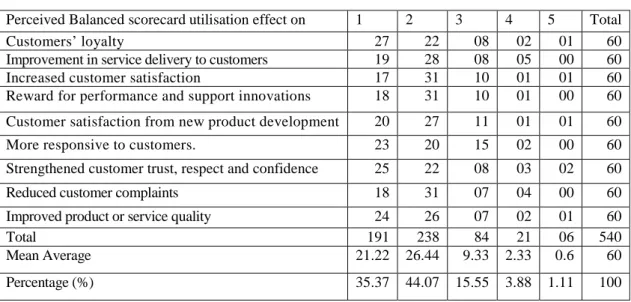
A total of 80 questionnaires were administered out of which 60 (75%) were completed and returned. Simple percentages were used for the description of the data and one way Analysis of Variance (ANOVA) was used to test the formulated hypotheses. Table 1 presents respondents’ perception of the utilisation of balanced scorecard on customers’ satisfaction measures. Twenty-seven (27) respondents representing forty-five percent (45%) perceived very strongly the BSC utilisation effect on customer loyalty; twenty-two (22) respondents representing thirty-seven percent (37%) perceive the effect of BSC on customer loyalty; eight (8) respondents representing thirteen percent (13%) were undecided on the effect of BSC utilisation of customer loyalty; two (2) respondents representing three percent (3%) did not perceive the effect of BSC on customer loyalty; and one respondent representing two percent strongly disagreed that BSC utilisation had any effect on customer loyalty.
Nineteen (19) respondents representing thirty-two percent (32%) perceived very strongly the BSC utilisation effect on improvement in service delivery customers; twenty-eight (28) respondents representing forty-seven percent (47%) perceive the effect of BSC on improvement in service delivery customers; eight (8) respondents representing thirteen percent (13%) were undecided on the effect of BSC utilisation on improvement in service delivery customers; five respondents representing eight percent (8%) did not perceive the effect of BSC on improvement in service delivery customers; and no respondent selected the strongly disagreed option.
Seventeen (17) respondents representing twenty-eight percent (28%) perceived very strongly the BSC utilisation effect on increased customer satisfaction; thirty-one (31) respondents representing fifty-two percent (52%) perceive the effect of BSC on increased customer satisfaction; ten (10) respondents representing seventeen percent (17%) were undecided on the effect of BSC utilisation on increased customer satisfaction; one (1) respondents representing two percent (2%) did not perceive the effect of BSC on increased customer satisfaction; and one (1) respondent representing two percent (2%) strongly disagreed that BSC utilisation had any effect on increased customer satisfaction.
Eighteen (18) respondents representing thirty percent (30%) perceived very strongly the BSC utilisation effect on innovation and reward; thirty-one (31) respondents representing fifty-two percent (52%) perceive the effect of BSC on innovation and reward; ten (10) respondents, representing seventeen percent (17%) were undecided on the effect of BSC utilisation on innovation and reward; one (1) respondents representing two percent (2%) did not perceive the effect of BSC on innovation and reward; and none of the respondents selected the strongly disagree option.
Twenty (20) respondents representing thirty-three percent (33%) perceived very strongly the BSC utilisation effect on customer satisfaction with new product development; twenty-seven (27) respondents representing forty-five percent (45%) perceive the effect of BSC on customer satisfaction with new product development; eleven (11) respondents representing eighteen percent (18%) were undecided on the effect of BSC utilisation on customer satisfaction with new product development; one (1) respondents representing two percent (2%) did not perceive the effect of BSC on customer satisfaction with new product development; and one (1) respondent representing two percent (2%) strongly disagreed that BSC utilisation had any effect on customer satisfaction with new product development.
Twenty-three (23) respondents representing thirty-eight percent (38%) perceived very strongly the BSC utilisation made their organisation more responsive to customers; twenty (20) respondents representing thirty-three (33%) percent perceive the BSC made their organisation more responsive to customers; fifteen (15) respondents, representing twenty-five percent (25%) were undecided on the effect of BSC utilisation made on their organisations’ level of responsiveness to customers; two (2) respondents representing three percent (3%) did not perceive the effect of BSC on their responsiveness to customers; and none respondent selected the strongly disagree option.
Twenty-five (25) respondents representing forty-two percent (42%) perceived very strongly the BSC utilisation effect on customers’ strengthened trust, respect and confidence in their organisations’ products; twenty-two (22) respondents representing thirty-seven percent (37%) perceive the effect of BSC on customers’ strengthened trust, respect and confidence in their organisations’ products; eight (8) respondents, representing thirteen percent (13%) were undecided on the effect of BSC utilisation on customers’ strengthened trust, respect and confidence in their organisations’ products; three (3) respondents representing five percent (5%) did not perceive the effect of BSC on customers’ strengthened trust, respect and confidence in their organisations’ products; and two (2) respondent representing three percent (3%) strongly disagreed that BSC utilisation had any effect on customers’ strengthened trust, respect and confidence in their organisations’ products.
Eighteen (18) respondents representing thirty percent (30%) perceived very strongly the BSC utilisation effect on reduced customer complaints; thirty-one (31) respondents representing fifty-two percent (52%) perceive the effect of BSC on reduced customer complaints; seven (7) respondents representing twelve percent were undecided on the effect of BSC utilisation on reduced customer complaints; four (4) respondents representing seven percent (7%) did not perceive the effect of BSC on reduced customer complaints; and none respondent selected the strongly disagree option.
Twenty-four (24) respondents representing forty percent (40%) perceived very strongly the BSC utilisation effect on improved product/service quality; twenty-six (26) respondents representing forty-three percent (43%) perceive the effect of BSC on improved product/service quality; seven (7) respondents, representing twelve
percent (12%) were undecided on the effect of BSC utilisation on improved product/service quality; two (2) respondents representing three percent (3%) did not perceive the effect of BSC on improved product/service quality; and one respondent representing two percent (2%) strongly disagreed that BSC utilisation had any effect on improved product/service quality.
The respondents largely agreed on the effect of the BSC on various dimensions of customer satisfaction (with a mean of 79.44%). The above description indicated that the managers perceived that the utilisation of Balanced Scorecard had some effect on customer satisfaction.
Table 1: Perceived Relationship of BSC to Customer Satisfaction Measure
Perceived Balanced scorecard utilisation effect on 1 2 3 4 5 Total
Customers’ loyalty 27 22 08 02 01 60
Improvement in service delivery to customers 19 28 08 05 00 60
Increased customer satisfaction 17 31 10 01 01 60
Reward for performance and support innovations 18 31 10 01 00 60 Customer satisfaction from new product development 20 27 11 01 01 60
More responsive to customers. 23 20 15 02 00 60
Strengthened customer trust, respect and confidence 25 22 08 03 02 60
Reduced customer complaints 18 31 07 04 00 60
Improved product or service quality 24 26 07 02 01 60
Total 191 238 84 21 06 540
Mean Average 21.22 26.44 9.33 2.33 0.6 60
Percentage (%) 35.37 44.07 15.55 3.88 1.11 100
Source: Field survey, 2015
Legend: 1 – Strongly agree; 2 – Agree; 3 – neither agree nor disagree; 4 – disagree; 5 – Strongly disagree The study tested the hypothesis: balanced scorecard utilisation has no significant effect on customer satisfaction in Nigerian manufacturing companies. Table 2 is the data source for the ANOVA found in Table 3.
Table 2: Summary of Customer Satisfaction Measures
Groups Count Sum Average Variance
Strongly Agree 9 191 21.22 12.94444 Agree 9 238 26.44 18.27778 Neither 9 84 9.33 6.5 Disagree 9 21 2.33 2 Strongly Disagree 9 6 0.67 0.5 Source: SPSS version 16.0
One way ANOVA was used to examine the effect of perceived BSC utilisation on customers’ satisfaction by assigning Strongly Agree, Agree, Neutral, Disagree and Strongly Disagree on customer satisfaction metrics. The ANOVA summary in Table 3 show the result of the variation of response among the various respondents. The computed value of the F statistics is 146.19 whereas the critical table value at F4, 40 is 2.61. The p-value of 0.0000 indicate the perceived Balanced scorecard utilisation effect on customer satisfaction is statistically significant among Nigerian Manufacturing companies at p<0.05. Since the computed value is greater than the critical table value, the null hypothesis (balanced scorecard utilisation has no significant effect on customer satisfaction in Nigerian manufacturing companies) is not accepted, and the study therefore concludes that the perceived balanced scorecard utilisation has significant effect on customer satisfaction in Nigerian companies.
Table 3 ANOVA Table
Source of
variation SS df MS F P-value F crit
Between Groups 4704.222 4 1176.056 146.1948 0.0000 2.605975 Within Groups 321.7778 40 8.044444 Total 5026 44 Source: SPSS version 16.0 Discussion
The result revealed that there is significant effect of perceived balanced scorecard utilisation on customer satisfaction measures in Nigerian manufacturing companies at p<0.05. This is in line with Kaplan and Norton (2001) and Horngren and Foster (2003) assertions that there is congruency in the performance of the key functions such as the sales and customer services. The result is logical, since for consumer goods organizations to achieve decent financial performance requires the sale of the products of the organizations. It is in line with Buzzel, Gale and Saltan (1974) and Anderson, Fornell and Lehmann (1994) studies which provide empirical evidence to support the economic benefits of improving customer satisfaction.
Conclusion
Balance scorecards have come to stay. However, to get the best out of them, managements need to identify clearly the tasks in the four perspectives that will facilitate the achievement of organizational goals. Customer satisfaction is a key element to the achievement of organizational objective. Organizations need to find out the factors that contribute most significantly to the satisfaction of their customers and ensure that those factors are not ignored. This is because customer satisfaction is a leading factor. Even though an organization may be experiencing financial success, present customer dissatisfaction will lead to a reduction in the financial performance in future periods for the organization.
References
Alao, E. (2013). Strategic Decision Making, Balanced Scorecard Profitability: Issues and Challenges.
International Journal of Accounting Research, 1(1), 20-31.
Al-Matarneh, G. F. (2011). Performance Evaluation and Adoption of Balanced Scorecard (BSC) in Jordanian Industrial Companies, European Journal of Economics, Finance and Administrative Science, 35, 37-46. Al-Najjar, S. M., & Kalaf, K. H. (2012). Designing a Balanced Scorecard to Measure a Bank’s Performance: A Case Study. International Journal of Business Administration, (3)4, 44-50.
Anderson, E. W., Fornell, C., & Lehman, D. R. (1994). Customer Satisfaction, Market Share, and Profitability: Findings from Sweden. Journal of Marketing, 58(3), 53-66
Atarere, O. I., & Oroka, O. V. (2012). Roles of Balanced Scorecard in Improving the Performance of Microfinance Banks in Nigerian Economy. International Journal of Research and Development, 280-287. Behery, M. H. (2005). Change and Culture: The Balanced Scorecard and The Egyptian Fertilizer
Manufacturing Sector - A Thesis Submitted in Partial Fulfilment Of The Requirements For A Doctoral Degree
At The University Of Glasgow, University of Glasgow, November 2005.
Bourne, M. (2002). The Emperor’s New Scorecard Financial World, August 20, 48-51
Buzzell, R. D., Gale, B. T., Sultan, R. G. M. (1974). Market Share – A Key to Profitability. Harvard Business
Review. 1-9
Chaudron, D. (2003). The Balanced Scorecard & Performance Improvement: Retrieved from http://www.organisedchange.com/balancedscorecard.htm
Etim, R. S., & Agara, I. G. (2011). The Balanced Scorecard: The New Performance Management Paradigm for Nigerian Firms. International Journal of Economic Development Research and Investment, 2(3), 66-69.
Freeman, R. E. (1984). Strategic Management: A Stakeholder approach. Boston, Pitman. Gekonge, C. O. (2005). “What a System!” The Professional Journal of KASNEB, 4, Holloway, A. (2002). It’s all about Relationships. Canadian Business, October 28, 80
Horngren, C. T., & Foster, G. (2003). Strategy, Balanced Scorecard and Strategic Profitability Analysis, Prentice Hall, Business Publishing, USA.
Horngren, C. T., Harrison, W. T., & Oliver, M. S. (2012). Accounting, 9th Edition, Pearson Prentice Hall, USA. Huang, H. (2009). Designing a Knowledge-based System for Strategic Planning: A Balanced Scorecard Perspective [Online], Expert Systems with Application 36, 209-218. Available at www.sciencedirect.com Hussaini, D. (2016). Assessment of the Utilisation of Balanced Scorecard on Measurement in Selected Manufacturing Companies in Nigeria. M.Sc. thesis, Department of Accounting, University of Maiduguri
Kairu, E. W., Wafula, M. O., Okaka, O., Odera, O., & Akerele, E. K.(2013). Effects of Balanced Scorecard on Performance of Firms in the Service Sector. European Journal of Business and Management, 5 (9), 81-83. Kaplan, R. S., & Norton, D. P. (1992). Balanced Scorecard- Measures that Drive Performance, Harvard
Business Review, January-February 1992, 70-79
Kaplan, R. S., & Norton, D. P. (1996). Balanced Scorecard. Boston: Harvard Business School Press. Kaplan, R., & Norton, D. P. (2001). The Strategy Focused Organisation. New York Harvard Business School Press.
Kaplan, R. S., & Norton, D. P. (2006). Alignment: Using the Balanced Scorecard to Create Corporate
Synergies. Boston, Mass: Harvard Business School Press.
Kaplan, R. S. (2010). Conceptual Foundation of the Balanced Scorecard, Harvard Business School, Working Paper, 10-74.
Kotler, P., & Armstrong, G. (2004). Principles of Marketing, (10th ed.), Prentice - Hall of India, New Delhi. Needleman, T. (2003). Customer Satisfaction is Supreme. Internet World, May 9, 6.
Nigerian Stock Exchange (2014). Listed companies. Lagos: Nigerian Stock Exchange. Available at http://www.nse.com.ng/listings-site/litedsecuritis/company-details
Parker, L. D. (1979). Divisional Performance Measurement: Beyond an Exclusive Profit Test, Accounting and
Business Research, Autumn, 309-319.
Prosatis, A. S. (2010). The Balanced Scorecard, available at http://thebalancedscorecard.com/partners.htm Wood, F., & Sangster, A. (2002). Business Accounting, (9th ed.), Pearson Education ltd, USA.
Woodley, P. M. (2006). Culture Management Through the Balanced Scorecard: A Case Study of Defence