seq: transcript-level estimates
improve gene-level inferences
The Harvard community has made this
article openly available.
Please share
how
this access benefits you. Your story matters
Citation
Soneson, Charlotte, Michael I. Love, and Mark D. Robinson. 2015.
“Differential analyses for RNA-seq: transcript-level estimates
improve gene-level inferences.” F1000Research 4 (1): 1521.
doi:10.12688/f1000research.7563.1. http://dx.doi.org/10.12688/
f1000research.7563.1.
Published Version
doi:10.12688/f1000research.7563.1
Citable link
http://nrs.harvard.edu/urn-3:HUL.InstRepos:25658489
Terms of Use
This article was downloaded from Harvard University’s DASH
repository, and is made available under the terms and conditions
applicable to Other Posted Material, as set forth at http://
nrs.harvard.edu/urn-3:HUL.InstRepos:dash.current.terms-of-use#LAA
F1000Research
Open Peer Review
, University of California, Stephen N. Floor
Berkeley USA
, Stony Brook University USA Rob Patro
Discuss this article
(0)
Comments
2 1 METHOD ARTICLE
Differential analyses for RNA-seq: transcript-level estimates
improve gene-level inferences [version 1; referees: 2 approved]
Charlotte Soneson
,
Michael I. Love
, Mark D. Robinson
1,2
Institute for Molecular Life Sciences, University of Zurich, Zurich, 8057, Switzerland SIB Swiss Institute of Bioinformatics, University of Zurich, Zurich, 8057, Switzerland
Department of Biostatistics and Computational Biology, Dana-Farber Cancer Institute, Boston, MA, 02210, USA Department of Biostatistics, Harvard TH Chan School of Public Health, Boston, MA, 02115, USA
Abstract
High-throughput sequencing of cDNA (RNA-seq) is used extensively to characterize the transcriptome of cells. Many transcriptomic studies aim at comparing either abundance levels or the transcriptome composition between given conditions, and as a first step, the sequencing reads must be used as the basis for abundance quantification of transcriptomic features of interest, such as genes or transcripts. Several different quantification approaches have been proposed, ranging from simple counting of reads that overlap given genomic regions to more complex estimation of underlying transcript abundances. In this paper, we show that gene-level abundance estimates and statistical inference offer advantages over transcript-level analyses, in terms of performance and interpretability. We also illustrate that while the presence of differential isoform usage can lead to inflated false discovery rates in differential expression analyses on simple count matrices and transcript-level abundance estimates improve the performance in simulated data, the difference is relatively minor in several real data sets. Finally, we provide an R package (tximport) to help users integrate transcript-level abundance estimates from common quantification pipelines into count-based statistical inference engines.
This article is included in the
RPackage
channel.
1,2
3,4
1,2
1 2 3 4 Referee Status: Invited Referees version 1 published 30 Dec 2015 1 2 report report 30 Dec 2015, :1521 (doi: )First published: 4 10.12688/f1000research.7563.1
30 Dec 2015, :1521 (doi: )
Latest published: 4 10.12688/f1000research.7563.1
F1000Research
Charlotte Soneson ( ), Michael I. Love ( ), Mark D. Robinson (
Corresponding authors: [email protected] [email protected]
)
Soneson C, Love MI and Robinson MD.
How to cite this article: Differential analyses for RNA-seq: transcript-level estimates improve
2015, :1521 (doi: )
gene-level inferences [version 1; referees: 2 approved]F1000Research 4 10.12688/f1000research.7563.1
© 2015 Soneson C . This is an open access article distributed under the terms of the ,
Copyright: et al Creative Commons Attribution Licence
which permits unrestricted use, distribution, and reproduction in any medium, provided the original work is properly cited. Data associated with the article are available under the terms of the Creative Commons Zero "No rights reserved" data waiver (CC0 1.0 Public domain dedication).
MDR and CS acknowledge support from the "RNA & Disease" National Center of Competence in Research, an SNSF project Grant information:
grant (143883) and from the European Commission through the 7th Framework Collaborative Project RADIANT (Grant Agreement Number: 305626). MIL was supported by NIH grant 5T32CA009337- 35.
The funders had no role in study design, data collection and analysis, decision to publish, or preparation of the manuscript.
Competing interests:No competing interests were disclosed.
30 Dec 2015, :1521 (doi: )
Introduction
Quantification and comparison of isoform- or gene-level expression based on high throughput sequencing reads from cDNA (RNA-seq) is arguably among the most common tasks in modern com-putational molecular biology. Currently, one of the most common approaches is to define a set of non-overlapping targets (typically, genes) and use the number of reads overlapping a target as a meas-ure of its abundance, or expression level. Several software pack-ages have been developed for performing such “simple” counting (e.g., featureCounts1 and HTSeq-count2). More recently, the field has seen a surge in methods aimed at quantifying the abundances of individual transcripts (e.g., Cufflinks3, RSEM4, BitSeq5, kallisto6 and Salmon7). These methods provide higher resolution than sim-ple counting, and by circumventing the computationally costly read alignment step, some are considerably faster. However, iso-form quantification is more complex than the simple counting, due to the high degree of overlap among transcripts. Currently, there is no consensus regarding the optimal resolution or method for quantification and downstream analysis of transcriptomic output.
Another point of debate is the unit in which abundance is given. The traditional R/FPKM8,9 (reads/fragments per kilobase per million reads) has been largely superseded by the TPM10 (transcripts per million), since the latter is more consistent across libraries. Regard-less, both of these units attempt to “correct for” sequencing depth and feature length and thus do not reflect the influence of these on quantification uncertainty. In order to account for these aspects, most statistical tools for analysis of RNA-seq data operate instead on the count scale. While these tools were designed to be applied to simple read counts, the degree to which their performance is affected by using fractional estimated counts resulting from portioning reads aligning to multiple transcripts is still an open question. The fact that the most common sequencing protocols provide reads that are much shorter than the average transcript length implies that the observed read counts depend on the transcript’s length as well as abundance; thus, simple counts are arguably less accurate measures than TPMs of the true abundance of RNA molecules from given genes. The use of gene counts as input to statistical tools typically assumes that the length of the expressed part of a gene does not change across samples and thus length can therefore be ignored for differential analysis.
In the analysis of transcriptomic data, as for any other application, it is of utmost importance that the question of interest is precisely defined before a computational approach is selected. Often, the interest lies in comparing the transcriptional output between dif-ferent conditions, and most RNA-seq studies can be classified as either: 1) differential gene expression (DGE) studies, where the overall transcriptional output of each gene is compared between conditions; 2) differential transcript/exon usage (DTU/DEU) stud-ies, where the composition of a gene’s isoform abundance spec-trum is compared between conditions, or 3) differential transcript expression (DTE) studies, where the interest lies in whether indi-vidual transcripts show differential expression between condi-tions. DTE analysis results can be represented on the individual transcript level, or aggregated to the gene level, e.g., by evaluating
whether at least one of the isoforms shows evidence of differential abundance.
In this report, we make and give evidence for three claims: 1) gene-level estimation is considerably more stable than transcript-gene-level; 2) regardless of the level at which abundance estimation is done,
inferences at the gene level are appealing in terms of robustness,
statistical performance and interpretation; 3) the magnitude of the difference between results obtained by simple counting and transcript- level abundance estimation is generally small in real data sets. However, despite strong overall correlations among results obtained from various quantification pipelines, taking advantage of transcript-level abundance estimates when defining or analyzing gene-level abundances leads to improved differential gene expres-sion results compared to simple counting.
To facilitate a broad range of analysis choices, depending on the biological question of interest, we provide an R package, tximport, to import transcript lengths and abundance estimates from sev-eral popular quantification packages and export (estimated) count matrices and, optionally, average transcript length correction terms (i.e., offsets) that can be used as inputs to common statistical engines, such as DESeq211, edgeR12 and limma13.
Data
Throughout this manuscript, we utilize two simulated data sets and four experimental data sets (Bottomly14 [Data set 3], GSE6457015 [Data set 4], GSE6924416 [Data set 5], GSE7216517 [Data set 6], see Supplementary File 1 for further details) for illustration. Details on the data generation and full records of the analyses are pro-vided in the data sets and Supplementary File 1. The first simu-lated data set (sim1; Data set 1) is the synthetic human data set from Soneson et al.18, comprising 20,410 genes and 145,342 transcripts and is available from ArrayExpress (accession E-MTAB-3766). This data set has three biological replicates from each of two simulated conditions, and differential isoform usage was intro-duced for 1,000 genes by swapping the relative expression levels of the two most dominant isoforms. For each gene in this data set, the total transcriptional output is the same in the two conditions (i.e., no overall DGE); it is worth noting that this is an extreme situ-ation, but provides a useful test set for contrasting DGE, DTU and DTE. The second simulated data set (sim2; Data set 2) is a synthetic data set comprising the 3,858 genes and 15,677 transcripts from the human chromosome 1. It is available from ArrayExpress with accession E-MTAB-4119. Also here, we simulated two conditions with three biological replicates each. For this data set, we simulated both overall DGE, where all transcripts of the affected gene showed the same fold change between the conditions (420 genes), differen-tial transcript usage (DTU), where the total transcriptional output was kept constant but the relative contribution from the transcripts changed (420 genes) and differential transcript expression (DTE), where the expression of 10% of the transcripts of each affected gene was modified (422 genes, 528 transcripts). The three sets of modi-fied genes were disjoint. Again, this synthetic data set represents an extreme situation compared to most real data sets, but provides a useful test case to identify underlying causes of differences between results from various analysis pipelines.
Data set 1.
http://dx.doi.org/10.5256/f1000research.7563.d109328
Data set 1 (html) contains all the R code that was used to perform the analyses and generate the figures for the sim1 data set28.
Data set 2.
http://dx.doi.org/10.5256/f1000research.7563.d109329
Data set 2 (html) contains all the R code that was used to perform the analyses and generate the figures for the sim2 data set29.
Data set 3.
http://dx.doi.org/10.5256/f1000research.7563.d109330
Data set 3 (html) contains all the R code that was used to perform the analyses and generate the figures for the Bottomly data set30.
Data set 4.
http://dx.doi.org/10.5256/f1000research.7563.d109331
Data set 4 (html) contains all the R code that was used to perform the analyses and generate the figures for the GSE64570 data set31.
Data set 5.
http://dx.doi.org/10.5256/f1000research.7563.d109332
Data set 5 (html) contains all the R code that was used to perform the analyses and generate the figures for the GSE69244 data set32.
Data set 6.
http://dx.doi.org/10.5256/f1000research.7563.d109333
Data set 6 (html) contain all the R code that was used to perform the analyses and generate the figures for the GSE72165 data set33.
Gene abundance estimates are more accurate than transcript abundance estimates
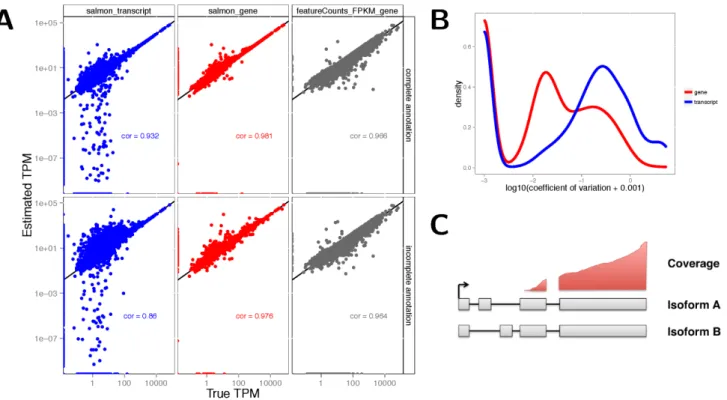
To evaluate the accuracy of abundance estimation with transcript and gene resolution, we used Salmon7 (v0.5.1) to estimate TPM val-ues for each transcript in each of the data sets. Gene-level TPM esti-mates, representing the overall transcriptional output of each gene, were obtained by summing the corresponding transcript-level TPM estimates. For the two simulated data sets, the true underlying TPM of each feature is known and we can thus evaluate the accuracy of the estimates. Unsurprisingly, gene-level estimates were more accurate than transcript-level estimates (Figure 1A, Supplementary Figures 1,2). We also derived TPM estimates from gene-level counts
Figure 1 (sim2). A: Accuracy of gene- and transcript-level TPM estimates from Salmon and scaled FPKM estimates derived from simple counts from featureCounts, in one of the simulated samples (sampleA1). Spearman correlations are indicated in the respective panels. Top row: using the complete annotation. Bottom row: using an incomplete annotation, with 20% of the transcripts randomly removed. Gene-level estimates are more accurate than transcript-Gene-level estimates. Gene-Gene-level estimates from Salmon are more accurate than those from featureCounts. B: Distribution of the coefficients of variation of gene- and transcript-level TPM estimates from Salmon, calculated across 30 bootstrap samples of one of the simulated samples (sampleA1). Gene-level TPM estimates are less variable than transcript-level estimates.
C: An example of unidentifiable transcript-level estimates, as uneven coverage does not cover the critical regions that would determine the amount that each transcript is expressed, while gene-level estimation is still possible.
obtained from featureCounts by dividing each of these with a rea-sonable measure of the length of the gene (the length of the union of its exons) and the total number of mapped reads, and scaling the estimates to sum to 1 million. The simple count estimates showed a lower correlation with the true TPMs than the Salmon estimates, in line with previous observations19. However, simple counts tended to show a high degree of robustness against incompleteness of the annotation catalog, as evidenced from estimation errors after first removing (at random) 20% of the transcripts (Figure 1A); in con-trast, Salmon transcript estimate accuracies deteriorated. From the bootstrap estimates generated by Salmon, we also estimated the coefficient of variation of the abundance estimates. The gene-level estimates showed considerably lower variability in both simulated and experimental data (Figure 1B, Supplementary Figures 3,4). Taken together, these observations suggest that the gene-level esti-mates are more accurate than transcript-level estiesti-mates and there-fore potentially allow a more accurate and stable statistical analysis. A further argument in favor of gene-level analysis is the unidentifi-ability of transcript expression that can result from uneven coverage caused by underlying technical biases (Figure 1C). Intermediate approaches, grouping together “indistinguishable” features are also conceiveable20, but not yet standard practice.
DTE is more powerful and easier to interpret on gene level than for individual transcripts
DTE is concerned with inference of changes in abundance at script resolution, and thus invokes a statistical test for each tran-script. We argue that this can lead to several complications: the first is conceptual, since the rows (transcripts) in the result table will in many cases not be interpreted independently, but will rather be grouping transcripts from the same gene, and the second one is more
technical, since the number of transcripts is considerably larger than the number of genes, which could lead to lower power due to the portioning of the total set of reads across a larger number of features and a potentially higher multiple testing penalty. We tested for DTE on the simulated data by applying edgeR12 to the transcript counts obtained from Salmon (the application of count models to estimated counts is discussed in the next Section), and represented the results as transcript-level p-values or aggregated these to the gene level by using the perGeneQValue function from the DEXSeq21 R pack-age. The transcript-level DTE test assesses the null hypothesis that the individual transcript does not change its expression, whereas the gene-level DTE test assesses the null hypothesis that all tran-scripts exhibit no change in expression. Framing the DTE question at the gene level results in higher power, without sacrificing false discovery rate control (Figure 2A). We note that this type of gene-level aggregation may favor genes in which one transcript shows strong changes, and that other approaches to increase power against specific alternatives are conceivable, e.g., capitalizing on the rich collection of methods for gene set analysis.
While DTE analysis is more suitable than DGE analysis for detect-ing genes with changes in absolute or relative isoform expression but no or only minor change in overall output (Supplementary Figure 5), we argue that even gene-level DTE results may suffer from lack of interpretability. DTE can arise in several different ways, from an overall differential expression of the gene or from differential relative usage of its transcripts, or a combination of the two (Figure 2B). We argue that the biological question of interest is in many cases more readily interpretable as a combination of DGE and DTU, rather than DTE. It has been our experience that results reported at the transcript level are still often cast to the gene level
Figure 2 (sim2). A: DTE detection performance on transcript- and gene-level, using edgeR applied to transcript-level estimated counts from Salmon. The statistical analysis was performed on transcript level and aggregated for each gene using the perGeneQValue function from the DEXSeq R package; aggregated results show higher detection power. The curves trace out the observed FDR and TPR for each significance cutoff value. The three circles mark the performance at adjusted p-value cutoffs of 0.01, 0.05 and 0.1. B: Schematic illustration of different ways in which differential transcript expression (DTE) can arise, in terms of absence or presence of differential gene expression (DGE) and differential transcript usage (DTU).
(i.e., given a differentially expressed transcript, researchers want to know whether other isoforms of the gene are changing), sug-gesting that asking two specific gene-level questions (Is the over-all abundance changing? Are the isoform abundances changing proportionally?) trumps the interpretability of one broad question at the transcript-level inference (Are there changes in any of the transcript expression levels?). Despite this, there are of course also situations when a transcript-centric approach is superior, for exam-ple in targeted experiments where specific isoforms are expected to change due to an administered treatment.
Incorporating transcript-level estimates leads to more accurate DGE results
DGE (i.e., testing for changes in the overall transcriptional output of a gene) is typically performed by applying a count-based infer-ence method from statistical packages such as edgeR12 or DESeq211 to gene counts obtained by read counting software such as
fea-tureCounts1, HTSeq-count2 or functions from the
GenomicAlign-ments22 R package. A lot has been written about how simple
count-ing approaches are prone to give erroneous results for genes with changes in relative isoform usage, due to the direct dependence of the observed read count on the transcript length23. However, the extent of the problem in real data has not been thoroughly investi-gated. Here, we show that taking advantage of transcript-resolution estimates (e.g., obtained by Salmon) can lead to improved DGE results. We propose two alternative ways of integrating transcript abundance estimates into the DGE pipeline: to define an “artificial” count matrix, or to calculate offsets that can be used in the statisti-cal modeling of the observed gene counts from, e.g., featureCounts. Both approaches are implemented in the accompanying tximport R package (available from https://github.com/mikelove/tximport). We defined three different count matrices for each data set: 1) using featureCounts from the Rsubread1 R package (denoted
featureCounts below), 2) summing the estimated transcript counts from Salmon within genes (simplesum), 3) summing the estimated transcript TPMs from Salmon within genes, and mul-tiplying with the total library size in millions (scaledTPM). We note that the scaledTPM values are artificial values, transforming underlying abundance measures to the “count scale” to incorpo-rate the information provided by the sequencing depth. We further used the Salmon transcript lengths and estimated TPMs to define average transcript lengths for each gene and each sample (normali-zation factors) as described in the Supplementary material, to be used as offsets for edgeR and DESeq2 when analyzing the feature-Counts and simplesum count matrices (featureCounts_avetxl and
simplesum_avetxl).
Overall, the counts obtained by all methods were highly corre-lated (Supplementary Figures 6–8), which is not surprising since any differences are likely to affect a relatively small subset of the genes. In general, the simplesum and featureCounts matrices led to similar conclusions in all considered data sets. However, there are differences between the two approaches in terms of how multi-mapping reads and reads partly overlapping intronic regions are handled24. The concordance between simplesum and featureCounts results also suggests that statistical methods based on the Negative Binomial assumption are applicable also to summarized, gene-level
estimated counts, which is further supported by the similarity
between the p-value histograms as well as the mean-variance rela-tionships observed with the three types of count matrices ( Supple-mentary Figures 9–14).
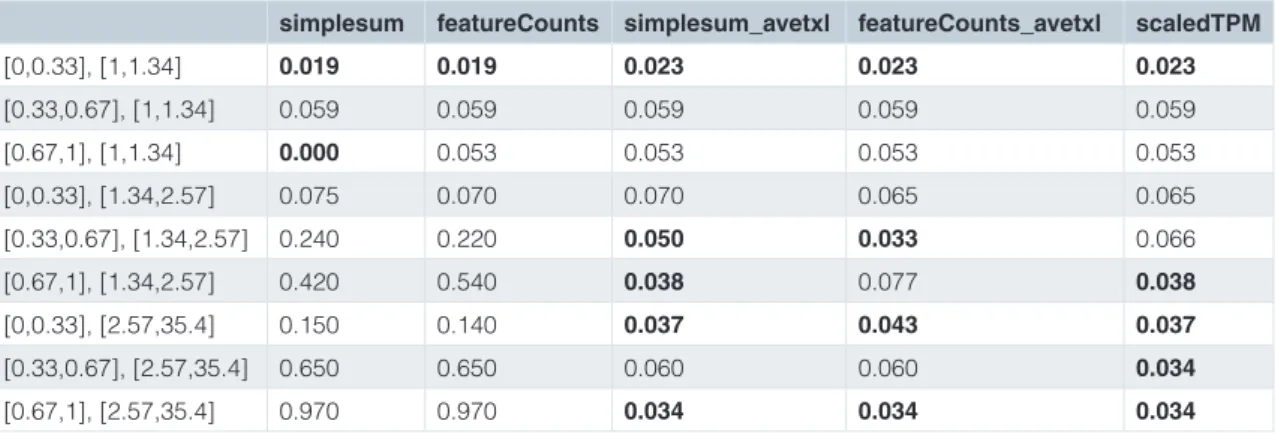
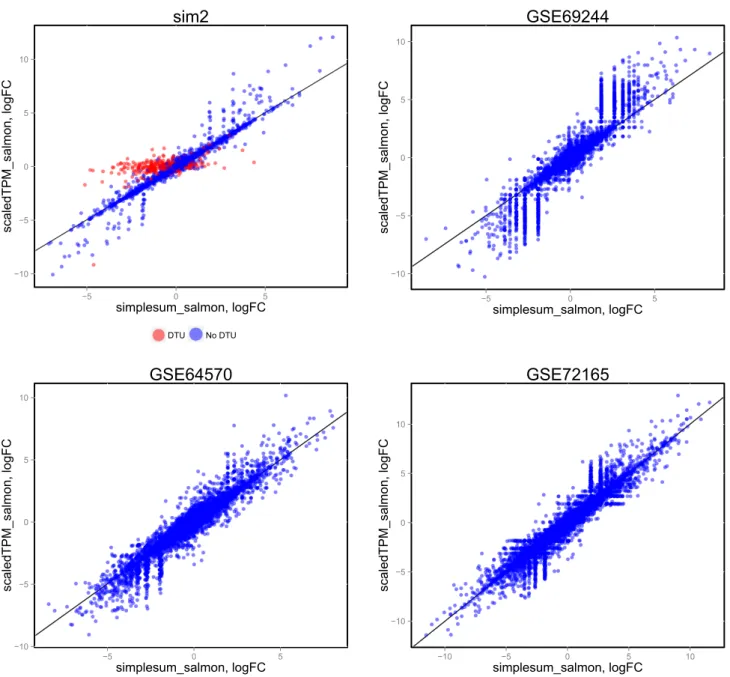
Accounting for the potentially varying average transcript length across samples when performing DGE, either in the definition of the count matrix (scaledTPM) or by defining offsets, led to consider-ably improved false discovery rate (FDR) control compared to using the observed featureCounts or aggregated Salmon counts (sim-plesum) directly (Figure 3A, Table 1). It is important to note that this improvement is entirely attributable to an improved handling of genes with changes in isoform composition between the conditions (Figure 3B, Supplementary Figure 15), that we purposely intro-duced strong signals in the simulated data set in order to pinpoint these underlying causes, and that the overall effect in a real data set will depend on the extent to which considerable DTU is present. Experiments on various real data sets (Supplementary Figure 16) show only small differences in the collections of significant genes found with the simplesum and simplesum_avetxl approaches, sug-gesting that the extent of the problem in many real data sets is limited, and that most findings obtained with simple counting are not induced by counting artifacts. Further support for this conclusion is shown in Figure 4 (see also Supplementary Figures 17–19 and Supplementary Table 1), where log-fold change estimates from edgeR, based on the simplesum and scaledTPM matrices, are contrasted. For the genes with induced DTU in the sim2 data set, log-fold changes based on the simplesum matrix are overestimated, as expected. However, this effect is almost absent in all the real data sets, again highlighting the extreme nature of our simulated data and suggesting that the effect of using different count matrices is considerably smaller for many real data sets. Table 1 suggests that the lack of error control for simplesum and featureCounts matrices is more pronounced when there is a large difference in length between the differentially used isoforms. In the group with smallest length difference, where the longer differentially used isoform is less than 34% longer than the shorter one, all approaches controlled the type I error satisfactorily. It is worth noting that among all human transcript pairs in which both transcripts belong to the same gene, the median length ratio is 1.85, and for one third of such pairs the longer isoform is less than 38% longer than the shorter one (see Data set 1).
Discussion
In this article, we have contrasted transcript- and gene-resolution abundance estimation and statistical inference, and illustrated that gene-level results are more accurate, powerful and interpretable than transcript-level results. Not surprisingly, however, accurate transcript-level estimation and inference plays an important role in deriving appropriate gene-level results, and it is therefore impera-tive to continue improving abundance estimation and inference methods applicable to individual transcripts, since misestimation can propagate to the gene level. We have shown that when test-ing for changes in overall gene expression (DGE), traditional gene counting approaches may lead to an inflated false discovery rate compared to methods aggregating transcript-level TPM values or incorporating correction factors derived from these, for genes where the relative isoform usage differs between the compared condi-tions. These correction factors can be calculated from the output of transcript abundance programs, using e.g., the provided R package (tximport). It is important to note that the average transcript length
Figure 3 (sim2). A: DGE detection performance of edgeR applied to three different count matrices (simplesum, scaledTPM, featureCounts), with or without including an offset representing the average transcript length (for simplesum and featureCounts). Including the offset or using the scaledTPM count matrix leads to improved FDR control compared to using simplesum or featureCounts matrices without offset. The curves trace out the observed FDR and TPR for each significance cutoff value. The three circles mark the performance at adjusted p-value cutoffs of 0.01, 0.05 and 0.1. B: stratification of the results in A by the presence of differential isoform usage. The improvement in FDR control seen in A results from an improved treatment of genes with differential isoform usage, while all methods perform similarly for genes without differential isoform usage.
Table 1 (sim1). Observed false positive rates from a differential gene expression analysis using edgeR applied to various count matrices (with a nominal p-value cutoff at 0.05), limited to genes with true underlying differential isoform usage (recall that no genes are truly differentially expressed in this data set). The results are stratified by “effect size” (the difference in relative abundance between the two differentially used isoforms) and the length ratio between the longer and the shorter of the differentially used isoforms. FPRs below the nominal p-value threshold (0.05) are marked in bold. For more details, see Data set 1.
simplesum featureCounts simplesum_avetxl featureCounts_avetxl scaledTPM
[0,0.33], [1,1.34] 0.019 0.019 0.023 0.023 0.023 [0.33,0.67], [1,1.34] 0.059 0.059 0.059 0.059 0.059 [0.67,1], [1,1.34] 0.000 0.053 0.053 0.053 0.053 [0,0.33], [1.34,2.57] 0.075 0.070 0.070 0.065 0.065 [0.33,0.67], [1.34,2.57] 0.240 0.220 0.050 0.033 0.066 [0.67,1], [1.34,2.57] 0.420 0.540 0.038 0.077 0.038 [0,0.33], [2.57,35.4] 0.150 0.140 0.037 0.043 0.037 [0.33,0.67], [2.57,35.4] 0.650 0.650 0.060 0.060 0.034 [0.67,1], [2.57,35.4] 0.970 0.970 0.034 0.034 0.034
offsets must account for the differences in transcript usage between the samples and thus using (sample-independent) exon-union gene lengths will not improve performance.
All evaluated counting approaches gave comparable results for genes where DTU was not present. Thus, the extent of the FDR inflation in experimental data depends on the extent of DTU between the compared conditions; notably, our simulation intro-duced rather extreme levels of DTU, hence the inflated FDR, and
the difference between the approaches was considerably smaller in real data sets. Recent studies have also shown that many genes express mainly one, dominant isoform25 and for such genes, we expect that simple gene counting will work well.
Our results highlight the importance of correctly specifying the question of interest before selecting a statistical approach. Summarization of abundance estimates at the gene level before per-forming the statistical testing should be the method of choice if the
interest is in finding changes in the overall transcriptional output of a gene. However, it is suboptimal if the goal is to identify genes for which at least one of the transcripts show differences in tran-scriptional output, since it may miss genes where two transcripts change in opposite directions, or where a lowly expressed transcript changes. For gene-level detection of DTE (that is, whether any transcript showed a change in expression between the conditions), statistical testing applied to aggregated gene counts led to reduced power and slightly inflated FDR compared to performing the
statistical test on the transcript level and aggregating results within genes (Supplementary Figure 5). Statistical inference on aggre-gated transcript TPMs (scaledTPM) showed low power for detect-ing changes that did not affect the overall transcriptional output of the gene, as expected. An alternative to DTE analysis, for potential improved interpretability, is to perform a combination of DGE and DTU analyses, both resulting in gene-level inferences. Table 2 sum-marizes our results and give suggested workflows for the different types of analyses we have considered.
Figure 4. Comparison of log-fold change estimates from edgeR, based on simplesum and scaledTPM count matrices, in four different data sets. For the simulated data set (sim2), where signals have been exaggerated to pinpoint underlying causes of various observations, genes with induced DTU (whose true overall log-fold change is 0) show a clear overestimation of log-fold changes when using simplesum
counts. However, none of the real data sets contain a similar population of genes, suggesting that for many real data sets, simple gene counting leads to overall similar conclusions as accounting for underlying changes in transcript usage.
−10 −5 0 5 10 −5 0 5 simplesum_salmon, logFC scaledTPM_salmon, logFC DTU No DTU
sim2
−10 −5 0 5 10 −5 0 5 simplesum_salmon, logFC scaledTPM_salmon, logFCGSE69244
−10 −5 0 5 10 −5 0 5 simplesum_salmon, logFC scaledTPM_salmon, logFCGSE64570
−10 −5 0 5 10 −10 −5 0 5 10 simplesum_salmon, logFC scaledTPM_salmon, logFCGSE72165
Of course, there may be situations where a direct transcript-level analysis is appropriate. For example, in a cancer setting where a specific deleterious splice variant is of interest (e.g., AR-V7 in pros-tate cancer26), inferences directly at the transcript level may be pre-ferred. However, while this may be preferred for individual known transcripts, transcriptome-wide differential expression analyses may not be warranted, given the associated multiple testing cost. Finally, we note that estimation at the gene level can reduce the problem of technical biases on expression levels and unidentifiable estimation. Current methods for transcript-level quantification (e.g.,
Cufflinks, RSEM, Salmon, kallisto) do not correct for amplification
bias on fragments, which can lead to many estimation errors, such as expression being attributed to the wrong isoform27. Non-uniform coverage from amplification bias or from position bias (3’ coverage bias from poly-(A) selection) can result in unidentifiable transcript-level estimation. Such errors and estimation problems are mini-mized when summarizing expression to the gene level.
Data availability
F1000Research: Data set 1. 10.5256/f1000research.7563.d109328
F1000Research: Data set 2. 10.5256/f1000research.7563.d109329
F1000Research: Data set 3. 10.5256/f1000research.7563.d109330
F1000Research: Data set 4. 10.5256/f1000research.7563.d109331
F1000Research: Data set 5. 10.5256/f1000research.7563.d109332
F1000Research: Data set 6. 10.5256/f1000research.7563.d109333
Software availability
Software access
https://github.com/mikelove/tximport
Source code as at the time of publication
https://github.com/F1000Research/tximport
Archived source code as at the time of publication
http://dx.doi.org/10.5281/Zenodo.35123
Software license
tximport is released under a GNU Public License (GPL).
Author contributions
CS, MIL and MDR conceived the study and developed method-ology. CS and MDR designed and carried out the computational experiments and drafted the manuscript. MIL implemented the
tximport R package and wrote parts of the manuscript. All authors
read and approved the final manuscript and have agreed to the content.
Competing interests
No competing interests were disclosed.
Grant information
MDR and CS acknowledge support from the “RNA & Disease” National Center of Competence in Research, an SNSF project grant (143883) and from the European Commission through the 7th Frame-work Collaborative Project RADIANT (Grant Agreement Number: 305626). MIL was supported by NIH grant 5T32CA009337-35. The funders had no role in study design, data collection and analysis, decision to publish, or preparation of the manuscript.
Acknowledgments
The authors would like to thank Magnus Rattray, Alexander Kanitz, Hubert Rehrauer and Xiaobei Zhou for helpful comments on earlier versions of this manuscript.
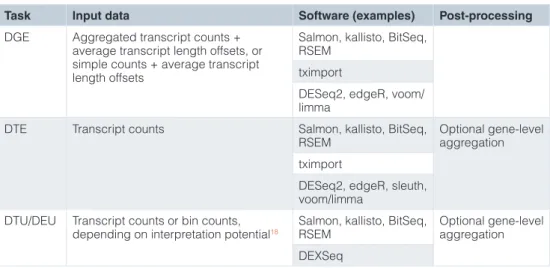
Table 2. Summary of suitable analysis approaches for the three types of comparative analyses discussed in the manuscript (DGE, DTE and DTU).
Task Input data Software (examples) Post-processing
DGE Aggregated transcript counts + average transcript length offsets, or simple counts + average transcript length offsets
Salmon, kallisto, BitSeq, RSEM
tximport
DESeq2, edgeR, voom/ limma
DTE Transcript counts Salmon, kallisto, BitSeq,
RSEM Optional gene-level aggregation tximport
DESeq2, edgeR, sleuth, voom/limma
DTU/DEU Transcript counts or bin counts,
depending on interpretation potential18 Salmon, kallisto, BitSeq, RSEM Optional gene-level aggregation DEXSeq
Supplementary material Supplementary File 1
Supplementary File 1 (pdf) contains more detailed information about the data sets, supplementary methods and supplementary figures referred to in the text.
Click here to access the data.
References
1. Liao Y, Smyth GK, Shi W: featureCounts: an efficient general purpose program for assigning sequence reads to genomic features. Bioinformatics. 2014; 30(7): 923–30.
PubMed Abstract |Publisher Full Text
2. Anders S, Pyl PT, Huber W: HTSeq - a Python framework to work with high-throughput sequencing data. Bioinformatics. 2015; 31(2): 166–169. PubMed Abstract |Publisher Full Text |Free Full Text
3. Trapnell C, Roberts A, Goff L, et al.: Differential gene and transcript expression analysis of RNA-seq experiments with TopHat and Cufflinks. Nat Protoc. 2012;
7(3): 562–78.
PubMed Abstract |Publisher Full Text |Free Full Text
4. Li B, Dewey CN: RSEM: accurate transcript quantification from RNA-Seq data with or without a reference genome. BMC Bioinformatics. 2011; 12: 323. PubMed Abstract |Publisher Full Text |Free Full Text
5. Glaus P, Honkela A, Rattray M: Identifying differentially expressed transcripts from RNA-seq data with biological variation. Bioinformatics. 2012; 28(13): 1721–1728.
PubMed Abstract |Publisher Full Text |Free Full Text
6. Bray N, Pimentel H, Melsted P, et al.: Near-optimal RNA-Seq quantification.
arXiv:1505.02710. 2015.
Reference Source
7. Patro R, Duggal G, Kingsford C: Accurate, fast, and model-aware transcript expression quantification with Salmon. bioRxiv. 2015.
Publisher Full Text
8. Mortazavi A, Williams BA, McCue K, et al.: Mapping and quantifying mammalian transcriptomes by RNA-Seq. Nat Methods. 2008; 5(7): 621–628.
PubMed Abstract |Publisher Full Text
9. Trapnell C, Williams BA, Pertea G, et al.: Transcript assembly and quantification by RNA-Seq reveals unannotated transcripts and isoform switching during cell differentiation. Nat Biotechnol. 2010; 28(5): 511–515.
PubMed Abstract |Publisher Full Text |Free Full Text
10. Wagner GP, Kin K, Lynch VJ: Measurement of mRNA abundance using RNA-seq data: RPKM measure is inconsistent among samples. Theory Biosci. 2012;
131(4): 281–285.
PubMed Abstract |Publisher Full Text
11. Love MI, Huber W, Anders S: Moderated estimation of fold change and dispersion for RNA-seq data with DESeq2. Genome Biol. 2014; 15(12): 550. PubMed Abstract |Publisher Full Text |Free Full Text
12. Robinson MD, McCarthy DJ, Smyth GK: edgeR: a Bioconductor package for differential expression analysis of digital gene expression data. Bioinformatics. 2010; 26(1): 139–40.
PubMed Abstract |Publisher Full Text |Free Full Text
13. Ritchie ME, Phipson B, Wu D, et al.: limma powers differential expression analyses for RNA-sequencing and microarray studies. Nucleic Acids Res. 2015;
43(7): e47.
PubMed Abstract |Publisher Full Text |Free Full Text
14. Bottomly D, Walter NA, Hunter JE, et al.: Evaluating gene expression in C57BL/6J and DBA/2J mouse striatum using RNA-Seq and microarrays. PLoS One. 2011;
6(3): e17820.
PubMed Abstract |Publisher Full Text |Free Full Text
15. Yang S, Marín-Juez R, Meijer AH, et al.: Common and specific downstream signaling targets controlled by Tlr2 and Tlr5 innate immune signaling in zebrafish. BMC Genomics. 2015; 16(1): 547.
PubMed Abstract |Publisher Full Text |Free Full Text
16. Currais A, Goldberg J, Farrokhi C, et al.: A comprehensive multiomics approach toward understanding the relationship between aging and dementia. Aging
(Albany. NY). 2015; 7(11): 937–955. PubMed Abstract
17. Chang AJ, Ortega FE, Riegler J, et al.: Oxygen regulation of breathing through an olfactory receptor activated by lactate. Nature. 2015; 527(7577):
240–244.
PubMed Abstract |Publisher Full Text
18. Soneson C, Matthes KL, Nowicka M, et al.: Differential transcript usage from RNA-seq data: isoform pre-filtering improves performance of count-based methods. bioRxiv. 2015.
Publisher Full Text
19. Kanitz A, Gypas F, Gruber AJ, et al.: Comparative assessment of methods for the computational inference of transcript isoform abundance from RNA-seq data. Genome Biol. 2015; 16(1): 150.
PubMed Abstract |Publisher Full Text |Free Full Text
20. Robert C, Watson M: Errors in RNA-Seq quantification affect genes of relevance to human disease. Genome Biol. 2015; 16: 177.
PubMed Abstract |Publisher Full Text |Free Full Text
21. Anders S, Reyes A, Huber W: Detecting differential usage of exons from RNA-seq data. Genome Res. 2012; 22(10): 2008–17.
PubMed Abstract |Publisher Full Text |Free Full Text
22. Lawrence M, Huber W, Pagès H, et al.: Software for computing and annotating genomic ranges. PLoS Comput Biol. 2013; 9(8): e1003118.
PubMed Abstract |Publisher Full Text |Free Full Text
23. Trapnell C, Hendrickson DG, Sauvageau M, et al.: Differential analysis of gene regulation at transcript resolution with RNA-seq. Nat Biotechnol. 2013; 31(1): 46–53.
PubMed Abstract |Publisher Full Text |Free Full Text
24. Zhao S, Xi L, Zhang B: Union Exon Based Approach for RNA-Seq Gene Quantification: To Be or Not to Be? PLoS One. 2015; 10(11): e0141910. PubMed Abstract |Publisher Full Text |Free Full Text
25. Gonzàlez-Porta M, Frankish A, Rung J, et al.: Transcriptome analysis of human tissues and cell lines reveals one dominant transcript per gene. Genome Biol. 2013; 14(7): R70.
PubMed Abstract |Publisher Full Text |Free Full Text
26. Antonarakis ES, Lu C, Wang H, et al.: AR-V7 and resistance to enzalutamide and abiraterone in prostate cancer. N Engl J Med. 2014; 371(11): 1028–38. PubMed Abstract |Publisher Full Text |Free Full Text
27. Love MI, Hogenesch JB, Irizarry RA: Modeling of RNA-seq fragment sequence bias reduces systematic errors in transcript abundance estimation. bioRxiv. 2015. Publisher Full Text
28. Soneson C, Love MI, Robinson MD: Data set 1 in: Differential analyses for RNA-seq: transcript-level estimates improve gene-level inferences.
F1000Research. 2015.
Data Source
29. Soneson C, Love MI, Robinson MD: Data set 2 in: Differential analyses for RNA-seq: transcript-level estimates improve gene-level inferences.
F1000Research. 2015.
Data Source
30. Soneson C, Love MI, Robinson MD: Data set 3 in: Differential analyses for RNA-seq: transcript-level estimates improve gene-level inferences.
F1000Research. 2015.
Data Source
31. Soneson C, Love MI, Robinson MD: Data set 4 in: Differential analyses for RNA-seq: transcript-level estimates improve gene-level inferences.
F1000Research. 2015.
Data Source
32. Soneson C, Love MI, Robinson MD: Data set 5 in: Differential analyses for RNA-seq: transcript-level estimates improve gene-level inferences.
F1000Research. 2015.
Data Source
33. Soneson C, Love MI, Robinson MD: Data set 6 in: Differential analyses for RNA-seq: transcript-level estimates improve gene-level inferences.
F1000Research. 2015.
F1000Research
Open Peer Review
Current Referee Status:
Version 1
12 January 2016 Referee Report
doi:
10.5256/f1000research.8143.r11745
Rob Patro
Department of Computer Science, Stony Brook University, Stony Brook, NY, USA
In this manuscript, the authors address a few questions of considerable (and perennial) interest in the
analysis of RNA-seq data. Specifically, they provide evidence that, using available methods (e.g. DESeq2
/ edgeR), assessing differential expression at the gene-level (DGE) is more robust than at the transcript
level (DTE). Further, they convincingly argue that estimating abundance at the level of transcripts, and
then aggregating these abundances to the gene level leads to improved estimation of differential gene
expression. They demonstrate that one of the major factors in this improved estimation is the availability
of a sample-specific feature length for each gene (derived from the abundance-weighted length of the
expressed transcripts of this gene), which is not possible to obtain with any fixed gene model used by
count-based methods. Finally, the authors argue that much of the analysis of interest at the transcript
level does not actually require differential transcript expression testing, but rather can be inferred from a
combination of DGE and differential transcript usage (DTU); this is an interesting proposition that merits
further discussion and analysis. Overall, this is a well-written paper, with extensive and compelling
supplementary and supporting data, that addresses a ubiquitous analysis task involving RNA-seq. It
should be of broad interest to the community and makes a valuable contribution. The accompanying
software,
tximport
, is user-friendly and makes it easy to apply the type of analysis recommended herein; it
too should be widely useful.
Major comments:
It would be very useful to provide the equations used for calculating each of the abundance measured
considered directly. Section 4 of the supplementary information is useful to this end, but the reader still
has to search a bit to see exactly how each metric is computed (though the fantastic R-Markdown
included with the figures means that these computations can be found explicitly).
Similarly, it would be useful to the reader to provide a description, in prose, of how specific experiments
were performed (again, the reproducible nature of most of these experiments makes tracking down this
information possible, but sometimes time-consuming). For example, how, precisely, was removal of
transcripts handled at the level of the genome annotation? If a transcript consists only of constitutive
exons, were all of those exons retained in the genome annotation used for STAR + featureCounts, while
the transcript was removed in the Salmon index?
The result that transcript-level abundance estimation is more sensitive to the removal of transcripts than
gene-level abundance estimation — this seems intuitive. However, I agree with Dr. Floor’s suggestion
that:
F1000Research
"The assertion that “simple counts tended to show a high degree of robustness against incompleteness of
the annotation catalog, as evidenced from estimation errors after first removing (at random) 20% of the
transcripts” seems misleading since Salmon-derived gene-level abundances actually show a higher
Spearman correlation than count-derived gene-level abundances when subjected to removing a random
20% of transcripts.”
I would suggest rewording this sentence, as the main result seems to be that gene-level analysis is more
robust to an incomplete annotation than transcript-level analysis. Transcript-level abundance estimation
followed by gene-level analysis seems to perform just as well (actually, better) than gene-level counting in
this scenario.
The experiments in the section “Incorporating transcript-level estimates leads to more accurate DGE
results” suggests the (reasonable) interpretation that the main benefit of incorporating transcript-level
abundance estimates when assessing DGE is a more accurate measure of the “feature” length of the
gene. The authors state “ It is important to note that this improvement is entirely attributable to an
improved handling of genes with changes in isoform composition between the conditions.” This is
supported by the fact that using the abundance-weighted average transcript length (i.e. offsets) with
counting based approaches improves the results substantially. However, one other place where
transcript-level abundance estimates are useful in the context of DGE is when assessing the expression
of paralogous genes. While most multi-mapping reads that derive from different isoforms of the same
gene will be uniquely mappable at the level of the genome, and hence will be included in the counts for
that gene, reads that map ambiguously among paralogs may not be. In such cases, count-based methods
do not have a principled way of apportioning a read between the paralogs involved, and discarding
multi-mapping reads may negatively affect estimation of the abundance of the paralogs, even at the gene
level. While this case is likely much less common than mis-estimation of DGE as a result of DTU, it is
certainly of biological interest. I would suggest adding an analysis, restricted to sets of paralogous genes,
comparing how the different approaches perform in this case. This may help to highlight the importance of
not only deriving appropriately weighted and sample-dependent lengths for genes, but also on resolving
multi-mapping ambiguity that occurs between genomically distinct loci.
The argument that most transcript-level analyses of interest may be addressed by looking at DGE in
conjunction with DTU is an interesting one. It is certainly that case that not all tasks for which DTE is used
actually require assessing differential expression at the transcript level. One issue with the DGE +
DTU-based analysis which warrants further discussion in the manuscript is that I believe that this
approach, too, would require correcting for multiple hypothesis testing. Specifically, one is testing both the
DGE and the DTU hypotheses for each gene (or for a relevant subset of interest). The correction here is
likely to be less harsh than in the case of assessing DTE, but is still worth discussing.
Minor comments:
As per Dr. Floor’s statement, Salmon (and Sailfish) also incorporate sequence-specific bias correction.
Further, RSEM and Salmon (and a few other transcript-level abundance estimation tools) also incorporate
the modeling of non-uniform fragment start position distributions. Of course, modeling a non-uniform start
position distribution cannot overcome a complete lack of sampling in critical regions that might make
determining transcript-level fragment assignment impossible, but it may help in properly apportioning an
ambiguously-mapped fragment between transcripts depending on its relative position in each.
One potential added source of variability here is that all Salmon estimates presented in the manuscript
F1000Research
make use of Salmon’s quasi-mapping of reads, while the STAR + featureCount pipeline makes use of
“traditional” alignments. This is the primary intended usage mode of Salmon, and absolutely does
represent a “typical” pipeline for methods that avoid alignment (Salmon, Sailfish, kallisto). However, it
would probably be best to mention this as a potential (though likely negligible) additional source of
variability.
In the discussion, the authors argue that “... it is therefore imperative to continue improving abundance
estimation and inference methods applicable to individual transcripts, since misestimation can propagate
to the gene level.” This is, of course, an important and valid suggestion. Another direction, on which it
would be useful to get the authors’ thoughts and suggestions, is the development of differential
expression tools (at either the transcript or gene level) that can make use of the variance estimates that
some tools (like Salmon) can provide. To what extent might incorporating this information help control
false positive rates and improve DTE or even DGE estimates?
I have read this submission. I believe that I have an appropriate level of expertise to confirm that
it is of an acceptable scientific standard.
No competing interests were disclosed.
Competing Interests:
04 January 2016 Referee Report