Methods for Determining the Genetic
Causes of Rare Diseases
Daniel Greene
MRC Biostatistics Unit
University of Cambridge
This dissertation is submitted for the degree of
Doctor of Philosophy
Methods for Determining the Genetic Causes of Rare
Diseases
Daniel Greene
Thanks to the affordability of DNA sequencing, hundreds of thousands of individuals with rare disorders are undergoing whole-genome sequencing in an effort to reveal novel disease aetiologies, increase our understanding of biological processes and improve patient care. However, the power to discover the genetic causes of many unexplained rare diseases is hindered by a paucity of cases with a shared molecular aetiology. This thesis presents research into statistical and computational methods for determining the genetic causes of rare diseases. Methods described herein treat important aspects of the nature of rare diseases, including genetic and phenotypic heterogeneity, phenotypes involving multiple organ systems, Mendelian modes of inheritance and the incorporation of complex prior information such as model organism phenotypes and evolutionary conservation.
The complex nature of rare disease phenotypes and the need to aggregate patient data across many centres has led to the adoption of the Human Phenotype Ontology (HPO) as a means of coding patient phenotypes. The HPO provides a standardised vocabulary and captures relationships between disease features. The use of such ontologically encoded data is widespread in bioinformatics, with ontologies defining relationships between concepts in hundreds of subfields. However, there has been a dearth of tools for manipulating and analysing ontological data. I developed a suite of software packages dubbed ‘ontologyX’ in order to meet these needs, simplify visualisation of such data, and enable them to be incor-porated into complex analysis methods. An important aspect of the analysis of ontological data is quantifying the semantic similarity between ontologically annotated entities, which is implemented in the ontologyX software. We employed this functionality in a phenotypic similarity regression framework, ‘SimReg’, which models the relationship between ontologi-cally encoded patient phenotypes of individuals and rare variation in a given genomic locus. It does so by evaluating support for a model under which the probability that a person carries rare alleles in a locus depends on the similarity between the person’s ontologically encoded phenotype and a latent characteristic phenotype which can be inferred from data. A proba-bility of association is computed by comparison of the two models, allowing prioritisation of candidate loci for involvement in disease with respect to a heterogeneous collection of disease phenotypes. SimReg includes a sophisticated treatment of HPO-coded phenotypic data but dichotomises the genetic data at a locus. Therefore, we developed an additional
method, ‘BeviMed’, standing forBayesian Evaluation of Variant Involvement in Mendelian
rare variants within a genomic locus and a case/control label. It is capable of inferring the probability of association, and conditional on association, the probability of each mode of inheritance and probability of involvement of each variant. Inference is performed through a Bayesian comparison of multiple models: under a baseline model disease risk is independent of allele configuration at the given rare variant sites and under an alternate model disease
risk depends on the configuration of alleles, a latent partition of variants intopathogenic
andnon-pathogenicgroups and a mode of inheritance. The method can be used to analyse a dataset comprising thousands of individuals genotyped at hundreds of rare variant sites in a fraction of a second, making it much faster than competing methods and facilitating genome-wide application. The thesis concludes by describing an analysis pipeline and web application called ‘Gene-docs’ that utilises ontologyX, SimReg and BeviMed to perform inferences and makes the results and the underlying data available to collaborating biologists and clinicians.
I would like to dedicate this thesis to my wife Danielle, whose love and support has been my motivation thoughout.
Declaration
I hereby declare that except where specific reference is made to the work of others, the contents of this dissertation are original and have not been submitted in whole or in part for consideration for any other degree or qualification in this, or any other university. This dissertation is my own work and contains nothing which is the outcome of work done in collaboration with others, except as specified in the text and Acknowledgements. This dissertation contains fewer than 60,000 words including appendices, bibliography, footnotes, tables and equations.
Daniel Greene January 2018
Acknowledgements
I would like to thank my supervisor, Dr. Ernest Turro, who has been consistently supportive, generous with his time and ideas, and an inspiration. Being his student has been a privilege and a joy, and without him none of this would have been possible. I would also like to thank my co-supervisors, Professor Sylvia Richardson and Professor Willem Ouwehand, for all of their support, direction and many fruitful discussions over the years. I am also grateful to my colleague William Astle, who has always made time for technical discussions and had many good suggestions.
I would like to thank my wife, Danielle, and our children, Sean and Lyra, for their love and patience, for keeping my spirits up, and being there for me every day. Lastly, I would like to thank my parents, Brendan and Michele, for all their encouragement and support during the course of my PhD, and for opening all the doors which led me here.
Table of contents
List of figures xiii
List of tables xv
1 Background 1
1.1 A portrait of rare Mendelian diseases . . . 3
1.2 The impact of high-throughput sequencing on rare disease research . . . 7
1.3 The National Institute for Health Research BioResource–Rare Diseases project dataset . . . 8
1.4 The ThromboGenomics platform . . . 10
1.5 Overview of thesis . . . 11
1.6 Current methods and software for analysing rare disease data . . . 14
2 Methods for ontological data and applications 23 2.1 ontologyX . . . 24
2.2 Statistical significance of within-group ontological similarity . . . 29
2.3 Rare variant prioritisation for genetic diagnostics . . . 34
2.4 Similarity to model organism phenotypes . . . 36
2.5 Unsupervised clustering of ontological phenotypes . . . 38
3 Phenotype similarity regression 45 3.1 Introduction . . . 45
3.2 Model specification . . . 47
3.3 Inference . . . 54
3.4 Simulation study . . . 58
3.5 Application to real data . . . 62
xii Table of contents
4 Bayesian evaluation of variant involvement in Mendelian disease 71
4.1 Introduction . . . 72
4.2 Model specification . . . 73
4.3 Inference . . . 75
4.4 Simulation study . . . 80
4.5 Application to real data . . . 84
4.6 Discussion . . . 89
5 Gene-docs: a web application for browsing phenotypic and genetic data 93
6 Conclusions 99
References 105
Appendix A ontologyX comparisons and examples 117
Appendix B SimReg manual 123
List of figures
1.1 Number of rare alleles observed per gene . . . 2
1.2 Pairs of organ systems affected by rare diseases . . . 6
1.3 HPO encoded phenotypes in the NBR–RD project . . . 9
1.4 Example HPO phenotype . . . 15
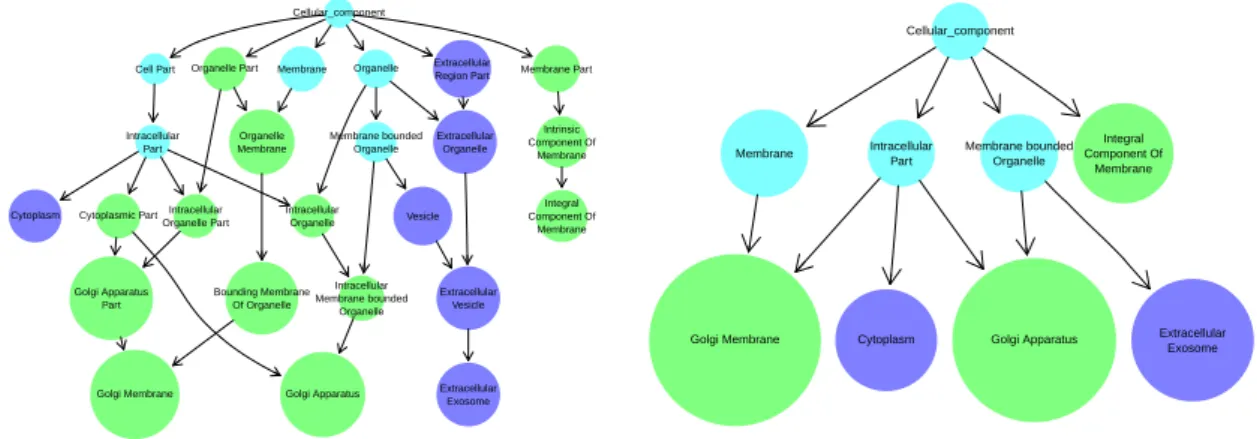
2.1 Visualisation of ontological set operations in ontologyIndex . . . 25
2.2 GO annotation ofQPCTLandCRNN . . . 28
2.3 Distribution of comorbidities in BPD study participants . . . 32
2.4 Heatmap of phenotypic similarity between BPD cases grouped by pedigree and clinical diagnosis . . . 33
2.5 Prioritisation of variants by similarity to gene HPO profile . . . 35
2.6 Performance of HPO-based variant prioritisation . . . 36
2.7 Prioritisation of variants for family with bleeding, thrombocytopenia and bone pathologies . . . 39
2.8 Schematic representation of enrichment test strategy for phenotype clustering 41 3.1 Cartoon of SimReg model . . . 46
3.2 Priors for similarity transformations f andg . . . 51
3.3 Inferredφ for various parameterisations of the similarity function . . . 52
3.4 SimReg simulation study . . . 60
3.5 Relationship between genetic heterogeneity and power . . . 61
3.6 SimReg specificity . . . 62
3.7 SimReg results forACTN1 . . . 65
3.8 SimReg results forDIAPH1andRASGRP2 . . . 67
3.9 SimReg results for all genes . . . 68
4.1 BeviMed simulation study . . . 83
4.2 BeviMed inference applied toANKRD26. . . 87
xiv List of figures
5.1 Gene-docs main page . . . 95
5.2 BeviMed annotation of variants on gene page forGP1BB . . . 96
5.3 Gene-docs pedigree page . . . 97
List of tables
1.1 NBR–RD subprojects . . . 10
2.1 Execution time for retrieving descendants and ancestors of terms using different ontology software . . . 26
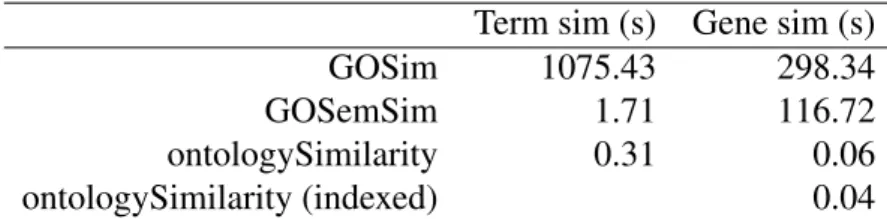
2.2 Performance comparison of semantic similarity packages in R . . . 29
2.3 Abbreviations used for HPO terms in Figure 2.7 . . . 40
3.1 SimReg performance evaluation . . . 63
3.2 Known disease-gene associations identified using SimReg . . . 69
4.1 Loci with BeviMed posterior probabilities of association with thrombocy-topenia at least 0.9 . . . 89
Chapter 1
Background
It is important that the underlying genetic causes of rare diseases are identified in order to further our understanding of biology, identify affected relatives and improve patient management. Analysis of cosegregation between genetic markers and disease within large disease-affected families has led to the identification of the genes involved in thousands of rare diseases over the last few decades. However, the aetiologies of many diseases have not yet been discovered. Recently, high-throughput sequencing has been used to call genetic variants — specific sequences of nucleotides at specific locations relative to a reference genome — in all genes, Whole-Exome Sequencing (WES), or across the entire genome Whole-Genome Sequencing (WGS), facilitating association-based study designs. Consequently, large genomic sequencing studies attempting to solve unexplained diseases are underway. For example, the 100,000 Genomes project [67], which was established to create a genomic medicine service for the United Kingdom National Health Service, will
sequence the genomes of 50,000 individuals with rare diseases and their close relatives.
Genome-wide association studies (GWAS) have identified thousands of common variants marginally associated with common diseases or quantitative traits. However, methods that test for marginal association are underpowered for identifying the determinants of rare diseases. This is because rare diseases are typically caused by combinations of only one or two rare alleles, each of which may be observed in only a very small number of individuals in a study. Borrowing of information across variants, at least those within particular genomic regions — also known as loci — is therefore an important requirement of any good statistical association method for rare diseases. In order to boost power in the context of such genetic heterogeneity, methods that combine genotype data across many variants in a locus have been developed. ‘Burden tests’ borrow information across variants in a region by aggregating alleles within loci, and test for association between the phenotype and the aggregated allele count. However, the majority of rare variants are neutral with respect to severe disease
2 Background 0 50 100 150 200
Rare alleles per gene in 6087 Europeans
0 300 600 900 0 500 1000 1500 2000 2500 3000 3500 4000 4500 5000 5500 6000 6500 7000 7500 8000
Open Reading Frame length
Number of genes
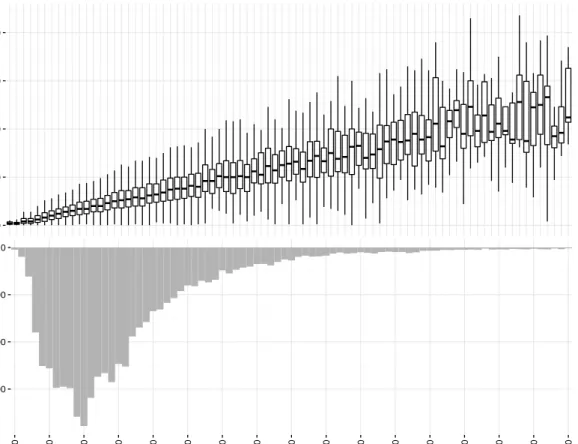
Fig. 1.1 Top: the distribution of the number of rare alleles observed per gene by open reading frame length. There is a clear linear relationship between gene length and number of rare alleles observed, suggesting that the majority of rare variants are benign. Bottom: histogram of open reading frame length for human genes.
(see Figure 1.1), which reduces the power of such methods due to the inclusion of benign variants in the aggregation. There exist statistical methods which are designed for identifying associations between complex traits and rare variants, but these do not explicitly model the modes of inheritance typical of rare diseases. Furthermore, rare disease phenotypes are often composite, involving features affecting multiple organ systems and which manifest stochastically and with variable severity. Thus, many disease phenotypes are not effectively represented by existing models.
1.1 A portrait of rare Mendelian diseases 3
1.1
A portrait of rare Mendelian diseases
The majority of rare genetic diseases are ‘Mendelian’ in the sense that they are caused by the presence of pathogenic alleles on one or two chromosomes, and can therefore be inherited respectively ‘dominantly’ or ‘recessively’. They are so called because the first evidence for traits being transmitted in such a way was presented using the colour and shape of pea
pods by Gregor Mendel, an Austrian monk who lived in the 19th century. There are over
7,000 known Mendelian diseases [77] and a genetic aetiology has been found for at least half of them. Between them, they affect approximately 1 in every 20 people, and all organ systems in the body. Despite their overall prevalence, individual Mendelian diseases are rare due to the effects of negative selection pressure and low mutation rate during meiosis (thede novomutation rate depends on factors including genomic location and paternal age,
but is approximately 1.3×10⁻⁸nucleotides per generation [26]). Consequently, deleterious
alleles responsible for rare diseases have typically arisen recently in the population and presently have a very low population allele frequency. An allele that causes severe disease in
childhood in everyone who carries it would result only fromde novomutation and would
occur with frequency no greater than the prevalence of the disease. On the other hand, a mild disease or a disease with late onset may be caused by alleles with higher frequencies. In recessive diseases, individuals who carry a pathogenic allele on only one chromosome are unaffected, and there is therefore weaker negative selection against the allele. For example, Bernard-Soulier syndrome is an autosomal recessive disease which causes reduced platelet count, increased mean platelet volume and abnormal bleeding tendency. It has a prevalence estimated to be less than one in a million live births, whilst variants which cause the disease can have a population allele frequency as high as 0.06% [17, 55]. Population-specific factors may also play a role. Sickle-cell disease, which causes red blood cells to be malformed and results in anaemia, is also recessively inherited. However, in regions where malaria is endemic, heterozygotes have a reproductive advantage due to the fact that alleles responsible for sickle-cell disease confer malaria resistance. Hence, the most common pathogenic variant has persisted at frequencies in excess of 15% in some West African populations, where prevalence of the disease can be as high as 4% [62].
Rare diseases are often caused by variants in or affecting protein-coding genes — seg-ments of the genome which are transcribed to RNA and then translated to sequences of amino acids from which proteins are formed — because of the potential for major disruption of cell biology which depends on proteins functioning correctly. Variants in genes may have various impacts on protein formation, depending on the how they affect the sequence of ‘codons’, nucleotide triplets in the DNA which directly translate to amino acids. Due to redundancy of codon translations to amino acids, some variants, termed ‘synonymous’ do not alter amino
4 Background
acid sequence and therefore generally do not affect protein formation. ‘Non-synonymous’ variants generate codons which do lead to an amino acid change, and therefore are considered more likely to be pathogenic. ‘Frame-shift’ variants cause a shift in the Open Reading Frame (ORF) — the sequence of codons that gets translated — for the gene by inserting or deleting a non-multiple of three nucleotides, therefore leading all subsequent codons to be mistranslated. A ‘Stop-gain’ variant is a Single Nucleotide Variant (SNV) which results in a codon being re-placed with a stop-codon, which discontinues translation, and therefore results in a truncated protein product. Splicing is part of the process whereby RNA molecules transcribed from DNA are converted to mRNA molecules, which can then be translated to generate proteins. It consists of removing the ‘introns’, untranslated sequences of nucleotides between ‘exons’, translated sequences of nucleotides, from the RNA. ‘Splice-variants’ are variants which interfere with splicing, for example causing exons to be omitted from or introns retained abnormally in the resultant mRNA. The regions which lie immediately upstream of the start-codon and downstream of the stop-codon for a gene do not get translated and are known
as the 5′ untranslated region (UTR) and 3′UTR respectively. Variants which lie in these
regions have the potential to disrupt translation by affecting the binding or unbinding of the translational machinery. There is often substantial genetic heterogeneity amongst individuals with the same rare disease, typically due to different variants in the same gene or functional
unit leading to the same consequences. For example, there are over 2,000 distinct variants
in theCFTRgene that can cause cystic fibrosis [14], an autosomal recessive disease which
progressively damages the lungs.
To discover the cause of disease, affected individuals would ideally be groupeda priori
into clusters with a shared (though unknown) genetic aetiology, whilst all other individuals could be treated as controls. Unfortunately, the nature of rare diseases and collection of rare disease phenotype data means it is often difficult to separate rare disease cases into such groups. This is because the majority of rare diseases are phenotypically heterogeneous, indeed, most affect more than one organ system as is shown in Figure 1.2. Additionally, many rare diseases exhibit substantial phenotypic variability with respect to the presence and severity of disease features. In the past, this has led to diseases subsequently found to
have a common genetic cause being given a multitude of names. For example,MYH9-related
disease has been called May-Hegglin anomaly, Fechtner syndrome, Sebastian syndrome and Epstein syndrome [97]. Even the same pathogenic variant — a serine to leucine substitution
at position 96 of theMYH9gene — appears to cause hearing loss, renal dysfunction and
cataracts stochastically and with low correlation [74]. Moreover, phenotypic heterogeneity can be sufficiently large to induce significant overlap of clinical phenotypes between dif-ferent diseases. For example, a low platelet count and abnormal bleeding are both typical
1.1 A portrait of rare Mendelian diseases 5
characteristics ofMYH9-related disease, but they are also present in patients with the
aetio-logically distinct Wiskott-Aldrich syndrome. Similarly, abnormal bleeding and abnormal platelet granules typically manifest in Wiskott-Aldrich patients, but these phenotypes are also present in cases with the aetiologically distinct Hermansky-Pudlak syndrome. See Feng et al. [23], Anikster et al. [4], Suzuki et al. [111], Zhang et al. [125], Morgan et al. [71], Li et al. [57], Cullinane et al. [18] and Beaulieu et al. [7] for further examples. Furthermore, pathogenic variants may not have complete ‘penetrance’, that is they do not always cause the
symptoms of the disease to be manifested. For example, variants inBRCA1responsible for
dominantly inherited breast cancer confer only a 54% risk of developing breast cancer by age 60 [20].
The power of case/control association tests is likely to be compromised by misspecifi-cation of the disease status label, and thus such tests are not well suited to a heterogeneous collection of rare disease cases. Tests which summarise the clinical manifestations of a disease with a single variable (e.g. see methods described in Lee et al. [51]), lose power when multiple phenotypic traits contain complementary information about the same causal geno-type, which is often the case for rare diseases. Although methods for modelling pleiotropy of variants — the property of influencing multiple traits — have proven successful in the context of genome-wide association studies [9, 78, 107], they are ill-suited for rare disease studies in which the phenotype data are often of mixed type, contain correlated components and are collected with variable detail and completeness.
The HPO addresses the need for a standardised vocabulary for rare disease phenotypes and is being used to encode the disease phenotypes of participants for several large inter-national projects [119, 24, 81, 33]. It is a directed acyclic graph (DAG) representing over 10,000 phenotypic abnormalities as nodes connected to each other through ‘is-a’ relations, represented as edges. The HPO was created with the support of experts in many areas of medicine to accommodate coding of phenotypic data derived from diverse sources, such as laboratory assays, images, graphs and clinical interpretations. Methods exist that compare HPO phenotypes with HPO-coded profiles corresponding to known diseases for the purpose of differential diagnosis [47, 6]. The HPO-coded profiles can be supplemented with func-tional gene-specific information to prioritise genes [100, 121]. If genotype data are available, these and other methods [93, 124] can be used to prioritise variants and potentially suggest new causes of disease [44, 100, 121]. However, there have been no statistical association methods which share information between the HPO-encoded phenotypes of rare disease cases and relate the phenotype to the genetic variant data.
6 Background
Abnormality of the endocrine system Abnormality of connective tissue Abnormality of the respiratory system Abnormality of blood and blood−forming tissues Abnormality of the immune system Abnormality of the ear Abnormality of the cardiovascular system Abnormality of the digestive system Abnormality of the genitourinary system Growth abnormality Abnormality of metabolism/homeostasis Abnormality of the integument Abnormality of the musculature Abnormality of the eye Abnormality of the skeletal system Abnormality of the nervous system
Abnor
mality of the ner vous system Abnor mality of the sk eletal system Abnor mality of the e ye Abnor mality of the m usculature Abnor
mality of the integument Abnor mality of metabolism/homeostasis Gro wth abnor mality Abnor
mality of the genitour inar
y system
Abnor
mality of the digestiv e system
Abnor
mality of the cardio
vascular system
Abnor
mality of the ear Abnor
mality of the imm une system Abnor mality of b lood and b lood−f orming tissues Abnor
mality of the respir ator y system Abnor mality of connectiv e tissue Abnor
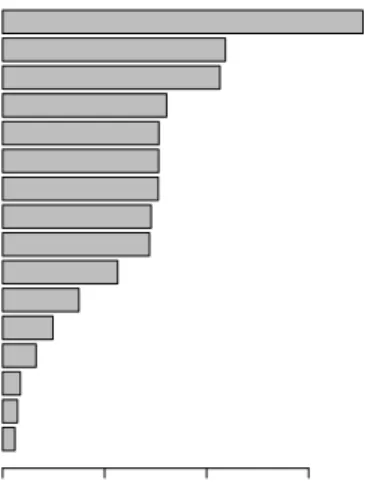
mality of the endocr ine system Proportion of diseases 682 828 886 924 1078 1351 1515 1569 1575 1622 1832 1896 1954 2426 2860 3474 # diseases
Fig. 1.2 Distribution of organ systems co-affected by rare diseases for each organ system (rows). The bar chart on the right shows the total number of diseases affecting each organ
system. A total of 6,911 rare diseases are represented, with phenotype data downloaded
1.2 The impact of high-throughput sequencing on rare disease research 7
1.2
The impact of high-throughput sequencing on rare
dis-ease research
The revolution of high-throughput sequencing technology has seen the cost of sequencing a human genome fall from $1 billion to $1,000 since it began in 2005 with the launch of the Roche 454 sequencing machine. The state of the art in 2017 is the Illumina dye sequencing technique, which was selected for use in the 100,000 Genomes Project. The
technology is based on sequencing by synthesis, recording the sequence of bases in short
single-stranded DNA molecules by detecting flourescently tagged nucleotides as they are incorporated onto the complementary strand. This procedure can be performed in parallel on tens of millions of fragments with the latest Illumina sequencing machines, which are able to sequence 45 human genomes to a depth averaging 30 reads per base in a day at a cost of $1,000 per genome [66]. The output of such high throughput short read sequencing is a set of nucleotide sequences of some given length, corresponding to sections of the genome of the sequenced individual. The reads must then be aligned to the human reference genome to allow comparison between them and for genetic variants to be called.
The use of high-throughput sequencing to study rare diseases began with WES because rare diseases are often caused by exonic variants and exomes are much smaller than genomes (an exome is approximately 60 megabases, which is 2% of the size of a whole genome [75]), therefore making them cheaper to sequence. In WES, sample exonic DNA fragments are selected from amongst genomic DNA fragments using an oligonucleotide hybridisation technique [5]. The selected fragments can then be sequenced using a high-throughput sequencing technique. WES opened up new opportunities for determining the genetic causes of rare diseases as rare diseases are often caused by exonic variants, and unlike with the standard Single Nucleotide Polymorphism (SNP) genotyping arrays, any number of rare exonic variants can be observed. There is therefore the potential to unlock clinical benefits: many individuals with rare diseases suffer years of futile clinical and genetic tests, misdiagnosis, and lack of properly informed treatment in a so-called ‘diagnostic odyssey’. However, approximately 15,000–20,000 variants are observed per sequenced exome [108], motivating prefiltering in order to increase power to identify which variants are pathogenic. Typically, analysis proceeds by filtering variants for allele frequency against databases of variation for the healthy population [65], for example ExAC and gnomAD [55], enabling many variants to be ruled out because their allele frequency is too high to be consistent with their involvement in a rare heritable disorder. Furthermore, interpretation of specific exonic sequence variants is aided by prediction of consequences for protein sequence and formation [69]. For example, synonymous variants are typically removed from consideration.
8 Background
Depending on the exact parameters of the filtering, this often leaves hundreds of candidate variants. Further analysis consists of either looking at cosegregation of variants with disease amongst exome sequenced family members or by applying tests of association between rare variation and disease status for unrelated people. Rare variants are much more numerous than common variants across the genome, which renders the hypothesis space in rare disease research much larger than in GWAS of complex traits. Therefore, variants in the same locus need to be modelled jointly to achieve adequate power.
In exome sequencing studies of rare diseases, the proportion of affected participants for whom a pathogenic or likely pathogenic variant is identified is usually quite low. For instance, the Deciphering Developmental Disorders (DDD) project is an exome sequencing project which was set up to determine the genetic cause of developmental disorders. It sequenced 13,600 affected individuals and a further 20,000 of their parents, and has revealed 30 novel associations between genes and developmental disorders. As of April 2015, a pathogenic or likely pathogenic variant was identified for only 27% of participants, comprising 1,133 previously investigated undiagnosed children with developmental disorders [120].
The falling cost of WGS has led to it substituting WES as the standard tool for investigat-ing rare diseases as it provides more uniform coverage across exons and has the potential to reveal the involvement of non-exonic variants. However, variation in the non-exonic regions of the genome is comparatively harder to interpret in terms of its biological impact. The non-exonic regions of the genome are also much larger, and millions of variants are called per individual. Cohorts for deriving population allele frequencies are also currently smaller:
ExAC contains 123,136 exome sequences compared with 15,496 whole-genome sequences
for gnomAD as of May 2017.
1.3
The National Institute for Health Research BioResource–
Rare Diseases project dataset
The National Institute for Health Research BioResource–Rare Diseases (NBR–RD) project
was established as a pilot study for the 100,000 Genomes project to test the feasibility of
applying uniform sequencing to a large number of individuals, obtain molecular diagnoses for participants, and ultimately uncover novel aetiologies of genetic diseases. The data generated by this project were used in the development of the methods presented in this thesis. It
has sequenced over 7,000 probands — original disease-affected members of the families
participating in the study — and about 2,000 additional affected and unaffected relatives as
1.3 The National Institute for Health Research BioResource–Rare Diseases project dataset9 Number of terms Frequency 0 5 10 15 0 500 1000 1500
Abnormality of connective tissue Growth abnormality Abnormality of the ear Abnormality of the musculature Abnormality of the skeletal system Abnormality of the digestive system Abnormality of the endocrine system Abnormality of the genitourinary system Abnormality of the nervous system Abnormality of the integument Abnormality of the eye Abnormality of metabolism/homeostasis Abnormality of the cardiovascular system Abnormality of the immune system Abnormality of the respiratory system Abnormality of blood and blood−forming tissues
Number of individuals 0 500 1000 1500
Fig. 1.3 Left: the distribution of the number of HPO terms used to encode the phenotypes of HPO-coded individuals in the NBR–RD project. Right: the number of individuals coded with each high-level phenotypic abnormality term.
The data for each disease category are analysed by a specialised team comprising experts in the particular disease phenotype, geneticists and bioinformaticians. Given a particular disease category, individuals assigned to different disease categories can generally be treated as controls. This is sometimes complicated by phenotypic overlap between projects: for example, thrombocytopenia — a pathologically low platelet count — is a phenotype which manifests in some individuals enrolled to the Primary Immune Disorder (PID) project and some to the Bleeding and Platelet Disorders (BPD) project. Participant phenotypes have been encoded using HPO terms where applicable. Amongst the patients whose phenotypes have been encoded, the number of terms used had a mode of one and mean of four per person. The top-level phenotype abnormalities — HPO terms which descend from the term ‘Phenotypic abnormality’ — mostly correspond to abstract abnormalities of different organ systems, but also to developmental processes (e.g. Growth abnormality) and tissue types (e.g. Abnormality of connective tissue). Figure 1.3 shows the distribution of the number of terms used per individual and the prevalence of top-level phenotypic abnormalities amongst the cases in the collection. The most frequent top-level phenotypic abnormality term was ‘Abnormality of blood and blood-forming tissues’, annotated to 1,766 individuals.
The participants were sequenced using Illumina’s short read sequencing platform and resultant reads were aligned to the human reference genome hg19 using the Isaac aligner [90]. Variants were called with the ‘Northstar’ pipeline, involving SNV caller Starling and Struc-tural Variant (SV) callers Manta and Canvas. The variants were then filtered to create a subset for use in downstream analysis by retaining those which had an allele frequency of
10 Background
at most 0.1% in any of the reference cohorts (including 1000 Genomes [1], UK10K [115], ExAC and gnomAD [55]), were classified as non-synonymous, frame-shift, splice-site or
stop-gain/stop-loss, or located in the 5′ UTR or 3′ UTR regions of a gene. After filtering,
3,863,577 variants were retained, observed across 9,632 people.
Testing for association between so many genetic variants in so many individuals affected by one of so many different rare diseases is challenging. Powerful new methods which are robust to phenotypic heterogeneity, genetic heterogeneity within and across loci, and which are computationally efficient will be required if large projects focusing on sequencing and analysing probands such as the NBR–RD project are to yield the best possible results.
Sub project Sequenced individuals
Bleeding and Platelet Disorders (BPD) 1167
Cerebral small vessel disease (CSVD) 244
Ehlers-Danlos and Ehlers-Danlos like syndromes (EDS) 15
Genomics England pilot (GEL) 1963
Hypertrophic Cardiomyopathy (HCM) 241
Intrahepatic Cholestasis of Pregnancy (ICP) 261
Leber Hereditary Optic Neuropathy (LHON0 71
Multiple Primary Malignant Tumours (MPMT) 521
Neuropathic Pain Disorders (NPD) 168
Pulmonary Arterial Hypertension (PAH) 1131
Primary Immune Disorders (PID) 1308
Primary Membranoproliferative Glomerulonephritis (PMG) 151
Stem Cell and Myeloid Disorders (SMD) 221
Specialist Pathology: Evaluating Exomes in Diagnostics (SPEED) 1384
Steroid Resistant Nephrotic Syndrome (SRNS) 249
Table 1.1 NBR–RD breakdown of sequenced individuals by project
1.4
The ThromboGenomics platform
The ThromboGenomics platform [99] was designed in order to improve the rate of diagnosis of BPDs. It is a high-throughput sequencing assay targeting a panel of 63 genes known to be involved in BPDs selected by expert clinicians and researchers. The panel of genes tested is updated annually based on the results of ongoing research into the genetic causes of BPDs. Targeting such a small genomic area allows for cost-effective high-depth sequencing of the gene panel, leading to highly confident identification of variants. SNV/indels and structural variants are called using GATK [68] and ExomeDepth [83] respectively, and are filtered for low frequency against control populations, at most 10% minor allele frequency amongst other
1.5 Overview of thesis 11
ThromboGenomics samples to guard against systematic artefacts and predicted consequence
according to SnpEff (retaining only those with a predicted translational impact ofMODERATE
orHIGH, or lying within a splice region). The filtered variants are then assessed for clinical
significance by a multi-disciplinary team (MDT) comprising a mixture of clinical, genetics and bioinformatics experts. The platform was validated against 300 samples from individuals comprising a mixture of BPD cases with a previously identified causal variant, BPD cases with a suspected disorder but without knowledge of causal variants, BPD cases whose phenotypes could not be matched to a known BPD, and unaffected relatives. The average number of potentially significant variants retained affecting the 63 genes per individual across the 300 samples was 5.34. When the targeted sequencing assay was applied to the 159 samples from cases with a previously identified causal variant, all such variants were recapitulated by the platform, demonstrating its efficacy. However, when applied to 76 samples from the cases whose phenotypes could not be matched to a known BPD, only eight molecular diagnoses were reached, emphasising the need for further investigation into the causes of BPDs.
1.5
Overview of thesis
Chapter 2 begins with a description of the software which I developed in order to lay the foundations for analysing ontologically encoded phenotypes. The software, dubbed ‘ontol-ogyX’ [39], constitutes a suite of R packages which enables sets of ontological terms to be represented, visualised and compared to other sets using semantic similarity measures, operations which were previously difficult to perform. It then continues to describe applica-tions of quantifying the phenotypic similarity of HPO-coded individuals, including testing hypotheses about the involvement of variants harboured by particular genes in disease and using phenotypic similarity to prioritise candidate variants for a given case. It concludes by describing an approach for testing association between phenotypically similar individuals and presence of rare alleles in the same genes by partitioning HPO-coded individuals into clusters based on phenotypic similarity. Unsupervised clustering of phenotypes is used to generate clusters, and the members and non-members of each cluster in turn are respectively treated as the cases and controls upon which association tests can be performed.
Chapter 3 describes work which builds upon the phenotype similarity methods introduced in Chapter 2 by incorporating it into a Bayesian model for the relationship between rare alleles and disease. The method, named ‘SimReg’, enables prior information to be taken into account whilst testing a specific alternative model, whereby similarity between an individual’s HPO phenotype and a latent characteristic disease phenotype predicts disease
12 Background
risk. The method allows the disease phenotype to be estimated from the data, is powerful to detect pleiotropy, robust to phenotypic variability and is the first disease association method which is applicable to phenotype data encoded using HPO terms. We then show that the
method is effective by applying it to over 2,000 individuals with various rare diseases for
whom high-throughput sequencing data was available, recovering numerous true associations between diseases and genes, including a novel disease-gene association [109]. Allele counts at rare variant sites are aggregated in SimReg, and therefore power is reduced by inclusion of non-pathogenic variants in the aggregation. In order to increase power for testing association between a set of rare variants containing both pathogenic and non-pathogenic varieties, and a disease for which cases are clearly distinguishable from controls, we developed another method called ‘BeviMed’, presented in Chapter 4.
In BeviMed, a Bayesian comparison of a baseline model where disease risk is independent of allele configuration at given rare variant sites and an alternate model where it depends on the configuration of alleles at a latent subset of pathogenic variants is used to infer a probability of association, and conditional on association, the probability of involvement of each variant. We compare BeviMed with other methods for testing association between allele counts at rare variant sites and disease status, and demonstrate that BeviMed is more powerful, particularly for recessive diseases, using a simulation study. We then apply BeviMed to the NBR–RD project data and recover numerous true associations between genes and thrombocytopenia. Chapter 5 describes a web-application which was developed alongside the methods described in earlier chapters, and makes the results of systematic application of these methods and the raw data used to generate them available to clinicians. The current chapter concludes by introducing the literature on quantifying similarity of sets of ontological terms and describing the various methods for analysing HPO data and statistical association methods for rare variants, which are referred to in later chapters.
Publications
During my PhD I have contributed to several publications, upon which the majority of this thesis is based. For completeness I list them here, including my contribution and where applicable the chapter or section in which they are discussed.
• D. Greene, S. Richardson and E. Turro (2017). “ontologyX: A suite of R packages for
working with ontological data”. Bioinformatics, 33(7):1104-1106.
Methodological development, discussed in Section 2.1.
• S. K. Westbury†, E. Turro†, D. Greene†, C. Lentaigne†, A. M. Kelly†, T. K. Bariana†,
1.5 Overview of thesis 13
genetic defects in 707 cases with unexplained bleeding and platelet disorders”.Genome
Med, 7(1):36.
Methodological development and data analysis, discussed in Section 2.2.
• I. Simeoni, J. C. Stephens, F. Hu, S. V. Deevi, K. Megy, T. K. Bariana, . . . ,D. Greene
et al. (2016). “A high-throughput sequencing test for diagnosing inherited bleeding,
thrombotic, and platelet disorders”.Blood, 127(23):2791–2803.
Data analysis, discussed in Section 2.3.
• E. Turro,D. Greene, A. Wijgaerts, C. Thys, C. Lentaigne, T. K. Bariana, et al. (2016).
“A dominant gain-of-function mutation in universal tyrosine kinaseSRCcauses
throm-bocytopenia, myelofibrosis, bleeding, and bone pathologies”. Science Translational
Medicine, 8(328):328ra30.
Data analysis, discussed in Section 2.4.
• D. Greene, NIHR BioResource–Rare Diseases Consortium, S. Richardson and E. Turro (2016). “Phenotype similarity regression for identifying the genetic determinants
of rare diseases”. The American Journal of Human Genetics, 98(3):490–499.
Methodological development and data analysis, discussed in Chapter 3.
• S. Stritt, P. Nurden, E. Turro,D. Greene, S. B. Jansen, S. K. Westbury, et al. (2016).
“A gain-of-function variant inDIAPH1causes dominant macrothrombocytopenia and
hearing loss”.Blood, 127(23):2903–2914.
Data analysis, discussed in Chapter 3.
• D. Greene, NIHR BioResource–Rare Diseases Consortium, S. Richardson and E. Turro (2017). “A fast association test for identifying pathogenic variants involved in
rare diseases”.The American Journal of Human Genetics, 101(1):104–114.
Methodological development and data analysis, discussed in Chapter 4.
• S. Sivapalaratnam, S. K. Westbury, J. C. Stephens, D. Greene, K. Downes, A. M.
Kelly, et al. (2017). “Rare variants inGP1BBare responsible for autosomal dominant
macrothrombocytopenia”. Blood, 129(4):520–524.
Data analysis.
• N. Pontikos, J. Yu, I. Moghul, L. Withington, F. Blanco-Kelly, T. Vulliamy, . . . , D.
Greeneet al. (2017). “Phenopolis: an open platform for harmonization and analysis
of genetic and phenotypic data”.Bioinformatics.
14 Background
• S. K. Westbury, M. Canault,D. Greene, E. Bermejo, K. Hanlon, M. P. Lambert, et al.
(2017). “Expanded repertoire ofRASGRP2variants responsible for platelet dysfunction
and severe bleeding”. Blood.
Data analysis.
• P. Tuijnenburg†, H. L. Allen†, S. O. Burns,D. Greene, M. H. Jansen, E. Staples, et al.
“Whole-Genome Sequencing identifiesNFKB1haploinsufficiency as the commonest
monogenic cause of Common Variable Immunodeficiency”. Journal of Allergy and
Clinical Immunology(under review). Data analysis.
†indicates equal contribution.
1.6
Current methods and software for analysing rare
dis-ease data
Ontologically encoded data
Phenotype data are increasingly being encoded using ontological terms, for example from the HPO and Mammalian Phenotype Ontology (MPO). If such data are to be analysed effectively, methods for manipulating ontological terms which account for the structure of the ‘ontology’ in which they belong are required. In information science, an ontology is a formal description of a set of entities, called ‘terms’, their properties, and the relationships between them. They therefore support systematic reasoning about the entities they describe. Typically, ontologies specify ‘is a’/‘subclass of’ relations between terms forming a DAG, although arbitrary relations can be represented. Ontologies may be encoded in Open Biomedical Ontologies (OBO) format or Web Ontology Language (OWL) format (with OWL format the more expressive, supporting more complex relationships and reasoning). There exist ontologies describing over 100 biomedical subjects which can be downloaded in either format from the OBO Foundry’s website [103].
Ontological annotation is used to describe many biological phenomena, including gene function [34], variant effects [116] and human phenotype abnormalities [48], with many annotation datasets publicly available. Sets of ontological terms annotating the same entity
will be assumed to be non-redundant, hereafter referred to as minimal. Formally, a set
of terms is said to be non-redundant/minimal if and only if it lacks elements implied by other terms in the set through directed edges in the ontology. The terms highlighted blue in Figure 1.4 comprise such a set, as there is no directed path between any pair of blue nodes.
1.6 Current methods and software for analysing rare disease data 15 Phenotypic abnormality Thrombocytopenia Abnormality of thrombocytes Abnormality of blood and blood forming tissues Bleeding with minor or no trauma Abnormal bleeding Joint hemorrhage Prolonged bleeding after surgery Prolonged bleeding following procedure Prolonged bleeding after dental extraction Decreased mean platelet volume Recurrent infections
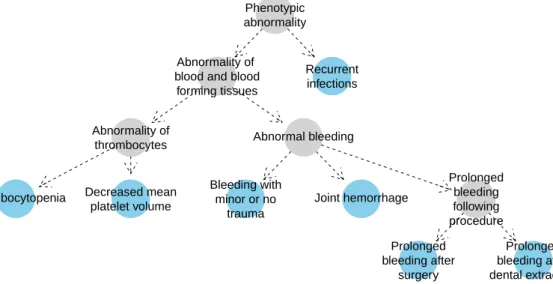
Fig. 1.4 Example HPO coding of the disease phenotype of an individual with Wiskott-Aldrich syndrome. The nodes in blue imply the presence of the more general ancestral phenotypes depicted as grey-filled nodes. No blue node has a directed path to any other, which means
that the blue nodes comprise aminimalset of HPO terms.
Semantic similarity measures
A semantic similarity measure is a metric on terms or sets of terms where the distance between entities reflects how similar their meanings are. Semantic similarity measures for terms belonging to ontologies are often defined with respect to the structure of their ontologies, so we discuss such measures here. There are various methods for evaluating the similarity of two terms, which typically fall into categories: edge-based similarity measures, based on the edges connecting the terms in the ontology; vector-based similarity measures, for example the Jaccard metric (the size of the intersection divided by the size of the union) and node-based similarity measures. Here we refer to the ‘ancestors’ of a term in an ontology to mean the set of terms for which it satisfies the transitive ‘is-a’ relation encoded in the DAG structure of the ontology.
Pesquita et al. [80] argues that edge-based methods, which define similarity between two terms based on the number of edges between them or between them and their common ancestors, are unsuited to biomedical ontologies. Nodes and edges at the same depth (i.e. number of edges away from the root terms — terms with no parents) in biomedical ontologies do not generally have the same specificity and do not represent the same semantic distance respectively. Vector-based methods, although simple to implement, do not leverage the structure of the ontology. We therefore discuss only node-based similarity measures here.
16 Background
Node-based measures typically define the similarity between two terms in terms of the
‘information content’. The information content is defined with respect to the frequencypof
the term within some set of ontologically annotated objects:
IC(t) =−logp
Resnik’s ‘similarity’ [91] of two terms is defined as the information content of the most informative common ancestor of two terms:
sResnik(t1,t2) = max
t∈anc(t1)∩anc(t2)
IC(t). (1.1)
where anc(t)denotes the union of the termt and set of ancestor terms oft. Lin et al. [59]
proposed an alternative expression for the similarity of two terms. A maximum value of 1 is obtained when two terms are the same (unlike Resnik’s measure, where the similarity is just that of their most informative common ancestor).
sLin(t1,t2) =maxt∈anc(t1)∩anc(t2)IC(t)
IC(t1) +IC(t2) (1.2)
There are several ways of defining the frequency of terms, from which the information content can be computed. For example, the frequency could be defined as the frequency of annotation within some collection of ontologically annotated entities, such as the HPO annotated diseases in Online Mendelian Inheritance in Man (OMIM). There exist other methods for evaluating the similarity of two ontological terms, but they are not reviewed here (see Lee et al. [54] for more details).
Similarity between sets of terms
The expressions for the similarity of terms can be extended to give the similarity between sets of terms in different ways. A popular approach is the ‘best match’ method. This method is
based on taking an expression for between-term similarity,s, and for each term in term setA,
using it to select the best-matching term in term setB. The similarities of these best matches
are then pooled and aggregated, for example by taking the mean, producing a similarity score. The same procedure is then applied to the swapped term sets, and the two aggregated scores
are combined by taking the average or product. Thus, the similaritySof term setsAandB
1.6 Current methods and software for analysing rare disease data 17 S′(A→B) = 1 |A|t
∑
A∈A max tx∈B s(tA,tx)1tA∈anc(tx), Smean(A,B) = S′(A→B) +S′(B→A) 2 , Sproduct(A,B) =S′(A→B)×S′(B→A) (1.3)The best choice of measure depends on the particular application [80]. For instance, if sensitivity to sharing rare ancestral terms when evaluating the similarity of two sets of terms is desired, a best match average measure based on Resnik’s expression for the similarity of two terms is appropriate as it is equal to the information content of the most informative ancestral term, and therefore sharing a rare term contributes substantially to the similarity. On the other hand, a best match average measure based on Lin’s expression is more robust, as two terms have a maximum similarity of 1, which occurs if they are the same. Therefore, averaging over the similarities of multiple terms in a set strongly reduces the contribution of rare terms present because of noise.
Software for working with ontological data
The ontoCAT R package enables simple querying and traversal of ontologies, but many of its key functions are slow and dependency on Java hinders its portability. There are software packages enabling manipulation and plotting of graphs, for example the R packages graph [35] and Rgraphviz [40] respectively, which can be used to view sections of ontolo-gies. However, their functions are low level, which makes procedures such as plotting of ontological term sets and fine-grained control of graphical parameters quite involved. There are R packages which provide procedures for computing semantic similarities between terms and sets of terms for specific ontologies [31, 122, 123] but they do not support semantic similarity computation for arbitrary ontologies. The the majority of these packages, including the primary ones GOSim and GOSemSim, depend on the GO.db package [13], which stores information about the Gene Ontology (GO) and GO gene annotations in a precompiled SQLite databases and is accessed through the DBI [89] package. This makes it inflexible — for example, by preventing the user from using a custom information content upon which to base semantic similarity calculations. They also do not allow the computation of semantic similarity between arbitrary term sets, in spite of this being a critical task for many appli-cations, instead, only allowing semantic similarity between annotated genes specified (by default) through Entrez IDs. Furthermore, the methods provided by these packages are quite slow applied large datasets comprising hundreds or thousands of sets of terms.
18 Background
In summary, there is a paucity of flexible routines for calculating semantic similarities in R, and there has been no software which enables ontological data relating to arbitrary ontologies to be manipulated, easily visualised and used in semantic similarity calculations in mainstream statistical languages.
Methods for analysing ontologically encoded phenotypes
Phenomizer Phenomizer [47] is a differential diagnosis tool which uses semantic similarity to rank HPO encoded disease phenotypes derived from OMIM by their relevance to a query set of HPO terms. The similarities are computed using the best-match average based on Resnik’s expression. There is a tendency for semantic similarity measures to exhibit annotation bias whereby high similarity is observed for sets of terms containing many terms.
Therefore, instead of using the raw semantic similarity, ap-value is estimated by permutation,
i.e. the similarity to the query set of HPO terms is compared to the distribution of similarities between the query set and randomly selected sets of the same number terms. Diseases are
then ranked by thep-values obtained.
BOQA BOQA [6], which stands for ‘Bayesian Ontology Query Algorithm’, is an algorithm
for differential diagnosis designed to be noise and imprecision tolerant by modelling a query phenotype as an outcome which depends on a latent disease state. It uses a three-layer Bayesian network: the bottom layer is the configuration of rare diseases for a given individual (i.e. a Boolean vector corresponding to disease status for each disease), the middle layer is the configuration of ontological phenotype terms which depends on the configuration of diseases, and the top layer is the query layer which depends on the second layer. Ontological structure is modelled by propagating parent-child relations through the ontology in the phenotype configuration and query layers. Noise (nuisance terms) and imprecision (missing/less specific terms) are each modelled using a constant probability of occurrence. Marginal probabilities of each disease are then inferred and used to rank differential diagnoses.
Exomiser Exomiser [102] is an application which ranks candidate variants for a disease-affected individual or family by combining various sources of information relevant to the likely pathogenicity. Information used includes a phenotypic relevance score based on semantic similarity between the individual’s ontologically encoded phenotype and any phenotype terms associated with the genes in which the candidate variants lie.
1.6 Current methods and software for analysing rare disease data 19
Statistical methods for relating rare variants to rare diseases
Probability of loss-of-function intolerance Haploinsufficiency for a particular gene oc-curs when disease is caused by having only a single functional copy of a gene, although not all genes are prone to haploinsufficiency. The probability of loss-of-function intolerance score (pLI) [55] for a gene is an estimated probability of haploinsufficiency given an observed number of protein truncating alleles across samples. The estimate is based on modelling the protein truncating allele count for each gene using a Poisson distribution whose rate depends on a latent class of the gene (haploinsufficient, recessive or Protein Truncating Variant (PTV)
tolerant). The rates are estimateda prioribased on the observed number of protein truncating
alleles for genes whose class is known. Notably, virtually all genes which are known to cause disease through haploinsufficiency score highly (pLI > 0.9), and 72% of genes with pLI > 0.9 have no known disease phenotype, despite the strong evidence of constraint against PTVs.
Burden testing A typical genome differs from the human reference genome at
approx-imately 4 million sites, with 40,000-200,000 of these variants having frequencies below
0.5% [1]. Thus, even after filtering variants (for example based on population allele frequency
and predicted consequence as described earlier), there will be many benign candidate variants and allele counts will be too low to have good power by testing marginally for association. Burden tests aggregate rare variants within a genomic locus in order to boost power when testing for association with a disease phenotype. An example of a Burden test is the ‘cohort allelic sums test’ [72] which uses a genetic score that is equal to 1 if an individual carries at least 1 (or 2) alleles at the filtered variant sites under a dominant (or recessive) inheritance
model, and 0 otherwise. A Fisher exact test is then used to compute ap-value of association
between a dichotomous phenotype and the genetic score.
SKAT SKAT specifies a random effect for each variant and performs a score test under
the null hypothesis that the variance of the random effects is zero. The variance-covariance structure of the random effects under the alternative hypothesis is determined by a kernel function, which would typically be a weighted genetic correlation across the variants in the locus. SKAT can incorporate nuisance covariates, accounts for linkage disequilibrium between variants under consideration and is well-powered for traits whereby many different variants in a locus with varying effect sizes and allele frequencies contribute to the phenotype. The following model for disease risk conditional on genotypes is employed by the test:
20 Background
whereyis the disease status ofnindividuals (yi=1 if individualiis affected, 0 otherwise),
X is a matrix of covariates,Gis the genotypes of the individuals at the variant sites in some
genetic locus (i.e.Gi j ∈ {0,1,2}equalling the number of copies of the rare allele at variant
site jcarried by individuali) for homozygous,α0is the background rate of disease, andα
andβ are random effects. The SKAT test is performed by assuming that theβ values follow
a distribution with a mean of zero and variance ofτ. Testing the null hypothesis that there
is no association with disease (i.e.β =0) is therefore equivalent to testingτ=0. This can
be done using a variance-component score test, and thus only requires the null model to be fitted. The score statistic is:
Q= (y−µˆ)′K(y−µˆ),
where ˆµ is the estimated mean ofyunder the null, andK is ann×nmatrix whose entries
depend on the kernel function K,Kii′ =K(Gi·,Gi′·), giving the genetic similarity of
indi-vidualsiandi′.K should be chosen depending on the kinds of effects which are modelled.
By default, the weighted linear kernel is used, i.e. K(Gi·,Gi′·) =
p
∑
j=1
wjGi jGi′j, wherewj
is the weighting for variant j. Epistatic effects can be modelled by using the weighted
Identity By State (IBS) kernel, i.e. K(Gi·,Gi′·) =
p
∑
j=1
wj(2− |Gi j−Gi′j|), and all main
effects and pairwise interaction effects can be modelled using the quadratic kernel, i.e.
K(Gi·,Gi′·) =
p
∑
j=1
wj(1+Gi jGi′j)2.
The score statistic follows a mixture Chi-square distribution under the null, for which
p-values can be computed efficiently using the Davies method [19]. When the weighted
linear kernel is used,Qcan be computed given only the individual variant test statistics for
marginal involvement,Sj: Q= p
∑
j=1 wjS2j, Sj=G·j(y−µˆ).ThusKneed not be evaluated, and the value of the statistic can be computed rapidly.
How-ever, if a non-linear kernel is used, this is no longer possible and SKAT quickly becomes
computationally expensive, with complexity at leastO(n2). In the available
implementa-tions [53, 95]K is evaluated explicitly, requiring memory for ann×ndense matrix to be
allocated, therefore leading to a prohibitively large memory footprint when the sample size is large.
1.6 Current methods and software for analysing rare disease data 21
SKAT is more powerful than the Burden test when the proportion of variants in the analysis which are pathogenic is lower, or when the effect directions of the variants is mixed, and vice-versa when the proportion of pathogenic variants is close to 1 and the effect sizes are in the same direction. SKAT-O [52] maximises power by forming a test statistic which is a linear combination of the SKAT and Burden test statistics, estimated adaptively from the data.
Methods which identify likely pathogenic variants For scientific follow-up, it is impor-tant to infer which variants are likely to be pathogenic, conditional on an association being
present in a given locus. The backwards elimination [43] procedure removes individual
variants iteratively from the predictors as long as this increases a test statistic of association
(either Burden or SKAT). Theadaptive combination of p-values(ADA) [60] algorithm ranks
variants by p-value obtained using Fisher’s exact test and selects a threshold on p-value
that maximises an aggregate test statistic. As these algorithms prune variants in a step-wise fashion, they do not explore the full space of possible combinations of pathogenic variants. It is also important that inference can be performed sufficiently quickly to enable application across tens of thousands of regions, with tens to hundreds of variants in each one. ADA
and backwards elimination SKAT/Burden rely on permutations to obtain empirical p-values,
rendering them too computationally expensive to apply in these scenarios.
In principle, Bayesian inference lends itself well to rare variant association analysis be-cause it provides a coherent framework for sharing information across variants and provides
a natural way of incorporating prior information on variant pathogenicity. Thevariational
Bayes discrete mixture(vbdm) method [63], theBayesian risk index (BRI) [87], the inte-grative Bayesian model uncertaintymethod (iBMU) and theBayesian rare variant detector
(BRVD) [58] all model a mixture of pathogenic and non-pathogenic variants in a locus. The iBMU method includes a hierarchical model for the probabilities that individual variants contribute to disease risk given a set of predictor-level covariates. However these models employ additive models of disease risk or severity suited to complex diseases rather than rare diseases caused by dominant or recessive inheritance of one or two pathogenic alleles. Typically, Bayesian methods are slow, due to the necessity of averaging over prior distribu-tions, and often depend on Markov chain Monte Carlo (MCMC) inference procedures. This is particularly so in variable selection scenarios, such as selecting a set of involved variants. The vbdm method uses a variational Bayes inference technique, derived by factorising the likelihood of model parameters over the indicators of pathogenicity for each variant, which makes inference rapid. However, the derivation of the algorithm depends on an additive
22 Background
model for a quantitative trait, hence it cannot be extended to a model for Mendelian modes of inheritance.
Chapter 2
Methods for ontological data and
applications
Ontologies are widely used in bioinformatics, but the absence of simple, general tools for manipulating ontological data has made analysis of such data unnecessarily difficult. In particular, in order to develop complex methods which utilise rare disease phenotype data encoded using HPO terms, a solid software layer upon which to build them is required. This chapter begins by presenting ‘ontologyX’ [39], a suite of R packages which simplify and harmonise the manipulation, analysis and visualisation of ontological data for arbitrary ontologies. The ontologyIndex package enables arbitrary ontologies to be read into R, supports representation of ontological objects by native R types, and provides a parsimonius set of performant functions for querying ontologies. ontologySimilarity and ontologyPlot extend ontologyIndex with functionality for straightforward visualization and semantic similarity calculations respectively. Methods for analysing collections of ontologically annotated entities are then discussed, including assessment of the statistical significance of ontological similarity within-group ontological similarity of groups of term sets, prioritisation of variants based on similarity between HPO-encoded phenotype and disease HPO profiles, comparison of ontologically encoded rare disease phenotypes with those of model organisms and analysis of clusters generated using unsupervised clustering algorithms.
The description of the ontologyX software given in this Chapter is based on that given in: D. Greene, S. Richardson and E. Turro (2017). “ontologyX: A suite of R packages for
24 Methods for ontological data and applications
2.1
ontologyX
ontologyIndex
ontologyIndex is an R package which I developed in order to provide a low-level set of functions for exploiting the structure of ontologies. Ontologies can be read into R from files in OBO format, with most commonly used ontologies available in this format on the OBO Foundry’s website [103]. Ontologies which are only available in a OWL format may be used by first converting them into OBO format, for example using the ROBOT command line tool [79]. OWL format allows expression of relationships which can’t be expressed in OBO format, so therefore information may be lost in conversion to OBO format. For example, OWL enables quantified relationships between terms and relationships with arbitrary cardinalities
to be represented, for example, ‘insecthas 6legs’. However, the functionality exposed by
ontologyIndex only depends on the is-a relationship being defined, so does not depend on any of these more complex relationships, and hence it is always sufficient to convert to OBO
format beforehand. A custom internal representation of ontologies — theontology_index
class — stores properties of terms. Anontology_indexobject is alistcontaining named
slots corresponding to term properties. Each slot is then avectororlistcontaining one
value per term, depending on the cardinality of the property:vectors are used where the
cardinality of the property is exactly one, for example$id, as each term has exactly one
ID, andlists otherwise. This enables properties of individual terms or sets of terms to be
looked up in theontology_indexusing base R functions, in a way which is identical to
usingdata.frames, which are widely used amongst R users. Theget_ontologyfunction
is used to read ontologies into R. By default, only the minimal properties used by the
main functions in the package are read in from a given OBO file. These are theid,name,
parents,childrenandancestors properties (the latter two derived from theparents field). However, all properties which are present in the file can be read by passing the
argumentextract_tags="everything"toget_ontology. Although theancestorsslot
depends on theparentsslot, storing the ancestors of each term enables considerable
speed-up of ontological operations that depend on term ancestry, such as collecting the full set of ancestors or descendants for a set of terms (see Table 2.1). Ontologies are usually ‘wide’ in the sense that the average number of child terms is relatively high compared to the average number of parent terms and therefore the additional memory required to store the ancestor terms for each term is relatively low. For example, the average number of child terms per
term with children in the HPO is 3.72 whilst the average number of parent terms for terms
2.1 ontologyX 25 Original set Abnormality of the nervous system Abnormality of the skeletal system Autosomal dominant inheritance Phenotypic abnormality All
intersection_with_descendants of 'Phenotypic abnormality'
Abnormality of the nervous system Abnormality of the skeletal system Autosomal dominant inheritance Phenotypic abnormality All
exclude_descendants of 'Phenotypic abnormality'
Abnormality of the nervous system Abnormality of the skeletal system Autosomal dominant inheritance Phenotypic abnormality All
prune_descendants of 'Phenotypic abnormality'
Abnormality of the nervous system Abnormality of the skeletal system Autosomal dominant inheritance Phenotypic abnormality All
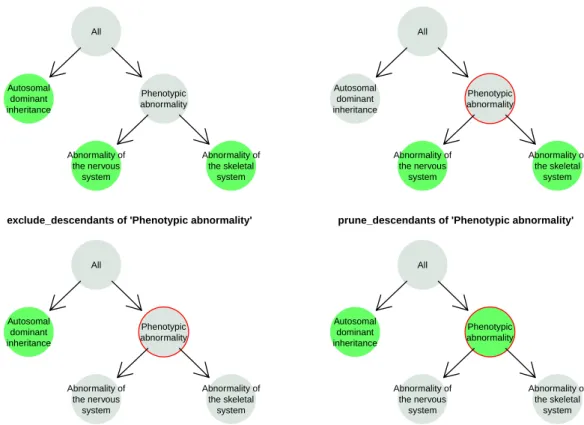
Fig. 2.1 Visualisation of ontological set operations in ontologyIndex. In this diagram, the set of terms ‘Autosomal dominant inheritance’, ‘Abnormality of the nervous system’ and ‘Abnormality of the skeletal system’ — coloured green in the top left panel — are subsetted in three different ways with respect to a given root term (here ‘Phenotypic abnormality’, highlighted with a red circle). The remaining terms after applying the operations are shown in the other three panels labelled by the corresponding operation name.
ontologyIndex uses native R types to represent ontological terms and sets of terms (i.e.
charactervectors of term IDs), enabling simple integration with R’s features, high-level functions, and other packages. It includes functions for performing set operations respecting
the structure of the ontology, for example: exclude_descendants, which given term setsA
andB, excludes terms inBand their descendants from setA;prune_descendants, which
preserves terms inBthat are ancestors of terms inAafter applyingexclude_descendants),
andminimal_set, which maps a set of ontological terms onto a non-redundant set. Figure 2.1 depicts example outcomes of applying ontologyIndex functions.
ontologyIndex is lightweight, fast, and readily extended by other packages. For exam-ple, my R package gsEasy [36] facilitates gene-set enrichment analysis [110] using the
26 Methods for ontological data and applications Table 2.1 Mean execution time for retrieving descendants and ancestors for individual terms in the Human Phenotype Ontology.
Descendants (ms) Ancestors (ms)
ontoCAT 11.99 12.75
ontologyIndex 0.38 0.14
gsEasy
Gene Set Enrichment Analysis (GSEA) is a procedure for assessing whether a given set of genes is over-represented within the highest ranks of a larger containing set of genes with
respect to a given gene scoring, e.g. the log fold change in expression.p-values are calculated
based on an ‘enrichment score’ (ES), representing over-representation of the given set of
genes, by comparing it to the null distribution of the score derived by permutation. ESis
obtained by computing the maximum value ofPhit−Pmiss, defined as:
Phit(S,i) =
∑
j∈S,j≤i |rj|p NR , whereNR=∑
gj∈S |rj|p Pmiss(S,i) =∑
gj∈/S,j≤i 1 N− |S|, ES(S) =max i Phit(S,i)−Pmiss(S,i),whereriis a score for the gene with theithhighest score amongst all includedNgenes,Sis
the set of ranks for the genes in the test set, andpis a fixed constant which powers the scores.
In spite of its conceptual simplicity, its considerable popularity (the introductory paper,
Subramanian et al. [110], has been cited over 11,000 times), and the ubiquity of R amongst
bioinformaticians, it has been difficult to perform in R because of the absence of simple functions which execute rapidly and difficulty in defining gene sets corresponding to GO annotation. gsEasy [36] is a software package which I developed in order to make GSEA straightforward, flexible and fast in R. It extends functionality in the ontologyIndex package in order to derive sets of genes which are annotated with particular ontological terms. Use of native R types as parameters, independence from external databases and implementation in C++ facilitates simple, effective application across large numbers of gene sets using R’s high level functions.
It has a function, gset for calculating p-values based on ES, employing the same

![Fig. 2.3 Heatmap of the relative frequencies of HPO terms related to bleeding and platelet abnormalities annotating patients with abnormalities affecting other organ systems for 707 BPD index cases [119]](https://thumb-us.123doks.com/thumbv2/123dok_us/11045572.2991832/48.892.112.763.368.702/heatmap-relative-frequencies-bleeding-abnormalities-annotating-abnormalities-affecting.webp)


