- 1 -
“Using liver miRNA
profiles to predict
chemical
hepatocarcinogenesis”
By
Costas Koufaris
A thesis submitted to Imperial College
London for the degree of Doctor of
Philosophy
Department of Surgery and Cancer
Biomolecular Medicine
Imperial College London
April 2011
- 2 -
Industrial, agricultural, and pharmaceutical requirements drive the development of a plethora of new chemical entities each year, many of which -for example drugs, pesticides, and food additives- have to be assessed for potential human health hazard. The current benchmark for risk assessement is the lifetime rodent bioassay which is expensive, time-consuming, laborious, requires the sacrifice of numerous animals, and is often irrelevant to humans. Hence alternative strategies to the rodent lifetime bioassay for prediction of chemical carcinogens are being pursued, especially for the liver which is an organ frequently affected by exogenous chemicals due to its detoxifying and metabolic roles. Numerous studies in recent years support the important role of microRNAs in cancer development, including hepatocellular carcinoma. The principal hypothesis of this project was that hepatic microRNA signatures can contribute to the earlier prediction of chemical hepatocarcinogens. Examination of livers from male Fischer rats treated with six chemical hepatocarcinogens, with diverse mode of actions for 90 days revealed that all the tested hepatocarcinogens affected the liver miRNAome from that early stage. Interestingly, a small set of microRNAs were identified whose expression was frequently deregulated by the hepatocarcinogens. Bioinformatic analysis indicates that these microRNAs can regulate pathways which are important in hepatocellular carcinoma. A more detailed investigation of one of those hepatocarcinogens, phenobarbital, showed that its effects on liver microRNAs were both dose and time dependent, with a progressive induction of specific microRNA clusters.Thus this study was the first to investigate in depth the effects of chemical hepatocarcinogens on the liver miRNAome and supports the potential usefulness of hepatic microRNA signatures in risk assessment.
- 3 -
I affirm that all the work presented in this thesis is my own original work,
unless otherwise stated. Where the work of others has been used, it has
been dully acknowledged.
Costas Koufaris
April 2011
- 4 -
“
Σα βγεις ζηον πηγαιμό για ηην Ιθάκη,
να εύχεζαι νάναι μακρύς ο δρόμος,
γεμάηος περιπέηειες, γεμάηος γνώζεις…
”
”
As you set out on the way to Ithaca,
wish that the road is a long one,
full of adventures, full of knowledge...
”
- 5 -
To my parents
Acknowledgments
Like Odysseus’s voyage to Ithaca, the road to completing a PhD can be a long one, but also full of adventures and knowledge. First I would like to express my gratitude to my supervisor, Professor Nigel J. Gooderham, without whom I may never have set out on this journey. Throughout the last three and a half years he has always been available to offer his advice and guidance. I would particularly want to thank him for instilling in me the confidence that is required for pursuing a PhD. I have thoroughly enjoyed and I am proud to have been his student and a member of his lab. I would also like to acknowledge Dr. Jayne Wright and Dr.Richard A. Currie for their great effort, assistance, and encouragement. This project would have been much weaker without their help. I am also thankful to the BBSRC for funding my PhD.
I have also greatly appreciated all the assistance, advice, encouragement, and companionship that I have received from the various members of my lab during my PhD: Mihalis Papaioannou, Corrinne Segal, Reshat Reshat, Qianxin Wu, Nurul Huda Abd Karim, Kuan-wei Chen, Dr. William Edmands, Dr. Rhiannon David, and Dr. Nor Aini Saidin. Also my gratitude to R.F. for being a source of inspiration. I sincerely wish them all the best in the future. I also appreciate the numerous other people (staff and students) who have aided me in various circumstances. Last but not least, I am grateful to Vicky for being my safe harbour, my guiding star, and a gentle breeze driving me on during this journey.
- 6 -
List of Figures
………..……..…12
List of Tables
………..…16
List of abbreviations
………... 19
Chapter 1- Introduction
………..
23
1.1 Mechanisms of carcinogenesis……….…….23
1.1.1 Carcinogenesis is a multi-step, progressive process………….…..…...24
1.1.2 Genetic and epigenetic mechanisms of gene disruption in cancer…….30
1.1.3 Mechanisms of carcinogenesis by exogenous chemicals…………...…34
1.2 MicroRNAs have important roles in cancer………...42
1.2.1 Non-coding RNAs are conserved in eukaryotes………...42
1.2.2 Biogenesis and function of mature miRNAs…….……….43
1.2.3 MicroRNAs in cancer: small but deadly………49
1.3. Liver is a frequent target of chemical carcinogens ………..….53
1.3.1. Liver architecture and function………..……53
1.3.2. Aetiology, types, and frequencies of liver cancers………57
1.3.3 Phenobarbital is a prototype of non-genotoxic hepatocarcinogens…....61
1.3.4 Involvement of miRNAs in hepatocellular carcinomas ……...…….….68
1.4. Cancer risk assessment strategies………..70
- 7 -
1.5 Justification, hypothesis, and objectives………...……75
Chapter 2- Materials and Methods
………...…..…
78
2.1 Chemicals and reagents used………...…………..….79
2.2 Animal studies………...…...…..80
2.2.1 Tested compounds ………....….…80
2.2.2 Design of animal studies………...…81
2.3 MicroRNA microarrays……….…….84
2.3.1 RNA extraction……….…..84
2.3.2 Assessment of RNA quantity, purity and integrity……….……85
2.3.3 RNA labelling, hybridisation, and scanning………...…….86
2.3.4 Pre-processing and normalisation of miRNA microarray data…...…89
2.4 Polymerase chain reaction (PCR)………...91
2.4.1 Real-time Quantitative PCR (qPCR)……… ………...…91
2.4.2 Semi-quantitative PCR………...93
2.5 Immunoblotting……….…….95
2.5.1 Protein extraction from liver samples ...…………...…95
2.5.2 Protein detection and quantification………...….…..….96
2.6 Methylation analysis………...….…..….97
2.6.1 DNA extraction and quantification………...…..97
- 8 -
2.8
In silico
analysis……… ...…………..100
2.9 Clustering and classification of samples………..………….101
2.9.1 Hierarchical clustering………...…….101
2.9.2 Sample classification………...102
2.10 Statistical analysis………....…102
Chapter 3-Effects of 90 day treatment with various
...103hepatocarcinogenic and non-hepatocarcinogenic
compounds on the liver microRNAome
3.1. Introduction...……….………...………104
3.2. Effects of chemical treatments on animals..…………...………107
3.3. Evaluation of quality and processing of microarray data...110
3.3.1 PCA and Quality Control metrics of samples...110
3.3.2 Filtering of miRNA data...114
3.3.3. Comparison of microarray technical replicates...117
3.4 Deregulation of hepatic miRNAs by hepatocarcinogens...119
3.4.1 MiRNA profiles are distinct for carcinogen-treated livers...119
3.4.2 Identification of possible miRNA biomarkers of carcinogenicity...124
3.4.3 MiRNA profiles are associated with the MOA of chemicals...133
- 9 -
3.5 Chemical-specific miRNA profiles...137
3.5.1 PB-type compounds have characteristic miRNA profiles...137
3.5.2. Effects of genotoxic 2-AAF on microRNAs...140
3.5.3 DEHP shows some similarities to PB-type compounds...143
3.5.4. MiRNA profiles of MP HCL, MON, and Chl.Ac...145
3.6 qPCR validation of miRNA changes...146
3.7 Discussion...147
Chapter 4- Hepatic microRNA profiling of rats
...152treated with dietary phenobarbital
4.1 Introduction...153
4.2 Effects of chemical treatments on animals... 155
4.3 Quality control of microarray data...158
4.4 Clustering Analysis of samples...164
4.5 Identifying differentially expressed miRNAs...171
4.5.1 MiRNAs deregulated by mitogenic PB doses...171
4.5.2 MiRNAs deregulated by carcinogenic 1000 ppm PB dose...174
4.5.3 Progressive induction of miR-200b and miR-96 from 14 to 90 days..178
4.6 Correlations of miR-200b and miR-96 with hepatic parameters...180
4.7 qPCR validation of observed changes...181
- 10 -
Chapter 5- Causes and consequences of
...189chemical-treatment induced miRNA deregulation
5.1 Introduction...190
5.2. Analysis of miRNA promoters...194
5.2.1 Identification of CpG islands within the promoters of miRNAs...194
5.2.2 P53 binding sites are located in the promoter of miR-34a...195
5.2.3 Analysis of miR-200a/200b/429 cluster proximal promoter...196
5.2.4 Examination of genomic region upstream of miR-96/182...200
5.3 Consequences of miRNA deregulation...206
5.3.1 Correlation between miR-29b and global DNA Methylation...206
5.3.2 Effect of miR-200a/200b/429 dose-dependent induction on the...209
expression of zeb1/zeb2 and epithelial markers 5.3.3 Pathways enriched for predicted gene targets of biomarker miRNAs.214 5.3.4 Synergistic activities of PB-induced miRNAs...217
5.4 Discussion...222
Chapter 6- Discussion
...2306.1 MiRNA signatures are a promising approach to facilitate...231
chemical risk assessment
6.2 MiRNA deregulations in the pre-neoplastic liver treated with...233
hepatocarcinogens: Extraneous, adaptive or adverse?
- 11 -
6.4 Conclusions: Opening the black box...243
References
...245APPENDICES... ...304
Appendix I: Table S.1...305
Appendix II: Table S.2...307
Appendix III: Significantly over-represented pathways for...309
“biomarker” miRNAs Appendix IV: Conference Abstracts...317
- 12 -
Figure Title Page
1.1 Clonal evolution of cancer cells 26
1.2 MicroRNA biogenesis in mammals 46
1.3 Proposed mechanisms of microRNA-induced silencing of target genes 48
1.4 Architecture of hepatic lobules 54
1.5 Flow of substances through the liver 55
1.6 Cellular origins of liver cancers induced by carcinogens 60
1.7 Phenobarbital drives CAR to the nucleus 63
2.1 Chemicals used in animal studies 81
2.2 Design of 90 day multiple compound study 82
2.3 Design of 14 day PB dietary study 83
2.4 Example of evaluation of sample RNA integrity 86
2.5 Typical image of a microRNA microarray 88
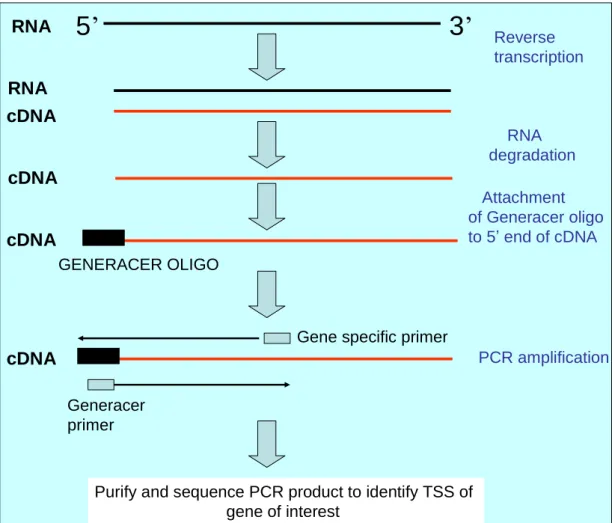
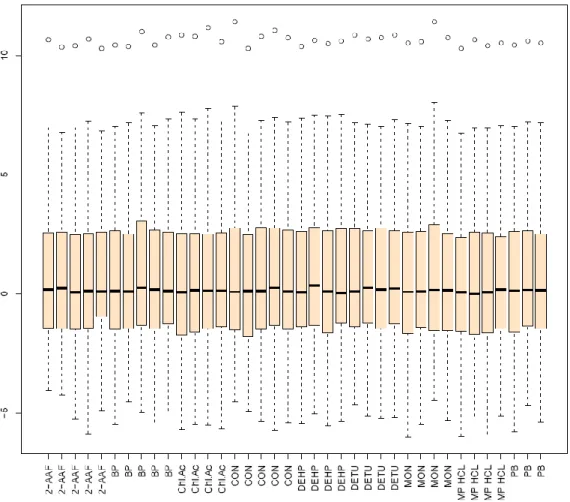
2.6 Comparison of normalisation methods on microRNA microarrays 90 2.7 Overview of the methodology of the Generacer kit 99 3.1 PCA of pre-filtered normalised samples from 90 day dietary study 111 3.2 Box plots of normalised and filtered microarray samples 115 3.3 Comparison of microRNA profiles for two sets of technical replicates 118 3.4 Volcano plot of liver microRNAs from carcinogen Vs. untreated 119
animals
3.5 PAM misclassification with decreasing number of microRNAs 121 3.6 Chromosomal organisation of the miR-200a/200b/429 and 128 miR-96/182/183 microRNAs in the rat
- 13 -
Figure Title Page
3.7 Correlated expression of clustered microRNAs miR-200a/200b/429 129 and miR-96/182
3.8 Clustering analysis of control and treated liver samples at 90 days 133 3.9 Comparison of chemical effects on mRNAs and microRNAs at 90 days 135 3.10 Effects of chemical treatments on the expression of miR-200a/200b/429 137 at 90 days
3.11 Effects of chemical treatments on the expression of miR-96/182 138 at 90 days
3.12 Expression of selected microRNAs in two sets of technical replicates 139 3.13 Effects of chemical treatments on the expression of miR-34a at 90 days 141 3.14 Effects of chemical treatments on the expression of miR-99a and 142 miR-203 at 90 days
3.15 Correlation of miR-200b and miR-96 at 90 days 144 3.16 Effects of chemical treatments on the expression of miR-193 at 90 days 145 3.17 Correlation of microRNA fold changes calculated by qPCR 146
and microarrays
4.1 Box plots for normalised, filtered microarray samples for 14 day 163 phenobarbital study
4.2 Clustering analysis of samples for 14 day phenobarbital study 165 4.3 Clustering analysis of samples at individual timepoints of 14 day 166
phenobarbital study
- 14 -
Figure Title Page
4.5 Correlation of miR-200a with miR-200b across 14 day phenobarbital 169 study
4.6 Correlation of miR-200a with miR-200b across 14 day phenobarbital 170 study
4.7 Common effects of mitogenic phenobarbital doses on microRNAs 171 4.8 Fold Changes in expression of miR-199a-3p and miR-221 across doses 173
and time
4.9 Specific effects of a carcinogenic phenobarbital dose on microRNAs 175 4.10 Effect of phenobarbital doses on expression of miR-29b at 14 days 176 4.11 Dose dependent effect of phenobarbital on miR-200b and miR-96 177 4.12 Progressive induction of miR-200a and miR-200b with 1000 ppm 179
phenobarbital treatment
4.13 Progressive induction of miR-96 with 1000 ppm phenobarbital treatment 180
4.14 qPCR analysis of miR-200b in 14 day PB study 182
4.15 Correlation of microRNA fold changes calculated by qPCR and 183 microarrays for miR-200b
4.16 Proposed model for metabolic regulation of gluconeogenesis by CAR 188 activators
5.1 Negative feedback loop regulating the expression of the 197 miR-200a/200b/429 cluster and the ZEB1/ZEB2 transcription factors
5.2 RT- PCR amplification upstream of miR-96 201 5.3 PCR amplification of positive control for Generacer 203
- 15 -
Figure Title Page
5.4 RT-PCR amplification of complementrary strand to miR-96 205 5.5 Expression of hepatic miR-29b in control and 1000 ppm PB-treated 206 animals after 7, 14, and 90 days
5.6 Standard curve for Methylamp kit 207
5.7 Global DNA methylation in 1000 ppm PB-treated samples at 208 days 7, 14, and 90
5.8 Immunoblotting of zeb1, zeb2, and b-actin in control and Phenobarbital 209 treated samples at 14 days
5.9 Quantification of zeb1 and zeb2 proteins in livers treated with 210 phenobarbital doses for 14 days
5.10 PCR amplification of cyp2b1/2, cdh1, and gapdh in control and 212 phenobarbital-treated samples at 90 days
5.11 Quantification of E-cadherin and cyp2b1/2 genes in livers treated with 213 1000 ppm phenobarbital at 90 days
5.12 Predicted targets of the miR-200a/200b/429 and miR-96/182 cluster 228 found in EGF signalling pathway
- 16 -
Table Title Page
1.1 Postulated mechanisms of chemical carcinogens 35
1.2 Examples of microRNAs implicated in cancer 49
1.3 Alternative methods to the two-year rodent assay 72 2.1 Primer sequences used for semi-quantitative PCR 93 2.2 Concentrations of primary/secondary antibodies used for immunoblotting 96 3.1 Frequency of liver tumours in two-year bioassay in male Fischer rat 107 3.2 Liver weight adjusted to bodyweight for each treatment 108 3.3 Percentage of Ki67-labelled hepatic cells for each treatment groups 108
3.4 Liver micropathology 109
3.5 QC metrics for controls and non-carcinogen treated samples 112
3.6 QC metrics for carcinogen-treated samples 113
3.7 Top 20 abundantly expressed miRNAs in untreated rat liver 116 3.8 Differentially expressed liver microRNAs between carcinogen-treated 120
untreated treated animals
3.9 Performance of PAM classifier during cross-validation 122
3.10 PAM identified microRNA signature 123
3.11 Differentially expressed microRNAs at 90 days after chemical treatement 125 3.12 MicroRNAs differentially expressed from control for each chemical 126
treatment at 90 days
3.13 Set of potential biomarker microRNAs 127
3.14 Sensitivity and specificity of “biomarker” microRNAs 130 3.15 Reported deregulation of identified microRNA biomarkers in cancers 131
- 17 -
Table Title Page
3.16 Reported hepatocarcinogenic treatments affecting identified biomarker 132 microRNAs
3.17 Correlation of biomarker miRNAs with hepatic prameters 136 3.18 Comparison of reported effects of 2-AAF on liver microRNAs 140
4.1 Microsomal PROD activity 155
4.2 Effect of phenobarbital on relative liver weight 155
4.3 Incidence of centrilobular hypertrophy 156
4.4 Ki67 hepatic labelling index 156
4.5 Incidence of apoptotic bodies 156
4.6 Quality control of day 1 microarray samples 158
4.7 Quality control of day 3 microarray samples 159
4.8 Quality control of day 7 microarray samples 160
4.9 Quality control of day 14 microarray samples 161
4.10 Changes in expression of selected microRNAs involved in proliferation 174 4.11 Comparison of effects of phenobarbital at 14 and 90 days 178 4.12 Correlation between CAR-induced microRNAs and liver parameters 181 5.1 CpG islands in the promoters of “biomarker” miRNAs 195 5.2 Putative hnf4α a binding sites up to 5000 bases upstream of rat miR-200b 199 5.3 Putative c-myc and CAR/RXR binding sites upstream of miR-200b 200 5.4 Selected binding motifs in CpG islands upstream of miR-96 202
5.5 Mature sequence of biomarker microRNAs 214
- 18 -
Table Title Page
5.7 Predicted gene targets of phenobarbital-induced microRNAs in the 218 PI3K pathway
5.8 Predicted gene target of phenobarbital-induced microRNAs in the 219 TGF-beta pathway
5.9 Predicted gene target of phenobarbital-induced microRNAs in the 220 Ras pathway
5.10 Predicted gene target of phenobarbital-induced microRNAs in the 221 EGF pathway
S.1 Expression of all detected miRNAs in control male Fischer rats 305 S.2 Differentially expressed microRNAs at 90 days treatment 307 S.3 Significantly enriched pathways for rno-miR-200a 309 S.4 Significantly enriched pathways for rno-miR-200b/429 310 S.5 Significantly enriched pathways for rno-miR-96 311 S.6 Significantly enriched pathways for rno-miR-182 312 S.7 Significantly enriched pathways for rno-miR-34a 313 S.8 Significantly enriched pathways for rno-miR-193 314 S.9 Significantly enriched pathways for rno-miR-203 315 S.10 Significantly enriched pathways for rno-miR-99a 316
- 19 -
Abbreviation Meaning
2-AAF 2-Acetyl aminofluorene
AHF Altered Hepatic Foci ANOVA Analysis of Variance
BP Benzophenone
CAR Constitutive androstane receptor
Chl. Ac Chlorendic Acid
CTR Control technical replicates
Cy-3 Cyanine 3-pCp
CYP Cytochrome P450
CYP2B cytochrome 450 type 2b
DEHP Diethylhexylphthalate
DEN Diethylnitrosamine
DETU Diethylthiourea
DGCR8 DiGeorge Syndrome Critical Region 8
DNMT DNA methyltransferase
dNTP Deoxyribonucleotide triphosphate
EDTA Ethylenediaminetetraacetic acid EMT Epithelial to mesenchymal transition
EGF Epidermal growth factor
FDR False Detection Rate
FE Feature extraction
FIG Figurre
- 20 -
Abbreviation Meaning
GJIC Gap junctional intercellular communication
GNTX Genotoxic
HCC Hepatocellular carcinoma
HNF4α Hepatic nuclear factor-4 alpha
HSCs Hepatic stellate cells
KC Kupffer cells
LI Labelling Index
MTD Maximum Tolerated dose
mRNA Messenger RNA
MP HCL Methapyrilene HCl
miRNA microRNA
MOA Mode of Action
MON Monuron
NGTX Non-genotoxic
NOAEL No observable adverse effect level
NTP National Toxicology Program
NK Natural killers
PAGE Polyacrylamide gel electrophoresis PAM Prediction Analysis of Microarrays
PB Phenobarbital
PBS Phosphate buffered saline
PCR Polymerase Chain Reaction
- 21 -
Abbreviation Meaning
PPARα Peroxisome proliferator activated receptor alpha
PPC Peroxisome proliferator compounds
ppm Part per million
pre-miRNA Precursor microRNA
pri-miRNA Primary-microRNA
PCA Principal Component Analysis
PTR Phenobarbital technical replicates
PXR Pregnane X receptor
QC Quality Control
qPCR Quantitative PCR
RIN RNA integrity number
RLM RNA ligation mediated
RACE Rapid Amplification of cDNA Ends
Rb Retinblastoma
ROS Reactive oxygen species
RNS Reactive nitrogen species.
RISC RNA activated silencing complex
SAM Significance analysis of microarrays
SDS Sodium dodecyl sulfate
SEC Sinusoidal endothelial cells
SiRNA Small interfering RNA
TAE Tris-Acetate-EDTA
- 22 -
Abbreviation Meaning
TCDD 2,3,7,8-Tetrachlorodibenzo-p-dioxin
TE Tris- EDTA
TGF Transforming growth factor
TSS Transcriptional start site
UTR Untranslated region
Zeb1 Zinc finger E-box-binding homeobox 1
Zeb2 Zinc finger E-box-binding homeobox 2
- 23 -
- 24 -
1.1 Mechanisms of carcinogenesis
1.1.1 Carcinogenesis is a multi-step, progressive process
The term cancer describes more than 100 types of the disease with distinct cellular origins, symptoms, prognosis, and treatments. Nevertheless, all cancer cells are fundamentally different in their cellular physiology from normal cells. Hanahan and Weinberg initially identified six key hallmarks which are common to cancer cells (Hanahan & Weinberg, 2000, Hanahan & Weinberg, 2011):
(1) Self-sufficiency in growth signals. All normal cells require stimulation by extra-cellular growth factors to initiate cell division. A necessary step for carcinogenesis is the acquired ability of pre-malignant and malignant cells to undergo abnormal, excessive proliferation in the absence of the appropriate mitogenic signals.
(2) Insensitivity to anti-growth signals. Tissues abound with anti-proliferative signals which maintain tissue homeostasis by suppressing proliferation. Incipient cancer cells acquire the ability to proliferate even in the presence of such growth-suppressive signals.
(3) Evasion of apoptosis. Apoptosis is the instigation of a program of cell death in a cell, when given the appropriate internal or external stimuli. Cancer cells are characterized by a resistance to the external and internal stimuli which normally stimulate apoptosis.
(4) Limitless replicative potential. Normal cells can only replicate a limited number of times before reaching the Hayflick limit and entering a state of senescence. The
- 25 -
appearance of tumours requires the acquisition by cancer cells of the ability for unlimited replication.
(5) Sustained angiogenesis. As tumours grow in size existing capillaries are not sufficient to supply the oxygen and nutrients needed by the growing tumour. In response to this problem cells within lesions of abnormal growth acquire the ability to trigger angiogenesis, thus increasing the supply of required substances.
(6) Tissue invasion and metastasis. Aberrantly proliferating cells may not be harmful so long as they are contained. These are benign tumours. Eventually a fraction of the benign tumours will progress to become invasive (malignant) cancers which possess the ability to invade adjacent tissues. Invasive cancer cells can eventually become metastatic and invade other organs through the lymphatic system.
Besides these six essential hallmarks, two other acquired biological capabilities of cancer cells that may be essential for the development of tumours are the abilities to evade the immune system and to limit their metabolism to glycolysis (Hanahan & Weinberg, 2011).
Given the detrimental effects of cancers, long-lived animals such as mammals possess multiple safeguards to prevent their occurrence. Therefore no single factor can cause cancer. Rather, the development of all cancers requires multiple independent events (Hanahan & Weinberg, 2001, Vogelstein & Kinzler, 2004). Simultaneous occurrence of these multiple changes needed for the transformation of a specific cell from a normal to a transformed state is too improbable to occur. Instead cancers probably
- 26 -
originate in a process comparable to Darwinian evolution, whereby cancer cells gradually develop from a single original cell in a series of distinct steps (Figure 1.1).
Figure 1.1 Clonal evolution of cancer cells
Cancer initiation
Clonal expansion
Normal cells
Cancer progression
Benign cancer
Invasive (malignant) cancer
Months-years
in rodents
Decades in
humans
Cancer progression
Fig. 1.1 Cancer is initiated after acquisition by a cell (usually an epithelial type) of a selective advantage (Cancer initiation). This pre-cancerous cell then undergoes clonal expansion. During cancer progression the initiated cell is transformed to a benign and then a malignant cancer cell through repeated acquisition of new traits followed by clonal expansion. The tumour is heterogeneous made up from subclones originating from the parental cancer cell. The process can take years in rodents and decades in humans.
- 27 -
Initiation of cancer occurs with the acquisition by a replication-competent cell of a selective advantage compared to normal cells e.g. an increased rate of cell division. Consequently clones of this altered cell will outcompete normal cells and become more abundant in their resident tissue. Progression of the initiated cell to more cancerous states occurs through repetitive rounds of this evolutionary process: acquisition by descendants of the original cell of new selective advantages followed by clonal expansion. Eventually this iterative process results in the generation of full-blown malignant cancer (Nowell, 1976). Multiple facts support this multi-step model of carcinogenesis. First, within tissues lesions represent intermediate steps from normal to pre-malignant to invasive cancers. Second, mathematical models of cancer incidence throughout a human lifetime suggest that at least 4-7 events are required for cancer development. Third, transformation of cells in vitro to a cancer state requires altered activity of multiple genes. Fourth, germline mutations cause a predisposition to cancer, not definite cancer appearance. Fifth, transgenic mouse models also support the requirement for multiple steps before the appearance of tumours (Hanahan & Weinberg, 2000).
Cancer initiation and progression is driven by deregulation of cancer genes. Most mammalian genes are irrelevant for cancer. Cancer genes are the small subset of animal genes which drive tumour formation and growth. So far about 400 cancer genes have been identified (Stratton et al., 2009, Futreal et al., 2004). In normal cells most of these cancer genes are part of the normal cellular regulatory networks controlling cell division, apoptosis, and homeostasis(Hanahan & Weinberg, 2000). Cancer genes are classified into two categories based on the functional effects of their deregulation: oncogenes and tumour-suppressor genes. Oncogenes are inappropriately activated in cancers in order to facilitate tumour growth. Usually inappropriate
- 28 -
activation of a single allele of an oncogene is sufficient to confer a selective advantage to a cell. For example activated Ras may stimulate cell proliferation while activated MDM2 inhibits cell death of tumour cells (Croce, 2008). Conversely for tumour-suppressors genes it is the loss of their activity which contributes to the progression of the disease. For tumour-suppressor genes it is normally required that both alleles are inactivated in a cancer cell for the effect to be observable. Two tumour suppressor genes that are frequently inactivated in tumours are p53 and retinoblastoma (Rb). Loss of P53 makes cancer cells more resistant to apoptosis while loss of Rb allows cells to be more resistant to anti-growth signals (Sherr, 2004). Ultimately cancer genes contribute to tumour development via the cellular pathways, which they control. Inappropriate activation of oncogenes and/or loss of tumour-suppressor genes results in deregulation of key pathways and acquisition of the cellular traits essential to cancer development. Several such pathways have been demonstrated to be implicated with cancer, including the Rb, P53, PI3K, APC, HIF1, Gli, and Smad pathways (Vogelstein & Kinzler, 2004). Since cellular pathways consist of many genes, they can be disrupted by the deregulation of any one of several cancer genes. For example the Rb pathway can be blocked either by inactivation of Rb and p16INK4 or activation of CDK4 and Cyclin D1. Indeed deregulation of all these four genes has been found in multiple cancers and appears to follow an “exclusivity principle” (Vogelstein & Kinzler, 2004).
“Gatekeeper” pathways are those that when disrupted within the appropriate cell initiate tumourigenesis. The gatekeeper pathways are different between tissues e.g. the Rb1 is a gatekeeper for retinoblastoma, but in colon cancer that role is performed by the APC pathway. For many tissues the gatekeeper pathway is not known. It is still
- 29 -
not clear whether some tissues may have multiple gatekeeper pathways or just one(Vogelstein & Kinzler, 2004).
Besides the different gatekeeper pathways, the process of carcinogenesis is variable between different cell types in other ways as well. For example, it has been found that mutations of the same cancer genes can occur at different stages of cancer development in different tissues. Consequently the timing of carcinogenic traits associated with those cancer genes also differs between cancers e.g. one tumour type may acquire resistance to apoptosis at a much earlier stage than other tumour types. Furthermore, cancer genes can have distinct effects in different cellular contexts. Activation of KRAS2 initiates the neoplastic process in pancreatic duct, but not in other tissues. Hence, a given cancer gene may be implicated in some tumour types, but not others (Hanahan & Weinberg, 2000, Vogelstein & Kinzler, 2004).
The molecular processes underlying carcinogenesis also seem to be partially different between liquid tumours (e.g. leukaemia) and solid tumours (e.g. liver cancer). Solid tumours appear to require several mutations in order to develop malignant tumours, while liquid tumours perhaps only need one or two. Moreover, for liquid tumours chromosomal translocations that activate oncogenes are much more common than for solid tumours. It is probable then that the genesis of liquid tumours may follow quite different pathways from that of solid tumours(Vogelstein & Kinzler, 2004).
- 30 -
1.1.2 Genetic and epigenetic mechanisms of gene disruption in cancer
All normal somatic cells of an individual contain copies of the same genome. By some manner the functioning of cancer genes and of the pathways which they control must be disrupted in cancer cells for tumours to form. Two fundamentally different mechanisms exist by which this can occur: genetic mutations and epigenetic defects. Genetic mutations permanently modify genes by altering their DNA sequence. In cancer genetic mutations activate oncogenes and deactivate tumour suppressor genes. Occasionally mutated cancer genes are germ-cell transmitted and underlie the predisposition of related individuals to familiar cancers (e.g. BRCA1 to breast cancer and Rb1 to retinoblastomas) (Vogelstein & Kinzler, 2004). In most cases though, cancer genes are disrupted within the somatic cells of individuals. The recent deployment of the powerful DNA sequencing technologies to the sequencing of tumour genomes has confirmed the wide-spread occurrence of somatic mutations in cancer genes. One study sequenced a malignant melanoma cell and a lymphoblastoid cell line (representing germline DNA) originating form the same individual (Pleasance et al., 2010a). They identified more than 30000 somatic base substitutions in the melanoma, affecting 292 coding genes and 319 non-coding genes. A second study used the same approach for a small-cell lung carcinoma cell line and a lymphoblastoid cell line derived from a different patient (Pleasance et al., 2010b). They identified more than 22000 somatic mutations including 134 in coding genes and 182 in non-coding genes. It is expected that the mutated genes in these cancers represent both “passengers” as well as “drivers” i.e. mutations that are by-products of carcinogenesis, as well as those which were crucial to the formation of the tumour. Gene mutations can be subtle or prominent. Subtle mutations include changes of a single nucleotide base (point mutations) or small insertions and deletions within a- 31 -
gene. Missense mutations (change in a single nucleotide resulting in amino acid substitution) can affect normal functioning of a protein. One of the most commonly mutated genes in several cancer types is BRAF, resulting in stimulation of aberrant tumour growth. Oncogenic mutations for BRAF are missense mutations within its kinase domain that disrupt its molecular structure rendering it constitutively active (Wan et al., 2004). Nonsense mutations (change in a nucleotide causing a premature end in protein chain) and frameshift mutations (changes in reading frame) alter large parts of proteins. For example APC is a tumour suppressor gene that is often inactivated in cancers by nonsense and frameshift mutations (Samowitz et al., 2007). Alternatively, mutations in cancer can be much more prominent such as deletions of large chromosomal regions, translocations of genes to new locations, and copy number amplification. MDM2 is an oncogene that acts to repress apoptosis by tagging P53 for degradation and blocking its activation. In several cancers the gene for MDM2
is amplified so that several functional copies are present that can target P53(Oliner et al., 1992). Moreover, gross chromosomal abnormalities are found in all solid tumours. This results in loss of heterozygocity, with a large fraction of alleles being lost in cancer cells (Duesberg, 2003).
One interesting hypothesis is that acquisition by cancer cells of genetic instability -and hence increased mutation rate- is required to allow the acquisition of sufficient number of mutations for cancer appearance within a lifetime (Loeb, 1991). In favour of this “mutator phenotype” idea some hereditary cancer genes are involved in genetic instability, e.g. ATM and BRCA1 (Vogelstein & Kinzler, 2004). Many cancers also possess somatic mutations of genes that are involved in sensing DNA damage and in coordinating proper chromosomal segregation (Lengauer et al., 1997). The matter of whether genetic instability is a side-effect, a contributing factor, or absolutely
- 32 -
essential to the process of cancer formation is still being debated. Either way, whether sufficient mutations to cause cancer arise in a cancer cell as a result of the natural mutation rate or require the prior acquisition of a mutator phenotype, genetic mutations have an essential role in cancer.
Unlike genetic mutations, epigenetic mechanisms regulate the expression of genes in a mitotically heritable manner without affecting their DNA sequence. Epigenetic regulation of genes is fundamental for cell development, differentiation, and maintenance. For example hepatocytes and nerve cells express different genes even though their genomes are identical, due to differential epigenetic regulation. The basic units of chromosomes are nucleosomes, DNA wrapped around an octomer core of histone proteins. Gene expression is epigenetically regulated through alterations of this basic unit by methylation of DNA, covalent modification of histone, and non-covalent nucleosome repositioning and utilisation of histone variants (Berger, 2007). DNA methylation is the addition of methyl groups on cytosine residues found in CpG nucleotide duplets. In mammals CpG sites are disproportionally concentrated in the genome in regions called CpG islands, usually found close to the 5’ end of genes. A large fraction of human promoters contain CpG islands which can permanently silence gene transcription when methylated (Larsen et al., 1992). Various forms of covalent modifications of histones exist including acetylation, methylation, SUMOylation, ubiquitylation, and phosphorylation. Modifications of histone can either activate or repress associated genes according to the modification and type of residue affected. The positioning of nucleosomes affects the ability of transcription factors to bind to DNA and activate transcription (Jiang & Pugh, 2009). The presence of alternative histone variants in the nucleosome can also affect the rate of gene transcription (Santenard & Torres-Padilla, 2009).
- 33 -
Just as for genetic mutations, defects in the epigenome have been implicated in cancer (Feinberg, 2007, Jones & Baylin, 2007, Sharma et al., 2010). Cancer genomes are characterized by genome wide hypomethylation and hypermethylation of specific genes. Hypomethylation results in the activation of oncogenes, while hypermethylation results in silencing of tumour suppressor genes. For examples Rb is silenced in cancers by hypermethylation (Greger et al., 1989) while PAX2 expression is induced by tamoxifen in ovarian tissues stimulating proliferation and ovarian carcinogenesis by hypomethylation (Wu et al., 2005). Loss of global methylation can also contribute to carcinogenesis by causing genomic instability. Methylation is responsible for silencing repeated DNA sequences. Global loss of methylation for example results in activation of transposable elements which cause insertional mutations. Repetitive DNA sequences also promote recombination resulting in chromosomal aberrations and translocations (Wilson et al., 2007). Cancer cells also exhibit widespread changes in their histone acetylation and methylation patterns. Changes in the nucleosomal positioning in the promoters of genes have also been linked with inappropriate gene regulation in cancers. The SWI-SNF complex is an ATP-dependent chromatin remodeling complex made up of 8-11 components that regulate gene expression by modifying the nucleosome into a conformation that facilitates the initiation of transcription. This complex has an important role in the regulation of cell division and differentiation. Loss of several protein components of the SWI-SNF complex occur in cancer and are involved in the cancer process (Reisman et al., 2009).
To summarise, both genetic and epigenetic mechanisms are involved in deregulation of genes in cancers. In certain instances the two mechanisms are alternative methods
- 34 -
of deregulating cancer genes e.g. in colon cancer the APC gene is the gatekeeper that can be silenced either by genetic mutations or by hypermethylation. Examination of colorectal tumours reveals that the two processes are almost mutually exclusive, presumably because only one is needed to silence the gene (Esteller et al., 2000). In other cases though genetic and epigenetic processes can cooperate e.g. in some primary tumours one p16 allele is silenced by methylation while the other is lost by chromosomal deletion (Merlo et al., 1995). In certain cases epigenetic defects of a pathway in cancer predate the genetic mutations and it has been suggested that they may predispose cells to accumulate genetic mutations in the same pathways to drive tumour progression (Baylin & Ohm, 2006).
1.1.3 Mechanisms of carcinogenesis by exogenous chemicals
It has been recognised for a long time that cancers can have either endogenous or exogenous instigators. Cancers with endogenous origins are driven by the natural biochemical and metabolic cellular processes. Conversely, cancers with exogenous origins are induced by environmental agents that increase the incidence of tumours in their target organ(s). The relative contribution of endogenous and exogenous sources on the incidence of cancers in the human population has involved considerable debate (Shuker, 2002, Irigaray & Belpomme, 2010, Loeb & Harris, 2008). Ultimately, it can be deduced from the multi-stage progressive model of carcinogenesis that both endogenous and exogenous carcinogenic processes have to act by generating epigenetic and genetic defects in key pathways of incipient cancer cells. Endogenous sources of genetic mutations of cancer genes which arise spontaneously in cells are well understood and accepted. These include the depurination or deamination of DNA bases, the misincorporation of nucleotide bases during DNA replication, and damage
- 35 -
of DNA by metabolically generated reactive intermediates such as free radicals (Jackson & Loeb, 2001). At present the mechanisms which control and maintain the epigenetic status of cells are not well understood, hence it is not clear how they arise. Nevertheless, it is possible that spontaneous epigenetic errors may drive cancer initiation and maintenance (Wilson et al., 2007).
Besides the endogenous causes of cancer, hundreds of exogenous carcinogenic agents are currently known, including ionizing radiation, biological agents, and chemical substances. Chemical carcinogens are particularly worrisome due to the increased exposure of humans to compounds through the environment, workplace, and as medications. Therefore, a considerable effort has been invested into studying the mechanisms of chemical carcinogenesis. Various different mechanisms by which chemical carcinogens may induce cancers have been proposed (Irigaray & Belpomme, 2010, Butterworth et al., 1995, Williams, 2001, Silva Lima & Van der Laan, 2000, Bombail et al., 2004, Hernandez et al., 2009).
One commonly used classification of carcinogenic mechanisms is genotoxic (GNTX), also known as mutagenic and DNA-reactive, and the non-genotoxic (NGTX), also known as non-mutagenic and non-DNA reactive. GNTX compounds contain chemical groups, or are chemically modified to contain active chemical groups, which interact and damage DNA. The majority of GNTX carcinogens are procarcinogens which have to be converted first to DNA-reactive chemicals by metabolic processing. (Nebert & Dalton, 2006). On the other hand, NGTX mechanisms of carcinogenesis do not rely on direct damage of DNA. Instead NGTX carcinogens act by either
- 36 -
increasing indirectly the mutation rate in target cells or by facilitating the expansion of initiated cancer cells (Table 1.1).
Table 1.1 Postulated mechanisms of chemical carcinogens
Mechanism
Carcinogenic effects
Genotoxicity Reactive chemical groups interact with DNA directly to induce DNA mutations
NON-GENOTOXIC MECHANISMS
Stimulation of free radicals Free radicals can damage DNA to cause mutations; perturb intracellular signaling; cause cell death and
inflammation
Cytotoxicity Death of cells in target organs results in regenerative hyperplasia; inflammation
Immunosuppression Initiated cells can escape immune surveillance
Targeting of cell receptors Endocrine Modification; Mitogenic; anti-apoptotic; CYP450 activation
Altered epigenome Altered expression of oncogenes and tumour-suppressors; genetic instability
Inhibition of gap junctional
intercellular communication Loss of homeostatic communication between cells
The mechanisms of carcinogenesis described above are not mutually exclusive. Indeed most carcinogens affect more than one of these mechanisms. For example many NGTX carcinogens which are cell receptor agonists also inhibit gap junctional
- 37 -
intercellular communication (GJIC). GNTX mechanisms of carcinogenesis are intuitively the most straightforward to understand. An example of a GNTX carcinogen is 2-acetylaminofluorene (2-AAF). This chemical is not mutagenic per se, but is metabolically activated by the liver first to N-hydroxy-2-AAF and then to esterified derivatives such as acetoxy or sulfoxy moieties. These two metabolic products are strongly electrophilic and bind covalently to DNA. In vivo animal studies have shown 2-AAF to be a potent liver, bladder, and kidney carcinogen (Ogiso et al., 1985). Hundreds of GNTX carcinogens are known, including most recognised human carcinogens (Purchase, 1994). Each cell contains intricate machinery responsible for repairing damaged DNA. However some of the DNA adducts formed following GNTX exposure are incorrectly repaired during DNA replication, resulting in mutations. The increased mutation rate in cells exposed to GNTX carcinogens increases the probability of a detrimental mutation occurring within a cancer gene.
Evidence also exists that several GNTX compounds also possess epigenetic faculties which may be important in cancer development by facilitating the expansion of the initiated cells. Tamoxifen is a hepatocarcinogenic GNTX compound (Gamboa da Costa et al., 2001) which also induces global DNA hypomethylation, hypomethylation of repetitive sequences, and altered patterns of histone methylation (Tryndyak et al., 2007). Similarly 2-AAF exposure causes hypermethylation of the p16(INK4) gene in the liver, as well as global and long interspersed nucleotide element-1-associated histone H4 lysine 20 trimethylation (Bagnyukovay et al., 2008). 2-AAF also has anti-apoptotic propertied arising from blockage of the liver mitochondrial proapoptotic pathway from the early stages of carcinogenesis (Klohn et al., 2003).
- 38 -
NGTX carcinogens can also indirectly damage DNA damage and subsequently cause mutations through increased production of free radicals, i.e. reactive oxygen species (ROS) and reactive nitrogen species (RNS). During inflammation both ROS and RNS are produced by macrophages and other phagocyting cells. ROS can also be byproducts of metabolism of exogenous substances by CYP450s or of normal cellular metabolism. Multiple antioxidant and scavenging systems exist to remove ROS and RNS. Oxidative and nitrate stress occurs when these systems are unable to clear an excess of free radicals. High level of ROS and RNS can then damage DNA and other macromolecules or even cause cell death. In recent years it has also been found that the ROS and RNS also have physiological cellular signaling roles within cells. They can especially affect cell proliferation and apoptosis through the MAPK and NF-kappa pathways. Therefore this is an alternative way by which free radicals can affect carcinogenesis (Roberts et al., 2010).
A common mechanism of many NGTX carcinogens is the perturbation of normal cell physiology through inappropriate activation or repression of cellular receptors. These then result in the propagation of multiple cellular effects that facilitate cancer development. Several recognised human NGTX carcinogens affect cellular signalling by binding to receptors (e.g. 2,3,7,8-Tetrachlorodibenzo-p-dioxin (TCDD) binding the aryl hydrocarbon receptor; estrogenic compounds binding the estrogen receptor; progestins binding to the progesterone receptor). Several NGTX hepatocarcinogens are also known to target cellular receptors in the liver, for example 4-chloro-6-(2,3-xylidino)-pyrimidynylthioaceticacid (Wy-14,643) induced carcinogenicity requires activation of the peroxisome proliferator activated receptor alpha (PPARα) (Gonzalez
- 39 -
proliferation, inhibition of apoptosis, changes in the epigenome, induction of CYP450 enzymes, altered metabolism etc. The increased rate of proliferation may allow the generation of new mutations as the rate of spontaneous mutation is higher in replicating than in quiescent cells. Additionally, conversion of DNA adducts to mutations occurs when cells are stimulated to enter the cell cycle. The inhibition of apoptosis may allow the survival of cells carrying mutations that would stimulate apoptosis, so that they can survive and accumulate more mutations at subsequent stages. Induction of CYP450s is a mechanism by which ROS may be generated and result in DNA damage.
Another established mechanism of NGTX carcinogens is cytotoxicity followed by regenerative proliferation. Such chemicals cause cell death in their target organs and this is followed by proliferating of the remaining cells in order to restore the damaged organ. For cytotoxic chemicals the doses which cause cytolethality are closely associated with the carcinogenic doses. It is thought that this induced hyperproliferative state can drive carcinogenesis through various ways (Butterworth et al., 1995). The first is the increased rate of cell proliferation. Second, the state of inflammation causes the generation of free radicals which may damage DNA. Thirdly, the secretion of growth factors which allow tissue repair may facilitate growth of pre-neoplastic cells.
Immunosuppression, inhibition of gap junctional intercellular communication (GJIC), and disruption of the cellular epigenome have also been suggested as mechanisms of NGTX carcinogenesis. Numerous components of the immune system are thought to be involved in cancer immunosurveillance whereby nascent transformed cells are
- 40 -
recognised and removed. Suppression of the immune system allows a greater proportion of incipient cancer cells to escape the host immune system and initiate cancer development (Zitvogel et al., 2006). An example of a chemical with such properties is cyclosporine, a compound that is used to suppress the immune system after organ transplant. Unfortunately its immunosuppressive activity also results in increased malignancies (Hojo et al., 1999). Gap junctions are formed between adjacent cells whose plasma membranes link to form channels around the cells, that are thought to be important for homeostasis. Through these channels small molecular substances can travel between cells. Disruption of the GJIC between cells affects cell growth and cell death. GJIC is a common target of many NGTX carcinogens, e.g. phenobarbital, Aroclor, pregnenolone-16 alpha-carbonitrile (Kolaja et al., 2000).
Exposures to many carcinogens results in an altered epigenome. The disruption of the cellular epigenome can contribute to cancer by directly deregulating critical cancer genes. For example in many cancers, tumour suppressor gene P16 is hypermethylated and the oncogene RAS is hypomethylated. Alternatively, altered epigenome can promote carcinogenesis by causing genetic instability. Indeed, global hypomethylation is commonly observed in cancers. Mechanisms by which exogenous insult can disrupt the epigenome have been suggested (depletion of the S-adenosylmethionine and S-adenosylhomocysteine pools; repression of DNA methyltransferases; DNA damage; passive demethylation during cell replication; active demethylation) (Wilson et al., 2007, Pogribny et al., 2008). Arsenic is a NGTX carcinogen that is thought to act partly by altering the epigenome. It can induce global liver hypomethylation by depleting the S-adenosylmethionine pool (Zhao et al., 1997) and inhibiting the DNA methyltransferases (Reichard et al., 2007).
- 41 -
Several distinct mechanisms of carcinogenesis have been described here, while perhaps more remain to be identified in the future. Nevertheless, many more carcinogens exist than carcinogenic mechanisms. It is thus expected that groups of chemical carcinogens will cause tumours through similar mechanisms. Indeed, research has confirmed that groups of carcinogens act in similar fashion to cause cancer. This idea underpins the concept of a mode of action (MOA) for a carcinogen (Boobis et al., 2009b). MOA in cancer is defined as a biologically plausible series of key events which are initiated with the interaction of the substance with the cell and result in cancer formation. In contrast to MOA which is a plausible hypothesis of how a carcinogen works, the mechanism of action is a more complete and detailed description of the events driving carcinogenesis. Key events are quantifiable consequences of exposure (e.g. biochemical processes or histopathological alterations) which are necessary or a biological marker of a necessary event to the eventual carcinogenesis. A key event is necessary, but often not sufficient for cancer formation. Associative events are not causal, but are reliable markers of key events (U.S. Environmental Protection Agency, 2005). The MOA therefore forms a useful framework for studying chemical carcinogens and their risk to humans. As an example, for chloroform the MOA is cytotoxicity followed by regenerative hyperplasia. Chloroform does not damage DNA, but causes cell death in the mouse liver followed by regenerative cell proliferation at the same doses that cause liver tumour formation (Larson et al., 1994). Key events of chloroform carcinogenicity are (1) biotransformation of chloroform to reactive phosphogene (2) Phosphogene-induced cytotoxicity and cell death of hepatocytes (3) regenerative proliferation (4) development of tumours (Boobis et al., 2009b). Another MOA is activation of PPARα by agonists (e.g. Wy-14,643; Di(2-ethylhexyl)phthalate (DEHP)) resulting in
- 42 -
liver hepatocarcinogenesis in rodents. The key events are altered cell proliferation, altered apoptosis, and selective clonal expansion (Klaunig et al., 2003) .
1.2 MicroRNAs have important roles in cancer
1.2.1 Non-coding RNAs are conserved in eukaryotes
The classic view in molecular biology had been that RNA is a more or less passive intermediate in the process of gene expression, possessing no regulatory functions. This notion has been overturned in the past decade with the discovery in eukaryotes of endogenous small non-protein coding RNAs which have important physiological roles in gene regulation and for protecting genome stability. At present three classes of small non-coding RNA are known: the piwi-interacting RNAs (piRNAs), the short interfering RNAs (siRNAs), and microRNAs (miRNAs). These non-coding RNAs act to silence homologous sequences found within the organism by multiple mechanisms (Moazed, 2009). PiRNAs are 24-30 nucleotides long and have been found in the germline of animals. They act to silence selfish DNA such as transposons, thus protecting genetic stability (Klattenhoff & Theurkauf, 2008). Endogenous siRNAs and miRNAs differ from piRNAs in being 21-25 nucleotides long, being active in both somatic and germline cells, have been found in both plants and animals, and originate from double stranded precursors (Carthew & Sontheimer, 2009).
Animal miRNAs have been extensively studied in recent years due to their important roles in physiology and pathology, including cancer (Bartel, 2004, Bartel, 2009). Despite the importance of miRNAs, lin-4 which was the first miRNA to be identified as such, was only discovered in 1993. Lin-4 was initially identified as a heterochronic
- 43 -
non-coding RNA which was involved in the timing of larval development in
C.elegans (Lee et al., 1993). As lin-4 was only detected in nematodes it was thought
that this gene was a peculiarity restricted to this animal. The big breakthrough came with the isolation of a second nematode miRNA, let-7, in 2000. Unlike lin-4 this miRNA had homologs in several species, including human (Pasquinelli et al., 2000, Reinhart et al., 2000). This finding revealed that a non-coding RNA was an evolutionary conserved mechanism of gene regulation. The field of miRNAs only really grew with the subsequent isolation of hundreds of miRNAs shortly afterwards (Lagos-Quintana et al., 2001, Lau et al., 2001, Lee & Ambros, 2001).
It is now known that miRNAs are evolutionarily conserved, some of them very broadly, while others are restricted to more closely related species, and have been discovered in the genome of all known plant and animal genomes (Carthew & Sontheimer, 2009, Bartel, 2004). MiRNAs are a fairly abundant class of genes in mammals, as it has been estimated that 2-3% of all genes code for miRNAs (Alvarez-Garcia & Miska, 2005). The last few years have seen a continued increase in the number of identified miRNAs in various species. The latest release of the miRNA database has 17341 mature miRNAs in 142 species (miRbase database Dec 2010). In that database there are 1048 miRNAs identified in humans, 672 in mice, and 408 in the rat.
1.2.2 Biogenesis and function of mature miRNAs
MiRNA genes are located either within protein coding genes or at their own independent intergenic loci. A large fraction (30-40%) of miRNAs is positioned within protein coding genes, usually within introns, but can be found within exons as
- 44 -
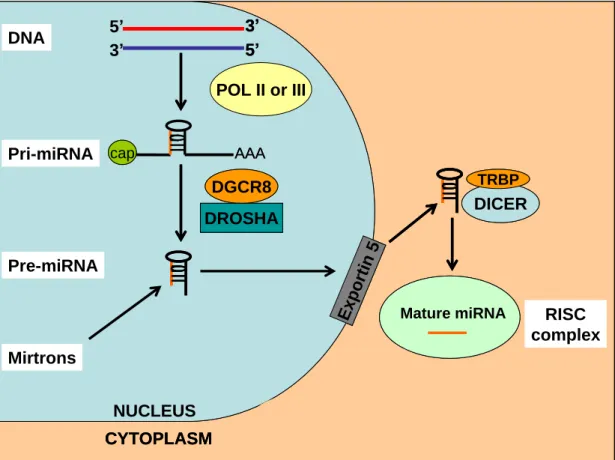
well. Intergenic miRNAs have their own promoters and regulatory elements. The generation of the mature, functioning miRNAs from these genes is a multi-step process requiring the activity of numerous enzymes. Most miRNAs are transcribed by the same enzyme that performs mRNA transcription, DNA polymerase II (Lee et al., 2004), although some miRNAs are transcribed instead by RNA polymerase III (Borchert et al., 2006). The canonical pathway of miRNA generation (See Figure 1.2) starts with the transcription of a long primary-miRNA (pri-miRNA) that can be hundreds to thousands of kilobases in length. A distinguishing characteristic of miRNA biogenesis is the folding of the pri-miRNA onto itself to form hairpin structures. A given pri-miRNA can contain from one to six mature miRNAs located within such intramolecular hairpins. The pri-miRNA will subsequently undergo two cleavage steps from RNAse III type enzymes in order to release the mature miRNA(s). While still in the nucleus the pri-miRNA is cleaved by the microprocessor complex made up from DiGeorge Syndrome Critical Region 8 (DGCR8) and Drosha. The former protein recognizes double-stranded RNA hairpins and positions Drosha to process the pri-miRNA and release the 60-80 nucleotide long pre-miRNAs. These molecules are then transported from the nucleus to the cytoplasm by Exportin-5 and Ran-GTP. In the cytoplasm the pre-miRNA is processed further by Dicer which cuts the pre-miRNA at 21-24 nucleotides from one end to form a miRNA-miRNA* duplex. The mature miRNA strand is then selectively incorporated onto the multi-protein RNA activated silencing complex (RISC), while the miRNA* is usually degraded and is found at much lower steady-state levels. The incorporated mature miRNA then acts as the guiding strand directing the RISC to silence its mRNA target (see later). The conserved argonaute family of proteins which are contained within the
- 45 -
RISC are the effectors of RISC-induced silencing of targets (Bartel, 2004, Sotiropoulou et al., 2009).
An alternative process by which mature miRNAs can be generated has also been identified. These miRNAs, termed mirtrons, are localised within introns and are transcribed along with the protein-coding gene in which they reside. Pre-miRNAs are then generated directly from the introns by activity of the spliceosome and debranching enzymes. These pre-miRNAs are then exported to the cytoplasm and processed to mature miRNAs as in the canonical pathway (Berezikov et al., 2007) (Figure 1.2).
- 46 -
Figure 1.2 microRNA biogenesis in mammals
5’ 3’ 3’ 5’ AAA cap DGCR8 DROSHA Pri-miRNA Pre-miRNA Exportin 5 DICER DNA POL II or III TRBP Mirtrons NUCLEUS CYTOPLASM RISC complex Mature miRNA
Gene degradation Translational repression 5’ 3’ 3’ 5’ AAA cap DGCR8 DROSHA Pri-miRNA Pre-miRNA Exportin 5 DICER DNA POL II or III TRBP Mirtrons NUCLEUS CYTOPLASM RISC complex Mature miRNA
Gene degradation Translational repression 5’ 3’ 3’ 5’ AAA cap DGCR8 DROSHA 3’ 5’ AAA cap DGCR8 DROSHA Pri-miRNA Pre-miRNA Exportin 5 DICER DNA POL II or III TRBP Mirtrons NUCLEUS CYTOPLASM RISC complex Mature miRNA
Gene degradation Translational repression mRNA degradation Translational repression 5’ 3’ 3’ 5’ AAA cap DGCR8 DROSHA Pri-miRNA Pre-miRNA Exportin 5 DICER DNA POL II or III TRBP Mirtrons NUCLEUS CYTOPLASM RISC complex Mature miRNA
Gene degradation Translational repression 5’ 3’ 3’ 5’ AAA cap DGCR8 DROSHA Pri-miRNA Pre-miRNA Exportin 5 DICER DNA POL II or III TRBP Mirtrons NUCLEUS CYTOPLASM RISC complex Mature miRNA
Gene degradation Translational repression 5’ 3’ 3’ 5’ AAA cap DGCR8 DROSHA 3’ 5’ AAA cap DGCR8 DROSHA Pri-miRNA Pre-miRNA Exportin 5 DICER DNA POL II or III TRBP Mirtrons NUCLEUS CYTOPLASM RISC complex Mature miRNA
Gene degradation Translational repression mRNA degradation Translational repression
Fig.1.2 In the canonical pathway pri-miRNAs are transcribed by DNA polymerase II or III. This are capped and contain a polyA tail. The pri-miRNA folds into itself to form one to six hairpin structures containing base-pair stems (here one is shown). Within these intramolecular structures the mature miRNA sequences are contained. Drosha and DGCR8 process the pri-miRNA to release the ~70 nucleotide long pre-pri-miRNA. In an alternative pathway for mirtrons pre-miRNAs are formed by the splicing machinery without forming pri-miRNA first. The miRNA are transported to the cytoplasm by exportin 5. Within the cytoplasm the pre-miRNA is processed by dicer/TRBP in mammals and the mature pre-miRNA strand is loaded onto the RISC complex.
Another processing mechanism during biogenesis of miRNAs is editing of their sequence. The adenosine acting on RNA (ADAR) enzyme drives the change of adenosines to inosines in RNA duplexes. This results in the change of a stable adenosine:cytosine pairing to a less stable inosine:cytosine. The miRNA editing can have profound effects on the processing and functioning of the miRNA. This editing