sustainability
ArticleA Systemic Tool and Process for
Sustainability Assessment
Claude Villeneuve, David Tremblay *, Olivier Riffon, Georges Y. Lanmafankpotin and Sylvie Bouchard
Chaire enÉco-Conseil, Universitédu QuébecàChicoutimi, Chicoutimi, QC G7H 2B1, Canada;
claude_villeneuve@uqac.ca (C.V.); olivier_riffon@uqac.ca (O.R.); georges.lanmafankpotin1@uqac.ca (G.Y.L.); sylvie1_bouchard@uqac.ca (S.B.)
* Correspondence: david1_tremblay@uqac.ca; Tel.: +1-418-545-5011 (ext. 2573) Received: 3 August 2017; Accepted: 17 October 2017; Published: 23 October 2017
Abstract:Sustainability assessment is a growing concern worldwide with United Nations’ Agenda 2030 being implemented. As sustainability refers to the consideration of environmental, social and economic issues in light of cultural, historic—retrospective and prospective—and institutional perspectives, appropriate tools are needed to ensure the complete coverage of these aspects and allow the participation of multiple stakeholders. This article presents a scientifically robust and flexible tool, developed over the last 25 years and tested in different cultural and development contexts to build a framework for sustainability assessment of policies, strategies, programs and projects in light of Agenda 2030. A selected case study conducted on a major mining project in Québec (Canada) illustrates the Sustainable Development Analytical Grid performance for sustainability assessment. This tool and process is part of the United Nations’ Sustainable Development Goals Acceleration Toolkit; it is one of the most adaptable, addresses all 17 SDGs and is fully accessible for free. Other advantages and limitations of the tool and process are discussed.
Keywords:sustainable development assessment; Agenda 2030; sustainable development analytical grid; stakeholders’ participation
1. Introduction
For the last 45 years, the concept of sustainable development (SD) has been seen as an alternative to conventional economic development based on gross domestic product (GDP) growth. Rallying around this paradigm is a response to the failures of the dominant model, including its failure to fairly distribute wealth, and its impacts on the local and global environment, cultural diversity and social cohesion. Although its roots can be traced millenaries ago in human history [1], it has flourished in the late 20th century [2].
At the United Nations (UN) Conference on the Human Environment held in Stockholm in 1972 [3], the international community agreed that both development and the environment, hitherto addressed as separate issues, could be managed in a mutually beneficial way. That conference, and many others afterwards, was the occasion for the international community to adopt virtuous principles to be integrated in development policies, strategies, programs or projects (PSPP). This approach led to the adoption of Agenda 21 at the Earth summit held in Rio de Janeiro in 1992.
Since then, sustainability is discussed in the political world, in business sectors as well as at community level, in non-governmental organizations and in the academic world but attempts for its implementation are rewarded by varying degrees of success. As long as the concept is based on virtuous principles, “things” keep on going mostly as usual and no real in-depth changes are implemented.
Despite abundant literature on SD and another World UN Summit held in Johannesburg (2002), sustainability did not enter the realm of decision makers sufficiently to prevent multiple crisis (food, Sustainability2017,9, 1909; doi:10.3390/su9101909 www.mdpi.com/journal/sustainability
climate, water, poverty, etc.) that culminated with the 2008 financial crisis. As these would have been improbable in a SD ruled world, the financial crisis finally called for a real change towards a conversion in the measure of progress from GDP growth to wellbeing and sustainability [2,4–7]. The United Nations Conference on Sustainable Development (Rio+20), held in Rio de Janeiro in 2012, led to the call of a new Agenda for 2030 to face those challenges. The 2030 Agenda for Sustainable Development and its 17 Sustainable Development Goals (SDG) [8] were adopted by the UN General Assembly in September 2015 and came into force on 1 January 2016. This approach, including targets and indicators, addressing complexity and interactions, goes beyond the simple wish list of previous conferences.
Sustainability relates to multiple objectives pertaining to various dimensions. It is also linked to various timeframes. As decisions are generally made on short term perceived issues in order to satisfy political agendas or quarterly results, long term issues and complexity have a limited influence on everyday management. Thus, we can consider SD as a hypothesis on the evolution of different indicators for the welfare of human beings enhancing the quality of their local and global environment over a long time perspective [9] (p. 53). However, SD still presents difficulties in terms of its planning, implementation, monitoring and evaluation [10,11].
Sustainability can be assessed but, as a whole, it allows different views to coexist. According to Waas et al. [1], it must abide by four principles:
(1) normativity; (2) equity;
(3) integration; and (4) dynamic principle.
The normativity principle supposes that sustainability is a matter of social definition and can change with time and values. It is a temporary representation of the kind of world we want to live in and want to leave as a legacy for future generations. The equity principle is central to sustainability and can be divided in inter-generational, intra-generational, geographical, procedural and inter-species equity. The integration principle implies that all sustainability principles should be considered together in a holistic perspective and that mutually supportive benefits must always be sought. The dynamic principle refers to SD as a process of directed change that is not defined by an end-state: SD is therefore cybernetic by essence [12].
Sustainability assessment (SA), according to Sala et al. [10], “is one of the most complex types of appraisal methodologies” that entails multidisciplinary aspects and is conducted for supporting decision-making and policy development. Many tools, indicators system and frameworks have been proposed to characterize and assess sustainability at different level [13–19]. For this paper, we consider as SD assessment tools: checklists, computer models, processes and approaches, institutionalized or not, used to evaluate and analyze operations for informed decisions on sustainable development. They can be used for planning, simulation, monitoring and management follow-ups or as repositories. While some tools give partial answers for an overall assessment, they can be combined for a more complete sustainability assessment. Furthermore, they should refer to the eight principles of “The New BellagioSTAMP” [2]:
(1) Guiding vision;
(2) Essential considerations; (3) Adequate scope;
(4) Framework and indicators; (5) Transparency;
(6) Effective communications; (7) Broad participation; and (8) Continuity and capacity.
However, are the tools aforementioned able to address the complexity of a systemic representation of sustainability? Most SA tools were developed from a given perspective to obtain the labeling of sustainability and most cannot account for the complexity and full scope of interactions pertaining to a dynamic socio-ecological system submitted to multiple driving forces and diverse limits. As stated in Sala et al. (2015), “Performing a sustainability assessment requires integrating sustainability principles, thresholds and targets in the evaluation, as well as moving from a mere multidisciplinary to inter- and trans-disciplinary approaches” [10]. Moreover, the projection of this system in a foreseeable future demands the common understanding of challenges, pathways and means by multiple stakeholders in order to get their involvement towards common goals.
On 17 July 2017, UN Development Group and UNICEF launched the “SDG Acceleration Toolkit” [20] where a collection of sixty-one tools developed worldwide are presented in three broad categories:
(1) Integration tools;
(2) Last-mile analysis tools; and (3) Risk-informed planning tools.
The first category encompasses “Integration tools for analyzing interconnections, synergies, trade-offs and bottlenecks among SDGs” including Dynamic Simulation, Indicators and Assessment and Static Inter-linkage Analysis tools. The second category is defined as: “Last-mile tools to support meeting the SDGs and targets and unlocking bottlenecks for all segments of society and reaching the furthest behind first”; it includes tools targeting Community-based planning and Multi-stakeholder Engagement, Data Revolution, Fragility Assessment, Human Rights Mainstreaming, Financing for SDGs and Vulnerability Assessment. Finally, the third category comprises “Risk-informed planning tools for resilience building, adaptation and identifying and unlocking bottlenecks”; referring to Disaster Risk Reduction, Economic Forecasting, Environmental Degradation Risk Reduction, Epidemic and Pandemic Analysis, Peace and Conflict Analysis, Risk, Foresight and Scenario tools and tools for Financing Resilience [20].
In the SDG Acceleration Toolkit, tools are also classified according to their type: Diagnostics, Guidelines, Computer models and programs, Set of monitoring indicators and indices, Financing instruments and funds, Technology access protocols, Training programs, Communication plans, Capacity building, Knowledge management platforms, Econometric models, Scenario builders, forecasting and back-casting methodologies, and Narratives (storytelling) guidelines.
This paper is about a sustainability assessment tool (the Sustainable Development Analytical Grid (SDAG)) and its related process, developed and tested on Policies, Strategies, Programs and Projects (PSPP) at local and national levels from 1988 onwards. It was created and refined over the past 25+ years because SD early practitioners needed to have a complete, thorough assessment tool and methodology, able to evolve in accordance with SD conceptualization and deal with its inherent complexity. The SDAG is recognized by the UN and is part of the SDG Acceleration toolkit where it is classified under Integration tools. The SDAG tool and process meet the eight principles of “The New BellagioSTAMP” [2]. Its assessment methodology is simple, efficient, scientifically robust and the tool is freely accessible to anyone via a website. The SDAG stands out by its flexibility as its methodology allows questioning on a very complete range of themes pertaining to the six sustainability dimensions identified in the literature by Waas et al., and can be applied to policies, strategies, programs or projects of different scales (local to national). The SDAG imposes questioning and reflection in an ethical dialogue which permits and favors inclusion. The scientific robustness of the content and the flexibility of the methodology make the SDAG a tool distinct from the others by making complexity accessible to SA.
The SDAG has been tested in developed, as well as developing and emergent countries, around the world (Algeria, Benin, Burkina Faso, Cameroon, Canada, China, Comoros, Côte d’Ivoire, Democratic Republic of the Congo, France, Gabon, Guinea, Haïti, Madagascar, Mali, Morocco, Sao Toméand
Principe, Senegal, Togo and USA). According to SDG Acceleration Toolkit classification, the SDAG is a diagnostic type of tool. It is an integration tool as well as an Indicator and assessment tool and a Static inter-linkage analysis tool. It also appears in the Last-mile analysis tool category because it is a Community-based planning, partnership and multi-stakeholder engagement tool. Because of its methodology and complete content (it addresses all 17 SDGs), the SDAG is one of the three tools in the SDG Acceleration Toolkit that fits that profile and the only one of the three fully accessible for free.
In this paper, we present the SDAG and its application to a case study, chosen as the best real context example to demonstrate the SDAG’s complete coverage of SD issues in a holistic perspective, stakeholders’ involvement for co-constructing solutions, priority setting in a transdisciplinary approach and continuous improvement perspectives, thus meeting Sala et al. requirements [21], “The New BellagioSTAMP” principles for SA [2] and Waas et al. principles of sustainability [1]. The Apatite Arnaud mine in Sept-Iles (QC, Canada) was chosen as the case study because of its limited and adequate scope (a mining project), the compliance of process (the study was conducted with research team support), its completeness (the project was fully documented and submitted to a legal examination process by an independent commission) and because of its recentness (2012–2014). The case study is here presented to illustrate the process and show examples of real results, graphics and interpretations. However, other assessments have been conducted with more advanced versions of the SDAG, on National planning documents for instance, but they are not shown in this paper as they did not fill all the requirements mentioned above. The decision-making process following assessment, another order of complexity by itself, will not be discussed herein.
2. Materials and Methods
In this section, the tool described is the 2011 version of the SDAG as it was the version used for the case study. Changes made in ulterior versions will be noted in the text to provide readers with the latest information on the SDAG.
2.1. The Eco-Advising Chair Sustainable Development Analytical Grid
Mastering tools to explicitly take into account the principles and SD issues at all levels are of outmost importance. The Sustainable Development Analytical Grid (SDAG) [22], developed by the Eco-Advising Chair of the University of Quebec in Chicoutimi (UQAC) stemming from the initial work of Villeneuve, provides stakeholders with a tool that allows them to fully play their roles in assessing sustainability. The SDAG was first created to evaluate simple projects, but then was enhanced and adapted to the evaluation of any national, regional, local or sectorial PSPPs. The SDAG presents as a Microsoft Excel spreadsheet with a user guide in English or French version that can be uploaded for free onecoconseil.uqac.ca.
The latest (2016) version of the SDAG is an analytical tool based on six dimensions (ecological, social, economic, ethical, cultural and governance), which can be used to assess to what extend PSPP can improve human conditions through the leverage it provides without adverse effect to other components of sustainability. It enables its users to situate themselves in a sustainability process and presents ways to improve their PSPP, while aiming for continuous improvement. The analysis can also be used to set objectives, find indicators, make more knowledgeable decisions, and/or find manageable tradeoffs and new research questions. The SDAG evaluates PSPP performance on objectives in order to assess dimensions and overall sustainability performance.
The Brundtland report definition of SD focusing on the satisfaction of present and future human needs was the first inspiration for the SDAG. It was built from principles, themes, and objectives drawn from a literary review of the proceedings of international conferences and conventions, standards such as ISO 26000 best practices, as well as a diversity of authors. Since 1988, components and ideas have been collected, crossed, reformulated and the wording has been tested with students, laypersons involved in projects and sustainable development experts after 1991. For example, the UN SDGs and their targets were introduced in the latter version of the tool launched in May 2016 [22] from the reformulation of the
earlier 2014 version following a review by twelve experts. The objectives set out for each dimension are used to build a qualitative index consisting of a global score by dimension that measures the capacity of a PSPP to comply with the conditions of SD. The approach has the advantage of considering at once global concerns and the more local types of impacts, limited in both space and time.
Over time, the tool has evolved. After the introduction of “ethical” dimension in 1992, governance was added in the 2011 version and then cultural dimension in 2014. These new dimensions were introduced from the addition of new objectives and reorganization of previous ones, each dimension referring to the satisfaction of specific needs corresponding to the Guiding vision principle of the New BellagioSTAMP [2]. With these six dimensions, SDAG covers the six pillars identified in the literature by Waas et al. [1] as well as the five Ps—People, Planet, Prosperity, Peace and Partnership—of UN Agenda 2030.
• The ethical dimension addresses the need of equity, justice, solidarity and coherence;
• The ecological dimension addresses the need for quality environments and long-term availability of resources;
• The social dimension addresses social needs and individual aspirations, peace and security needs, to improve the quality of life and cohesion of societies;
• The economic dimension addresses the material needs to maintain and improve the mechanisms that allow human societies to meet their needs through exchanges of their comparative advantages;
• The dimension of governance addresses the needs of participation, democracy, integration and transparency; and
• The cultural dimension (not present in 2011 SDAG) addresses the needs of cultural traits affirmation, protection and enhancement.
Although content has been updated in recent years, the analysis process has been unchanged since 1999. However, the Excel spreadsheets were progressively automated to cross results and present figures and priorities that make the analyst’s work and interpretation of results easier.
The case study presented in this article arises from the use of the SDAG 2011 edition, which comprises five dimensions (ethical, social, ecological, economic, and governance), 32 themes and 101 objectives (Figure1). This project was chosen as an example as the authors were involved (via the Eco-advising Chair research team) from beginning to end to perform research and acquire additional knowledge during the sustainability assessment process. The exercise was therefore recent, complete and could be used to demonstrate the SDAG’s full potential.
Sustainability 2017, 9, 1909 5 of 28
has the advantage of considering at once global concerns and the more local types of impacts, limited in both space and time.
Over time, the tool has evolved. After the introduction of “ethical” dimension in 1992, governance was added in the 2011 version and then cultural dimension in 2014. These new dimensions were introduced from the addition of new objectives and reorganization of previous ones, each dimension referring to the satisfaction of specific needs corresponding to the Guiding vision principle of the New BellagioSTAMP [2]. With these six dimensions, SDAG covers the six pillars identified in the literature by Waas et al. [1] as well as the five Ps—People, Planet, Prosperity, Peace and Partnership—of UN Agenda 2030.
• The ethical dimension addresses the need of equity, justice, solidarity and coherence;
• The ecological dimension addresses the need for quality environments and long-term availability of resources;
• The social dimension addresses social needs and individual aspirations, peace and security needs, to improve the quality of life and cohesion of societies;
• The economic dimension addresses the material needs to maintain and improve the mechanisms that allow human societies to meet their needs through exchanges of their comparative advantages;
• The dimension of governance addresses the needs of participation, democracy, integration and transparency; and
• The cultural dimension (not present in 2011 SDAG) addresses the needs of cultural traits affirmation, protection and enhancement.
Although content has been updated in recent years, the analysis process has been unchanged since 1999. However, the Excel spreadsheets were progressively automated to cross results and present figures and priorities that make the analyst’s work and interpretation of results easier.
The case study presented in this article arises from the use of the SDAG 2011 edition, which comprises five dimensions (ethical, social, ecological, economic, and governance), 32 themes and 101 objectives (Figure 1). This project was chosen as an example as the authors were involved (via the Eco-advising Chair research team) from beginning to end to perform research and acquire additional knowledge during the sustainability assessment process. The exercise was therefore recent, complete and could be used to demonstrate the SDAG’s full potential.
Figure 1. Dimensions and themes of the SDAG 2011.
The 2011 SDAG version was published in English in 2012. The SDAG is a Microsoft Excel file where each dimension is on a separate spreadsheet (Figure2). In addition, each dimension/sheet highlights a principle pertaining to the rationale of the dimension. Dimensions are subdivided in themes that are subdivided in objectives, which can be weighted and evaluated.
Sustainability 2017, 9, 1909 6 of 28
The 2011 SDAG version was published in English in 2012. The SDAG is a Microsoft Excel file where each dimension is on a separate spreadsheet (Figure 2). In addition, each dimension/sheet highlights a principle pertaining to the rationale of the dimension. Dimensions are subdivided in themes that are subdivided in objectives, which can be weighted and evaluated.
Figure 2. Ethical dimension table.
For each principle, theme and objective, explanations, justifications and examples are available directly in the file for ease of use (accessed by a commentary window in each cell) (Figure 3).
Ethical dimension : Addressing the need for equity, justice, solidarity, and coherence
Weight Ev a l 1 (% ) Actual and projected measures Improvement Priority 1 Poverty
1.1 Implementing actions targeting the neediest within an organization
1.2 Implementing actions targeting the neediest within a community
1.3 Implementing actions aiming to reduce inequalities outside a community
Total theme 1 : 0 0% 2 Solidarity
2.1 Encouraging individual autonomy 2.2 Respecting human rights
2.3 Making sure benefits are impartially distributed
2.4 Considering and recognizing the contribution of minorities
2.5 Aiming for equity 2.6 Improving accessibility
Total theme 2 : 0 0% 3 Restoration and compensation
3.1 Setting ecosystem restoration objectives 3.2 Planning for the rehabilitation of sites in the
design stages of projects
3.3 Compensating communities suffering negative impacts
Total theme 3 : 0 0% 4 Originality and innovation
4.1 Diversifying options
4.2 Fostering the potential for innovation 4.3 Fostering research and development
Total theme 4 : 0 0% 5 Common values
5.1 Fostering the emergence and sharing of common values
5.2 Ensuring coherence between organizational actions and values
Total theme 5 : 0 0%
0 0%
Total ethical dimension : Themes
Objectives
Figure 2.Ethical dimension table.
For each principle, theme and objective, explanations, justifications and examples are available directly in the file for ease of use (accessed by a commentary window in each cell) (Figure3).
Sustainability 2017, 9, 1909 7 of 28
Figure 3. Ethical dimension tab—Commentary window example.
2.2. Assessment Methodology
Sustainability being normative and dynamic, the SDAG should above all be considered as an asset in a continuous improvement process. It can be used at different steps of a PSPP where such an approach involves making regular evaluations to ensure the PSPP evolves in the desired direction. The PSPP can be revisited periodically as needed, e.g., an organization could decide to make its assessment every three to five years. The assessment should be made ex-ante (in the conception phase, prior to implementation) warranting that knowledge acquisition and stakeholders’ need analysis are sufficient and to verify which elements may be under-represented or missing. It is also useful to set priorities, to select performance indicators, and to determine the needs for future research.
During implementation, the evaluation is used to check the relevance and performance of the PSPP, to look for compromises, to redirect actions and to articulate priority improvements. Ex-post evaluations allow validating the overall direction of the development resulting from the implementation of the PSPP. It reviews the actions in place to ensure they do not produce counter-intuitive effects. It can also be used to gather information for the improvement of future PSPPs to report or communicate.
The assessment procedure with the SDAG consists of five major steps that will be explained in detail in the following sections. They are:
(1) Preparing for the assessment; (2) Weighting;
(3) Evaluation;
(4) Current and future actions and Improvements; and (5) Results interpretation and sustainability assessment.
An assessment is an iterative process and analysts, with the Committee, are free to make adjustments throughout. Because an assessment should be based on the latest data available, they can add documentation, re-discuss weights, or reevaluate objectives enlightened by new data. 2.3. Preparing for the Assessment
Before using the SDAG, the assessors must pay particular attention to the scope of analysis, the needs of the assessment, the data collection and the analysis committee.
2.3.1. Scope of the Analysis
To measure SD progress, it is important to first determine the scope of the analysis. In accordance to the Adequate scope principle (New BellagioSTAMP), the scope should adopt an appropriate time
Figure 3.Ethical dimension tab—Commentary window example.
2.2. Assessment Methodology
Sustainability being normative and dynamic, the SDAG should above all be considered as an asset in a continuous improvement process. It can be used at different steps of a PSPP where such an approach involves making regular evaluations to ensure the PSPP evolves in the desired direction. The PSPP can be revisited periodically as needed, e.g., an organization could decide to make its assessment every three to five years. The assessment should be made ex-ante (in the conception phase, prior to implementation) warranting that knowledge acquisition and stakeholders’ need analysis are sufficient and to verify which elements may be under-represented or missing. It is also useful to set priorities, to select performance indicators, and to determine the needs for future research.
During implementation, the evaluation is used to check the relevance and performance of the PSPP, to look for compromises, to redirect actions and to articulate priority improvements. Ex-post evaluations allow validating the overall direction of the development resulting from the implementation of the PSPP. It reviews the actions in place to ensure they do not produce counter-intuitive effects. It can also be used to gather information for the improvement of future PSPPs to report or communicate.
The assessment procedure with the SDAG consists of five major steps that will be explained in detail in the following sections. They are:
(1) Preparing for the assessment; (2) Weighting;
(3) Evaluation;
(4) Current and future actions and Improvements; and (5) Results interpretation and sustainability assessment.
An assessment is an iterative process and analysts, with the Committee, are free to make adjustments throughout. Because an assessment should be based on the latest data available, they can add documentation, re-discuss weights, or reevaluate objectives enlightened by new data.
2.3. Preparing for the Assessment
Before using the SDAG, the assessors must pay particular attention to the scope of analysis, the needs of the assessment, the data collection and the analysis committee.
2.3.1. Scope of the Analysis
To measure SD progress, it is important to first determine the scope of the analysis. In accordance to the Adequate scope principle (New BellagioSTAMP), the scope should adopt an appropriate time horizon and geographical scope [2]. The limits of the PSPP must be identified to manage the amount of information needed and to relate the results in a significant way. Use of the SDAG first requires asking how it will be applied, and what are the objectives of the analysis (e.g., project design, progress evaluation, specific reporting, etc.). The scope defines the limits in terms of organization, authority, infrastructures, planning steps, production steps, territory, temporality, sectors, etc. This information can be reported in a table of the spreadsheet for further analysis.
2.3.2. Needs Assessment
The second prerequisite concerns the needs that the evaluated PSPP should meet. Numerous issues, objectives, and indicators can be targeted by a PSPP. Hence, PSPPs can identify the tradeoffs necessary to satisfy the most basic needs of the greatest number of people before meeting the accessories needs or preferences of a few. The needs assessment is essential to fully grasp the nature of the actions that the stakeholders will need to focus on as they commit to a sustainable PSPP. This information can be obtained from interviews, media analysis, statistical data, contextual documents and stakeholder’s declarations to public authorities, for example. The needs analysis should be included in the final report as it justifies the PSPP. Needs analysis helps the stakeholders in the weighting process. It can also be performed as a sub-step of weighting depending upon the type of PSPP considered. Needs assessment is related to the equity principle of sustainability as it uncovers more than the promoter’s needs. A larger view of the various stakeholders’ needs is useful for further steps of analysis. The needs assessment can be linked with the Guiding vision, the Essential considerations and the Framework and indicators principles of the New BellagioSTAMP [2].
2.3.3. Data Collection
Finally, the last prerequisite to the evaluation relates to the best possible understanding of the PSPPs and their context of implementation. This is done through research in literature, expert testimony, field trips, readings, etc., within the boundaries of the defined scope. Data collection can be in various domains such as technical, legal, moral, social, economic, environmental, and others. Knowledge gaps must be identified. Every piece of literature quoted in the grid should be available at all time during and after the analysis as suggested by the Transparency principle New BellagioSTAMP, [2]. Assessing a knowledge gap may require reconsideration of the PSPP if it is linked to a prioritized objective and necessitates an evaluative search to supplement the missing information.
The data collection step helps to determine the assessment committee composition, to identify analysts or to select experts for the evaluation. That step must be initiated before assessment but can be revisited or completed during the following assessment steps.
2.3.4. Analysis Committee
For the weighting step, a committee must be constituted. Depending on circumstances, the committee may be composed of a combination of stakeholders (5–12) with diverse backgrounds: promoters, experts in the related field, people or communities impacted by a project, and, ideally, a SDAG expert. Ideally, members of the committee are open minded people with great listening skills, dialogue and systemic view capacities. If and when more people want to be involved, multiple committees can compare and discuss their results after weighting.
2.4. Weighting
Weighting each objective calibrates the grid according to their relevance and significance for a given PSPP in a given country or region at a particular moment. This step is crucial to calibrate
the SDAG to the realities and context in which it applies. To comply with the equity principle, weighting must be conducted by a facilitator in a free discussion between a team of persons including stakeholders, operators, and planners. The analysts must decide through dialogue the weight of each component by consensus. For each SDAG’s objectives, the group must answer the following question: Is achieving this objective desirable, important or essential for our PSPP?
Values of 1, 2 and 3 are used to qualify the significance of a given PSPP objective:
(1) Desirable objective: Achieving this objective is deemed unimportant, or it has low value to fulfill identified needs;
(2) Important objective: Achieving this objective is deemed important but is not directly associated with identified needs regarding the PSPP; and
(3) Essential objective: Achieving this objective is deemed essential and will contribute directly to the satisfaction of identified needs. It is considered essential to the success of the PSPP.
It should be noted that the value 0 cannot be granted in the weighting process because every objective in the grid is relevant in a SD perspective. Consequently, all objectives are subject to evaluation and improvement over time. This insures respect of the integration principle as the complete set of objectives will be questioned and their interactions considered during the assessment process.
Weighting reflects the values and experience of the committee members. Every objective must be discussed and a common decision made. If an agreement is not possible, minority opinions must be noted and justified for further sensitivity analysis. Those are conducted to determine to what extent their weighting would have changed overall priority results. The 2016 SDAG version was modified to gather more information by adding a column for weighting justification.
The weighting can remain or be changed with further assessments, by the same group or different people according to each PSPP’s circumstances, but a good practice would be to go over it and exert consensual changes if need be.
2.5. Evaluation
If the weighting reflects stakeholder point of view, evaluation records the performance of a given PSPP for every objective in the SDAG. Therefore, once all weighted, each objective is evaluated by answering the following question: “How does the PSPP address this objective?”
In the 2011 SDAG, percentile values are used to determine a PSPP’s performance regarding a given objective. The following scale serves as a guide for the evaluation:
• From 0% to 9%: An objective that is ignored in the PSPP;
• From 10% to 24%: An objective on which the PSPP has indirect effects; that is not tied to PSPP’s outcomes;
• From 25% to 39%: An objective that is marginally addressed by the PSPP;
• From 40% to 59%: An objective that is moderately addressed by the PSPP, the objective benefits from a certain amount of attention or applies regulatory compliance;
• From 60% to 79%: An objective that is taken into account, but still improvable;
• From 80% to 89%: The PSPP stands out by its innovations and the amount of consideration given to this objective by the choices made; and
• From 90% to 100%: The PSPP is a model of innovation regarding this given objective.
In the 2016 SDAG, the evaluation was modified with the addition of 10% graduation of scores for more accuracy.
To perform an evaluation, analysts can average their respective scores or agree on an overall score based on their discussions. Evaluations should be based on current and/or future actions documented in the material relating to the PSPP under analysis and noted in the grid.
Evaluation may be performed by the same team than weighting but it is not compulsory. The evaluation team may need more technical skills and in-depth knowledge coming from experts,
consultants or academics. However, any document supporting the evaluation must be accessible to every participant and be kept for reference in the final report. Justification of the evaluation is noted in the “Actual and projected actions”.
2.6. Actual and Projected Actions and Improvements
To comply with the dynamic principle of sustainability, during both weighting and the evaluation processes, ideas for PSPP improvement may be suggested and added. At this step, it should be done in a brainstorm format without censorship or discussion. These ideas are noted in the appropriate space in the grid. As these are integrated, the same improvement ideas can apply to more than one objective in more than one dimension. Actual and/or projected actions, as well as improvements, must be recorded in the appropriate boxes in the analysis grid. To be admitted as actual or projected action, it needs to be defined in a written description or results from a commitment from a qualified authority. These projects and commitments must be kept available at all time during the analysis process. It will further serve as a justification for action in the assessment report.
Regarding the improvements, the software generates red cells for the prioritized objectives “React” and “Act”—cf. Section2.7. A red cell implies that the analysts must identify improvements for the corresponding objective (Figure4).
Sustainability 2017, 9, 1909 10 of 28 2.6. Actual and Projected Actions and Improvements
To comply with the dynamic principle of sustainability, during both weighting and the evaluation processes, ideas for PSPP improvement may be suggested and added. At this step, it should be done in a brainstorm format without censorship or discussion. These ideas are noted in the appropriate space in the grid. As these are integrated, the same improvement ideas can apply to more than one objective in more than one dimension. Actual and/or projected actions, as well as improvements, must be recorded in the appropriate boxes in the analysis grid. To be admitted as actual or projected action, it needs to be defined in a written description or results from a commitment from a qualified authority. These projects and commitments must be kept available at all time during the analysis process. It will further serve as a justification for action in the assessment report.
Regarding the improvements, the software generates red cells for the prioritized objectives “React” and “Act”—cf. Section 2.7. A red cell implies that the analysts must identify improvements for the corresponding objective (Figure 4).
Ecological dimension: Addressing the need for quality environments and long-term availability of resources Themes Objectives Weight Eval 1 (%) Actual and projected measures ImprovementsPriorities
1Use of renewable resources
1.1 Prioritizing renewable resources 3 25 React
Figure 4. Software generates a red improvement cell in case no actual and projected measures are identified for “Act” or “React” priorities.
2.7. Results Interpretation and Analysis
To support sustainability assessment, an analysis report should be produced every time the SDAG is used. The software generates four types of results:
(1) Weighted average ratings for every dimensions and themes;
(2) Prioritization for every objective;
(3) Radar graphics for every dimensions and themes; and
(4) Priority stakes for dimensions and themes.
The spreadsheet automatically calculates all ratings; examples are provided in the case study Results Section. Equations are simple operations and can be consulted by the analysts for transparency. Ratings are first order indicators of the performance of PSPPs regarding dimensions or themes. It can be used to compare the performance between dimensions, between themes and between similar PSPPs or the same PSPP at different times or with different options. In the 2011 SDAG, a qualitative assessment rating can be obtained for a dimension or a theme:
• Below 20%: Dimension or theme is not considered in the PSPP;
• Between 20% and 39%: Dimension or theme is insufficiently considered in the PSPP;
• Between 40% and 59%: Dimension or theme is moderately considered in the PSPP;
• Between 60% and 79%: Dimension or theme is considered in the PSPP; and
• Between 80% and 100%: Dimension or theme is strongly considered in the PSPP.
That rating was changed in the 2016 SDAG for more sensitivity. Prioritizing objectives is essential to maximize the efforts in the most relevant improvement avenues. The more significant an objective is deemed to be (high weight) and the poorer its performance (low evaluation), the more urgent is the need to act and implement corrective actions. Figure 5 shows a prioritization index grid.
Figure 4. Software generates a red improvement cell in case no actual and projected measures are identified for “Act” or “React” priorities.
2.7. Results Interpretation and Analysis
To support sustainability assessment, an analysis report should be produced every time the SDAG is used. The software generates four types of results:
(1) Weighted average ratings for every dimensions and themes; (2) Prioritization for every objective;
(3) Radar graphics for every dimensions and themes; and (4) Priority stakes for dimensions and themes.
The spreadsheet automatically calculates all ratings; examples are provided in the case study Results Section. Equations are simple operations and can be consulted by the analysts for transparency. Ratings are first order indicators of the performance of PSPPs regarding dimensions or themes. It can be used to compare the performance between dimensions, between themes and between similar PSPPs or the same PSPP at different times or with different options. In the 2011 SDAG, a qualitative assessment rating can be obtained for a dimension or a theme:
• Below 20%: Dimension or theme is not considered in the PSPP;
• Between 20% and 39%: Dimension or theme is insufficiently considered in the PSPP; • Between 40% and 59%: Dimension or theme is moderately considered in the PSPP; • Between 60% and 79%: Dimension or theme is considered in the PSPP; and • Between 80% and 100%: Dimension or theme is strongly considered in the PSPP.
That rating was changed in the 2016 SDAG for more sensitivity. Prioritizing objectives is essential to maximize the efforts in the most relevant improvement avenues. The more significant an objective is deemed to be (high weight) and the poorer its performance (low evaluation), the more urgent is the need to act and implement corrective actions. Figure5shows a prioritization index grid.
Sustainability 2017, 9, 1909 11 of 28
Figure 5. Prioritization index grid: React, immediate action is needed; Act, improvements must be prioritized; Perpetuate, insure to maintain performance in the long term; Long term issue, revisit suggested improvements when priorities have been set; and No priority, suggested improvements will not significantly affect PSPP performance.
The report should finally include a list of suggested prioritized improvements. These improvements include the ones that address priority objectives (“React” and “Act”) and those that positively impact several objectives. This latter analysis must rely on a compilation and a grouping of improvements collected in the process. The software does not automatically generate a list of improvements ranked by priority. Such a list must be compiled by the analysts. Risk analysis or multi-criteria analysis can be performed to refine improvements ranking.
Weighting is qualitative and relative but it drives the assessment process, as actions linked to objectives noted “essential” will require more attention if they received only a low rating through the evaluation. As such, weighting reflects the importance of each objective as assessed by a group, whereas the evaluation speaks to the performance of a given PSPP for every objective in the SDAG, but it is the combination of both that establishes the priorities to attain SD through corrective actions. Sustainability assessment is the result of the application of the SDAG to a PSPP. In the following sections, we will present results from a recent case study using the 2011 version of the SDAG. Selected results from the study illustrate the tool potential and will be presented as material for discussion.
3. Results
This section presents selected results to support further discussion on sustainability assessment with the SDAG based on the case study of the Apatite Arnaud mine in Sept-Iles (QC, Canada). The complete results and the sustainability assessment can be found in the full report [23]. Scope of the assessment covers the effects of the project in every dimension of the SDAG referring to positive and negative impacts for the mine project’s life cycle, including mitigation measures to be implemented by the proponent and other stakeholders during mining operations, as well as landscape remediation after mining operations.
3.1. Description of the Case Study
Mine Arnaud is a mining project for an apatite deposit located within the Sept-Iles city limits in northeastern QC, Canada. In 2012, the City of Sept-Iles mandated one of its para-municipal bodies in charge of the environment (La Corporation de la protection de l’environnement de Sept-Iles (CPESI)) to search for tools to guide their development within a sustainability perspective. To do so, the CPESI chose the SDAG. A partnership with the Eco-advising Chair at UQAC was devised to guide them in their first use of the tool. The CPESI’s objective was to evaluate, in a sustainability perspective, an open-pit mining project located inside municipal boundaries. By law, the promoter produced an Environmental impact study. The city’s objective was to better equip policymakers and to inform the Figure 5. Prioritization index grid: React, immediate action is needed; Act, improvements must be prioritized; Perpetuate, insure to maintain performance in the long term; Long term issue, revisit suggested improvements when priorities have been set; and No priority, suggested improvements will not significantly affect PSPP performance.
The report should finally include a list of suggested prioritized improvements. These improvements include the ones that address priority objectives (“React” and “Act”) and those that positively impact several objectives. This latter analysis must rely on a compilation and a grouping of improvements collected in the process. The software does not automatically generate a list of improvements ranked by priority. Such a list must be compiled by the analysts. Risk analysis or multi-criteria analysis can be performed to refine improvements ranking.
Weighting is qualitative and relative but it drives the assessment process, as actions linked to objectives noted “essential” will require more attention if they received only a low rating through the evaluation. As such, weighting reflects the importance of each objective as assessed by a group, whereas the evaluation speaks to the performance of a given PSPP for every objective in the SDAG, but it is the combination of both that establishes the priorities to attain SD through corrective actions. Sustainability assessment is the result of the application of the SDAG to a PSPP. In the following sections, we will present results from a recent case study using the 2011 version of the SDAG. Selected results from the study illustrate the tool potential and will be presented as material for discussion.
3. Results
This section presents selected results to support further discussion on sustainability assessment with the SDAG based on the case study of the Apatite Arnaud mine in Sept-Iles (QC, Canada). The complete results and the sustainability assessment can be found in the full report [23]. Scope of the assessment covers the effects of the project in every dimension of the SDAG referring to positive and negative impacts for the mine project’s life cycle, including mitigation measures to be implemented by the proponent and other stakeholders during mining operations, as well as landscape remediation after mining operations.
3.1. Description of the Case Study
Mine Arnaud is a mining project for an apatite deposit located within the Sept-Iles city limits in northeastern QC, Canada. In 2012, the City of Sept-Iles mandated one of its para-municipal bodies in charge of the environment (La Corporation de la protection de l’environnement de Sept-Iles (CPESI)) to search for tools to guide their development within a sustainability perspective. To do so, the CPESI chose the SDAG. A partnership with the Eco-advising Chair at UQAC was devised to guide them
in their first use of the tool. The CPESI’s objective was to evaluate, in a sustainability perspective, an open-pit mining project located inside municipal boundaries. By law, the promoter produced an Environmental impact study. The city’s objective was to better equip policymakers and to inform the public. The Eco-advising Chair’s mandate was to support CPESI in their analysis as a capacity building exercise for municipal authorities to perform other analysis autonomously.
To perform the assessment, a Sustainable Development Assessment Committee (SDC) was formed by CPESI. The SDC was an independent committee, which included experienced professionals with various trainings, from the social, economic, environmental and municipal sectors. Once constituted, the committee members received one-day training on the SDAG. Then, the SDC members carefully read the reference documents, which included the Environmental Impact Assessment (EIA) study required by the Quebec “Loi sur la qualitéde l’environnement” (LQE) (Environmental Quality Act), documents from the promoter and others pertaining to the mining industry in general or to the project specifically. That literature covered technical, legal, social, economic and environmental topics. A research team accompanied the SDC, providing help with the weighting, keeping track of consensus weights, evaluation results and filling the grid with improvements suggested by the group members. The analysis was then produced and discussed with the committee prior to the writing of the final report presented to the City council. The final report was also filed with the Bureau d’audiences publiques sur l’environnement (BAPE) commission mandated by Quebec’s government to conduct public hearings on the project, as requested by LQE.
3.2. Weighting
For the weighting step, the SDC members individually weighted the 101 objectives prior to the meeting. Then, members of the Chair supervised the dialogues on individual weighting to define a consensus weighting for all 101 objectives. Through dialogue, members of the SDC put their own subjectivity aside to accept a consensual intersubjectivity; a step closer to objectivity in the sense of being unbiased and free from prejudices [24].
The weighting distribution (Figure6) shows that 75% of the objectives were deemed “Essential”, 21% “Important” and 4% “Desirable”. Although the weighting value “3” (Essential) is the one that is mostly attributed in all dimension, the weighting distribution is uneven from one dimension to another. For example, for the Governance dimension, 95% of the objectives were weighted to “3” (Essential) as compared to 59% in the Ethical dimension. It should also be noted that for the social and governance dimensions, no objective weighted as “Desirable”.
Sustainability 2017, 9, 1909 12 of 28
public. The Eco-advising Chair’s mandate was to support CPESI in their analysis as a capacity building exercise for municipal authorities to perform other analysis autonomously.
To perform the assessment, a Sustainable Development Assessment Committee (SDC) was formed by CPESI. The SDC was an independent committee, which included experienced professionals with various trainings, from the social, economic, environmental and municipal sectors. Once constituted, the committee members received one-day training on the SDAG. Then, the SDC members carefully read the reference documents, which included the Environmental Impact Assessment (EIA) study required by the Quebec “Loi sur la qualité de l’environnement” (LQE) (Environmental Quality Act), documents from the promoter and others pertaining to the mining industry in general or to the project specifically. That literature covered technical, legal, social, economic and environmental topics. A research team accompanied the SDC, providing help with the weighting, keeping track of consensus weights, evaluation results and filling the grid with improvements suggested by the group members. The analysis was then produced and discussed with the committee prior to the writing of the final report presented to the City council. The final report was also filed with the Bureau d’audiences publiques sur l’environnement (BAPE) commission mandated by Quebec’s government to conduct public hearings on the project, as requested by LQE. 3.2. Weighting
For the weighting step, the SDC members individually weighted the 101 objectives prior to the meeting. Then, members of the Chair supervised the dialogues on individual weighting to define a consensus weighting for all 101 objectives. Through dialogue, members of the SDC put their own subjectivity aside to accept a consensual intersubjectivity; a step closer to objectivity in the sense of being unbiased and free from prejudices [24].
The weighting distribution (Figure 6) shows that 75% of the objectives were deemed “Essential”, 21% “Important” and 4% “Desirable”. Although the weighting value “3” (Essential) is the one that is mostly attributed in all dimension, the weighting distribution is uneven from one dimension to another. For example, for the Governance dimension, 95% of the objectives were weighted to “3” (Essential) as compared to 59% in the Ethical dimension. It should also be noted that for the social and governance dimensions, no objective weighted as “Desirable”.
Figure 6. Dimensions and overall objectives weighting distribution for the Mine Arnaud project; 1, 2 or 3 refers to weighting: 1, Desirable; 2, Important; and 3, Essential.
The average weights for the five dimensions are all ≥ 2.5 (Table 1). There are no major differences between dimensions. The average weights for the 32 themes are also presented in Table 1. We note
6% 9% 0% 6% 0% 4% 35% 14% 38% 12% 5% 21% 59% 77% 63% 82% 95% 75% 0% 10% 20% 30% 40% 50% 60% 70% 80% 90% 100%
Ethical Ecological Social Economical Governance Overall 1 2 3
Weighting
Figure 6.Dimensions and overall objectives weighting distribution for the Mine Arnaud project; 1, 2 or 3 refers to weighting: 1, Desirable; 2, Important; and 3, Essential.
The average weights for the five dimensions are all≥2.5 (Table1). There are no major differences between dimensions. The average weights for the 32 themes are also presented in Table1. We note that one theme (Poverty) averages below 2 (Important). Half of the 32 themes averaged the maximum value, 3.
Table 1.Dimensions and themes’ average weight for the Mine Arnaud project.
DIMENSION/Theme Avg. Weight DIMENSION/Theme Avg. Weight
ETHICAL 2.5 ECONOMICAL 2.8
Poverty 1.7 Ownership and use of goods and capital 3
Solidarity 2.5 Quality of goods and services 2.5
Restoration and compensation 3 Responsible production and consumption 3
Originality and innovation 3 Financial viability 3
Common values 2.5 Wealth creation 2.5
ECOLOGICAL 2.7 Wealth sharing opportunities 2.3
Use of renewable resources 3 Work conditions 3
Use of non-renewable resources 3 GOVERNANCE 3
Use of energy 2.5 Management and decision-making processes 3
Outputs from human activity 3 Participation and democracy 2.8
Biodiversity 2.7 Monitoring and evaluation 3
Use of lands 2.7 Project integration 3
Pollutants globally affecting the biosphere 2 Subsidiarity 3
SOCIAL 2.6 Risk management 3
Health conditions for the overall population 2.5
Safety/security 3
Educational standards 3
Integration of individuals in society 2.5 Individual freedoms and collective responsibilities 2.4 Recognition for individuals and engagement 2.7
Culture 2.3
3.3. Evaluation
The same process as for the weighting was used for the evaluation of the objectives. This time, instead of consensus, the value for each objective was determined by averaging individual committee member’s evaluations. They based their evaluations on actual and projected actions identified in the literature. The analysts also suggested improvements for each objective to complete the evaluation (Figure7).
Sustainability 2017, 9, 1909 13 of 28 that one theme (Poverty) averages below 2 (Important). Half of the 32 themes averaged the maximum value, 3.
Table 1. Dimensions and themes’ average weight for the Mine Arnaud project.
DIMENSION/Theme Avg.
Weight DIMENSION/Theme
Avg. Weight
ETHICAL 2.5 ECONOMICAL 2.8
Poverty 1.7 Ownership and use of goods and capital 3
Solidarity 2.5 Quality of goods and services 2.5
Restoration and compensation 3 Responsible production and consumption 3 Originality and innovation 3 Financial viability 3
Common values 2.5 Wealth creation 2.5
ECOLOGICAL 2.7 Wealth sharing opportunities 2.3
Use of renewable resources 3 Work conditions 3
Use of non-renewable resources 3 GOVERNANCE 3
Use of energy 2.5 Management and decision-making processes 3 Outputs from human activity 3 Participation and democracy 2.8
Biodiversity 2.7 Monitoring and evaluation 3
Use of lands 2.7 Project integration 3
Pollutants globally affecting the biosphere 2 Subsidiarity 3
SOCIAL 2.6 Risk management 3
Health conditions for the overall population 2.5
Safety/security 3
Educational standards 3
Integration of individuals in society 2.5 Individual freedoms and collective responsibilities 2.4 Recognition for individuals and engagement 2.7
Culture 2.3
3.3. Evaluation
The same process as for the weighting was used for the evaluation of the objectives. This time, instead of consensus, the value for each objective was determined by averaging individual committee member’s evaluations. They based their evaluations on actual and projected actions identified in the literature. The analysts also suggested improvements for each objective to complete the evaluation (Figure 7).
Figure 7. Ecological dimension: Excerpt of the full evaluation for the Mine Arnaud project.
Table 2 and Figure 8 illustrate the project evaluation according to the SDC. The governance dimension obtained the highest score with 60%, while the social dimension was the lowest with 48%. The results show that the project is balanced between dimensions, but that progress is achievable in each dimension but particularly in the social dimension. The prioritized improvement list further supported this assessment of the project’s sustainability.
Figure 7.Ecological dimension: Excerpt of the full evaluation for the Mine Arnaud project.
Table2and Figure8illustrate the project evaluation according to the SDC. The governance dimension obtained the highest score with 60%, while the social dimension was the lowest with 48%. The results show that the project is balanced between dimensions, but that progress is achievable in
each dimension but particularly in the social dimension. The prioritized improvement list further supported this assessment of the project’s sustainability.
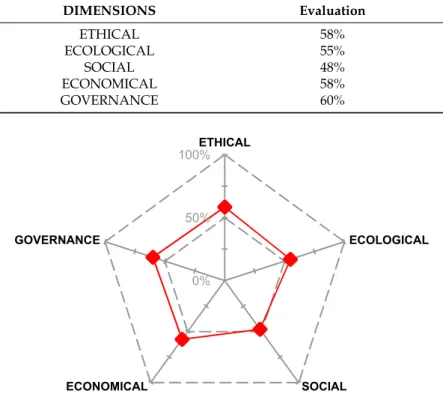
Table 2.Evaluation of the five Dimensions for the Mine Arnaud project by the Sustainable Development Assessment Committee (SDC). DIMENSIONS Evaluation ETHICAL 58% ECOLOGICAL 55% SOCIAL 48% ECONOMICAL 58% GOVERNANCE 60% Sustainability 2017, 9, 1909 14 of 28 Table 2. Evaluation of the five Dimensions for the Mine Arnaud project by the Sustainable Development Assessment Committee (SDC).
DIMENSIONS Evaluation ETHICAL 58% ECOLOGICAL 55% SOCIAL 48% ECONOMICAL 58% GOVERNANCE 60%
Figure 8. SDC’s Dimensions evaluation diagram for the Mine Arnaud project.
The graphical tools visually present the overall scores for each dimension (5) and each theme (32), as illustrated in Figure 9. Scores are performance indicators for a given PSPP. Issued from a qualitative method, they have no “scientific” or “absolute” value, but significance is based on inter-subjectivity. They can be used to compare performance between dimensions, between themes and between similar PSPP or between different options for a given PSPP.
It is also possible to comment on each dimension. Theme’s evaluation (Figure 9) also allows underlining particular strengths and weaknesses in each dimension. For example, based on the SDAG content in the ethical dimension (Figure 9A), four themes—Poverty, Solidarity, Restoration and compensation—as well as Common values have very similar evaluations, between 59% and 61%. One theme—Originality and innovation—stands apart slightly with an appreciation of 50%. Therefore, it can be said that it is moderately considered in the project according to the SDC.
The distribution of ratings is more heterogeneous in the ecological dimension (Figure 9B). The theme “Pollutants” is the weakest of the entire evaluation with 38%. On the other hand, “Energy” and “Outputs from human activity” are among those that stand out the most. In the ecological dimension, one can observe that environment characterization in the EIA and the ecosystem knowledge acquisition represents the strengths of the project. However, shortcomings too were identified, such as the non-integration of particular fields and biological areas as requested by some stakeholders. It is also possible, in the ecological dimension, to underline priority objectives “Act” and “React”. For Mine Arnaud, the promoter should “React” on two objectives: “Assessing the potential for alternatives resources” and “Planning global change adaptation measures”.
The social dimension theme’s evaluations also are unevenly distributed (Figure 9C). The two weakest themes are “Individuals integration” with 39% and “Freedom and responsibilities” with 40%. These values support the need to implement improvements for the objectives in these themes. Evaluations of economic themes are more homogeneous (Figure 9D). Except for the “Responsible
0% 50% 100%ETHICAL ECOLOGICAL SOCIAL ECONOMICAL GOVERNANCE
Figure 8.SDC’s Dimensions evaluation diagram for the Mine Arnaud project.
The graphical tools visually present the overall scores for each dimension (5) and each theme (32), as illustrated in Figure9. Scores are performance indicators for a given PSPP. Issued from a qualitative method, they have no “scientific” or “absolute” value, but significance is based on inter-subjectivity. They can be used to compare performance between dimensions, between themes and between similar PSPP or between different options for a given PSPP.
It is also possible to comment on each dimension. Theme’s evaluation (Figure9) also allows underlining particular strengths and weaknesses in each dimension. For example, based on the SDAG content in the ethical dimension (Figure9A), four themes—Poverty, Solidarity, Restoration and compensation—as well as Common values have very similar evaluations, between 59% and 61%. One theme—Originality and innovation—stands apart slightly with an appreciation of 50%. Therefore, it can be said that it is moderately considered in the project according to the SDC.
The distribution of ratings is more heterogeneous in the ecological dimension (Figure 9B). The theme “Pollutants” is the weakest of the entire evaluation with 38%. On the other hand, “Energy” and “Outputs from human activity” are among those that stand out the most. In the ecological dimension, one can observe that environment characterization in the EIA and the ecosystem knowledge acquisition represents the strengths of the project. However, shortcomings too were identified, such as the non-integration of particular fields and biological areas as requested by some stakeholders. It is also possible, in the ecological dimension, to underline priority objectives “Act” and “React”. For Mine Arnaud, the promoter should “React” on two objectives: “Assessing the potential for alternatives resources” and “Planning global change adaptation measures”.
The social dimension theme’s evaluations also are unevenly distributed (Figure9C). The two weakest themes are “Individuals integration” with 39% and “Freedom and responsibilities” with
40%. These values support the need to implement improvements for the objectives in these themes. Evaluations of economic themes are more homogeneous (Figure 9D). Except for the “Responsible production and consumption” theme, which scored 47%, there is no big differences between the other themes with “Wealth creation” and “Work conditions” that are the highest with 62%. Finally, the governance theme’s evaluations are all close to the average of the dimension (60%), as shown in Figure 9E. One theme, “Risk management”, underperformed with 53% while four themes—Participation and democracy, Monitoring and evaluation, PSPP integration, Subsidiarity—scored above 60%.
Sustainability 2017, 9, 1909 15 of 28 production and consumption” theme, which scored 47%, there is no big differences between the other themes with “Wealth creation” and “Work conditions” that are the highest with 62%. Finally, the governance theme’s evaluations are all close to the average of the dimension (60%), as shown in Figure 9E. One theme, “Risk management”, underperformed with 53% while four themes— Participation and democracy, Monitoring and evaluation, PSPP integration, Subsidiarity—scored above 60%. (A) (B) (C) 0% 50% 100%Poverty Solidarity Restoration and compensation Originality and innovation Common values 0% 50% 100% Renewable resources Non-renewable resources Energy Outputs from human activity Biodiversity Land use Pollutants 0% 50% 100%Health Safety/security Education Individuals integration Freedom and responsibilities Recognition Culture Figure 9.Cont.
(D)
(E)
Figure 9. Diagrams for each evaluated theme: (A) Ethical dimension; (B) Ecological dimension; (C) Social dimension; (D) Economical dimension; and (E) Governance dimension, for the Mine Arnaud project.
3.4. Priorities
As mentioned in Section 2.7, assigning priority among the objectives is essential. The juxtaposition of weight and performance of an objective indicates the level of priority for implementation of corrective actions.
Figure 10 shows distribution of priorities for the entire evaluation (Figure 10A) and for each dimension—Figure 10B, Ethical; Figure 10C, Ecological; Figure 10D, Social; Figure 10E, Economical; and Figure 10F, Governance. The overall distribution reveals that, for half the objectives, the promoter should implement improvements—priorities Act and React—and that, for 6% of these, implementation is urgent. Only 4% are long term issues and the remaining 46% are to be perpetuated, meaning that actual and projected measures are achieving the objectives. Dimension’s distribution is a visual guide allowing to see where the high priorities are. For example, 71% of the objectives of the social dimension should be improved upon for the project to be more sustainable. On the other hand, only 23% of the ethical dimension’s objectives should be improved. However, as will be discussed in the next section, improvements can affect multiple dimensions.
0% 50% 100% Ownership, goods and capital Quality of goods and services Responsible production and consumption Financial viability Wealth creation Wealth sharing Work conditions 0% 50% 100% Decision-making Participation and democracy Monitoring and evaluation PSPP integration Subsidiarity Risk management
Figure 9. Diagrams for each evaluated theme: (A) Ethical dimension; (B) Ecological dimension; (C) Social dimension; (D) Economical dimension; and (E) Governance dimension, for the Mine Arnaud project.
3.4. Priorities
As mentioned in Section2.7, assigning priority among the objectives is essential. The juxtaposition of weight and performance of an objective indicates the level of priority for implementation of corrective actions.
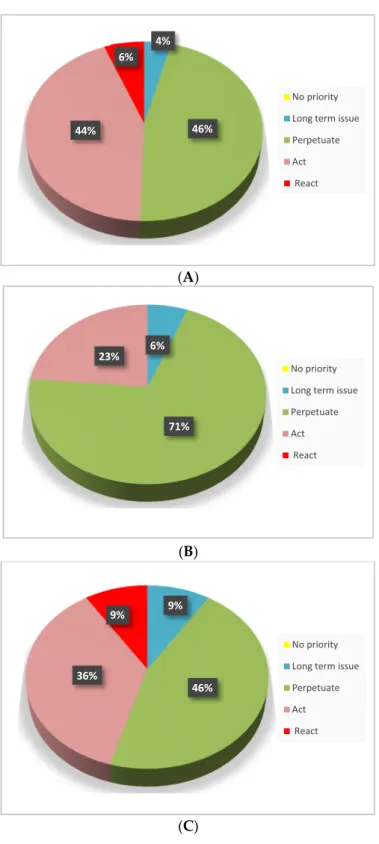
Figure10shows distribution of priorities for the entire evaluation (Figure10A) and for each dimension—Figure10B, Ethical; Figure10C, Ecological; Figure10D, Social; Figure10E, Economical; and Figure10F, Governance. The overall distribution reveals that, for half the objectives, the promoter should implement improvements—priorities Act and React—and that, for 6% of these, implementation is urgent. Only 4% are long term issues and the remaining 46% are to be perpetuated, meaning that actual and projected measures are achieving the objectives. Dimension’s distribution is a visual guide allowing to see where the high priorities are. For example, 71% of the objectives of the social dimension should be improved upon for the project to be more sustainable. On the other hand, only 23% of the ethical dimension’s objectives should be improved. However, as will be discussed in the next section, improvements can affect multiple dimensions.
Sustainability 2017, 9, 1909 17 of 28 (A) (B) (C) 4% 46% 44% 6% No priority Long term issue Perpetuate Act React 6% 71% 23% No priority Long term issue Perpetuate Act React 9% 46% 36% 9% No priority Long term issue Perpetuate Act React
(D)
(E)
(F)
Figure 10. Distribution of priorities for the Mine Arnaud Project: (A) overall; and for the: (B) Ethical dimension; (C) Ecological dimension; (D) Social dimension; (E) Economical dimension; and (F) Governance dimension.
Results illustrated in Figures 6–10 and Tables 1 and 2 are first order outputs. To deepen the sustainability assessment, more steps must be performed after the analysis process. The Chair’s research team furthered the analysis and discussed their results with the SDC before the final report was issued.
After the analysis of the Mine Arnaud project, priority improvements were suggested and directed to stakeholders for consideration. The analysts listed thirteen multidimensional and priority improvements that can be summarize into the followings:
21%
71% 8%
No priority Long term issue Perpetuate Act React 6% 41% 47% 6% No priority Long term issue Perpetuate Act React 62% 33% 5% No priority Long term issue Perpetuate Act React
Figure 10.Distribution of priorities for the Mine Arnaud Project: (A) overall; and for the: (B) Ethical dimension; (C) Ecological dimension; (D) Social dimension; (E) Economical dimension; and (F) Governance dimension.
Results illustrated in Figures6–10and Tables1and2are first order outputs. To deepen the sustainability assessment, more steps must be performed after the analysis process. The Chair’s