Volume 21 | Issue 4 Article 4
2012
Systems Dynamics Modeling for Collaboration
and Information Sharing on Supply Chain
Performance and Value Creation
Frank Lin
California State University San Bernardino Conrad Shayo
California State University San Bernardino
Follow this and additional works at:http://scholarworks.lib.csusb.edu/jitim
Part of theManagement Information Systems Commons
This Article is brought to you for free and open access by CSUSB ScholarWorks. It has been accepted for inclusion in Journal of International Technology and Information Management by an authorized administrator of CSUSB ScholarWorks. For more information, please contact
Recommended Citation
Lin, Frank and Shayo, Conrad (2012) "Systems Dynamics Modeling for Collaboration and Information Sharing on Supply Chain Performance and Value Creation,"Journal of International Technology and Information Management: Vol. 21: Iss. 4, Article 4. Available at:http://scholarworks.lib.csusb.edu/jitim/vol21/iss4/4
Systems Dynamics Modeling for Collaboration and Information
Sharing on Supply Chain Performance and Value Creation
Frank Lin Conrad Shayo
California State University San Bernardino USA
ABSTRACT
Collaborations among various parties of the supply chain system are becoming more important in improving performance and creating value. Information sharing plays a vital role in supply chain management. This study proposes a general model for identifying interrelationships among information sharing, collaboration and supply chain performance. Then a systems dynamics approach is used to examine how information sharing and collaboration influence supply chain performance and value creation.
INTRODUCTION
In order to confront the challenges of the global and dynamic-changing environment, enterprises need to focus on their core competency and outsource gradually (Kessler, McGinnis, Bennett, Makins, Nagao, & Bennett, 2012). More organizations are realizing that improving their internal efficiency is not enough; instead, they have to strengthen their external relationships with key suppliers and customers (Özatağan, 2011). This means, firms must share timely and accurate information to improve their supply chain performance benefits i.e., increased sales and decreased inventory holding and carrying costs ( Li, Rao, Ragu-Nathan, & Ragu-Nathan, 2005).
A Supply chain is a process which consists of product design, material procurement, product manufacturing and distribution to end users, after-sales support, and end-of-life disposal (Swaminathan & Tayur, 2003). Byrne and Heavey (2006) identify that supply chain management is the management of a product design process. It controls both material and information flows within and between organizations.
Information sharing plays a vital role in supply chain management (Byrne & Heavey, 2006). According to Li and Lin (2006), suppliers, manufacturers, distributors, and customers need to share information to coordinate the supply chain. By sharing up-to-date information with supply chain members, enterprises can speed up information transfer and respond to customers’ needs more quickly. Lin, Huang, and Lin (2002) also illustrate that information sharing can assist organizations in reducing lead time and in turn, deliver high-quality products to customers faster. Few research studies have investigated collaboration, supply chain performance, and information sharing among partnering firms. Most of the research focuses on interrelationships between various dimensions of supply chain performance using survey or multivariate analysis (Lin et al., 2002; Li et al., 2005; Li & Lin, 2006). However, few papers investigate the various dimensions that influence supply chain performance ( Fynesa, Vossb, & Burca, 2005). Moreover, most
empirical studies lack a theoretical framework for considering the effects of collaboration and information sharing simultaneously on supply chain performance.
To investigate the dimensions, this study applies systems dynamics to examine how information sharing and collaboration influences supply chain performance. We review the literature to extract and define variables related to information sharing, collaboration, and supply chain performance. Then, we develop a new framework and use it to systematically analyze the relationship between collaboration, information sharing, and supply chain performance. Next, results and discussions of the framework are given to demonstrate feasibility of the methodology. An enterprise can therefore optimize its supply chain performance associated with the model.
The remainder of the paper is organized as follows. The next section reviews literature pertaining to supply chain management, information sharing, and systems dynamics. This is followed by the research methodology and results analysis are found in the following sections. Finally, this paper summarizes the findings in the conclusion, and future research work is considered.
REVIEW OF THE LITERATURE
Supply Chain Management
The advance of information technology and globalization have brought enterprises both competitive advantages as well as threats ( Thakkar, Kanda, & Deshmukh, 2008). In order to achieve effective management of supply chain (SC) and competitive advantage, some supply chain management (SCM) practices, such as collaboration and information sharing, should be emphasized and embraced in organizations (Li et al., 2005).
SCM is a collaborative effort and a combination of cross-functional teams to provide customers with value-added products (Thakkar et al. 2008). Whipple and Russell (2007) define collaboration as two or more companies working together, sharing and exchanging real-time information, and making joint decisions. Furthermore, Koha, Gunasekaranb, and Rajkumarc (2008) illustrate that collaborative information sharing needs effective partnerships to conduct meaningful information exchange. Li et al. (2005) further delineate that close relationships with customers has become crucial for a company’s survival. Thus, a company can differentiate its products or services from competitors and offer customers more valuable products.
Li et al. (2005) state that when an organization has a long-term relationship with its suppliers, they collaborate with each other in order to make decisions and achieve significant benefits. Suppliers’ early involvements in a product design process can help an organization design and produce cost-effective products. Kim, Yamada, and Kim (2008) also point out that it is important for firms to consider collaborations with suppliers in a sourcing process, which focuses on maximizing efficiency in the long run. Moreover, being collaborative with partners helps a company increase sales, forecast customer demands more accurately, share higher quality information, reduce inventory costs, as well as improve customers’ satisfactions (Whipple & Russell, 2007).
Information Sharing
Buyers and suppliers can collaborate with each other and create more value for SC members by sharing transactional and strategic information (Klein & Rai, 2009). Pereira (2009) and Li and Lin (2006) also illustrate that in order to be competitive, companies need to make the latest information available at every node and share it with their partners. Lin et al. (2002) depict that organizations use internet protocol and public telecommunication systems to communicate information to suppliers, customers, and other business entities in order to exchange data, share product catalogs and news of common interest, as well as jointly develop training programs.
Seidmann and Sundararajan (1998) and Lin et al. (2002) identify four levels of information sharing among organizations: the interchange of order information, exchange of operational information, strategic information sharing, and finally strategic and competition information sharing. Klein and Rai (2009) view the first level as a routine transaction. The latter three classes are perceived as strategic information as they can be exchanged in logistics relationships. In the first level, companies share order information by electronic data interchange or other technology. This information aids companies in decreasing order cycle times and inventory levels. In the second level, one party has available strategic information, such as inventory or capacity plans and production schedules. When shared, the other party can apply the information to streamline buffers and optimize resource allocations. Strategic information sharing (the third level) indicates that when one party has valuable information, the other party can analyze the information to generate economic/operational benefits and leverage financial resources. For instance, suppliers can forecast demands more accurately when retailers provide them with point-of-sales information (Liu & Kumar 2011; Prajogo & Olhager, 2012; Tokar, Aloysius, Waller, & Williams,
2011). Lastly, suppliers can be more competitive in the market when buyers offer sales and demand information of a competitor’s products.
Furthermore, some advantages and disadvantages of companies sharing information have been identified by prior studies. Fiala (2005) posits that one source of inefficiency in supply side results from information asymmetry. Ozbayrak et al. (2007) depict that demand uncertainty and variability pose threats to SC performance. For example, the bullwhip effect can cause inefficiency in organizations. It is a phenomenon that small or modest variations in demands are amplified from downstream retailers to upstream suppliers (Yu, Ting, & Chen, 2010). This causes huge SC costs. However, by sharing information with partners, companies can build a synergic supply chain. Pereira (2009) explains that collaborations with partners by sharing information will increase information flows, decrease customer uncertainty and variability, generate a higher profitable supply chain, and deliver customers products with high quality quickly.
Many scholars have examined interrelationships between IS and SC performance. For instance, Ouyang (2007) discusses the impact of IS on the bullwhip effect. The result shows that inventory variance has significant influence on the bullwhip effect. Suppliers prefer to increase steady-state inventory level during peak seasons. For example, in order for an enterprise to optimize its operation condition with the minimum total cost, Shukla et al. (2010) utilized the simulation, Taguchi method, non-linear regression analysis, and the Psycho-clonal algorithm. On top of that, Yu et al. (2010) mention that although many studies have stated IS can increase SC performance,
only few researchers have discussed how to combine different sources of IS methodologies in order to improve performance of SC. Therefore, Yu et al. (2010) applied data envelopment analysis to help companies determine the most appropriate IS system for their partners.
Even though some of the studies the interrelationships among IS, SC, and collaboration, most researchers assume several hypotheses and then use multivariate analysis to identify the interrelationships. For instance, Li and Lin (2006) assumed that IS and information quality (IQ) were influenced by certain factors, such as customer, supplier, technology uncertainty, top management support, as well as trust or other inter-organization relationships. The authors adopted multiple regression analysis to examine whether these factors affected the IS and IQ. Similarly, Li et al. (2005) utilized the data equation modeling to investigate the impact of six dimensions of SC practices (strategic supplier partnership, customer relationship, IS, IQ, internal practices, and postponement) on delivery and time to market.
In brief, some researchers have studied the interrelationships between IS and SC performance, or collaboration and SC performance. Yet few studies have conducted the interrelationships among IS, collaboration, and SC performance simultaneously. In addition, even if several scholars investigate the relationships among the three variables, most of them utilize multivariate analysis for their studies. Compared to their studies, this research applies systems dynamics to explore the interrelationships.
Systems Dynamics
Forrester in the 1960s in the Massachusetts Institute of Technology invented a new methodology, called systems dynamics (SD) (Galanakis, 2006). This methodology combines concepts of decision making, information flow and feedback, simulation, as well as policy; it can be used to study and model complex problems or systems. The purpose of this methodology is to offer a holistic view of a system and to examine interrelationships among a number of key variables within the system (Ozbayrak et al. 2007). Fiala (2005) also depicts by changing some variables, SD analyzes a system’s result similar to the reference mode, which is a system’s pattern of behavior over time.
In SD, two models need to be discussed. The first one is the influence diagram (casual loop diagram), which captures the hypotheses regarding factors influencing SD. Variables are seldom independent as they usually have one-way correlations. However, this influence diagram does not include stock and flow structure within a system (Dangelico et al., 2010). The second model is the rate and level diagram (stock and flow structure). Ozbayrak et al. (2007) indicate that the rate and level diagram is a modeling process, which converts from the influence diagram, using a SD program. Dangelico et al. (2010) further explain that variables in this diagram can be accumulated (stocks). By giving a system policy, which represents formulas set for systems, the rate of each stock will increase or decrease (flows) in a time period.
Moreover, in the influence diagram arrows represent casual influence. According to Figure 1, as a1 changes, a2 will change in the same direction. On the other hand, changes of b1 will cause b2 to change in an opposite direction. That is, increasing (decreasing) a1 leads to the increase (decrease) of a2. Similarly, increasing (decreasing) b1 results in the decreased (increased) b2. In
the rate and level diagram, stocks indicate accumulated flows, such as inventory of a product. Inflows increase an accumulation of a stock, while outflows reduce an accumulation of a stock (Galanakis, 2006; Dangelico et al., 2010). Furthermore, if there is a difference between processes of inflow and outflow, the stocks, such as orders and cash, will be delayed.
Figure 1: Casual influence.
Finally, this research applies the concept of Ozbayrak et al. (2007), who applied SD in a manufacturing supply chain system. The authors studied system performance under an initial condition and compared it with performances under eight different scenarios. The SC performance includes inventory, customer satisfaction, backlogged orders, and work-in-process levels. Compared to the study of Ozbayrak et al. (2007), this research has two differences. First, the purpose of this study is to provide a general model to identify relationships among SC performance, IS, and collaboration; on the other hand, their model focuses on SC performance in the manufacturing industry. Second, this study examines inventory level and customer fulfillment rate by changing variables associated with lead time, which is influenced by IS. Their research assumes that there is no demand uncertainty through real time IS. However, it is more reasonable to assume that the demand order follows normal distributions.
METHODOLOGY
This study proposes a general analytical model using the Vensim® PLE software for identifying the relationship among IS, SCM, and collaboration. The model can be used in any industry. Based on literature review, Fiala (2005) delineates that collaboration can increase information flows, reduce uncertainty, and create a synergistic SC. As more and more SC members collaborate with each other, they will share more information. Furthermore, Li and Lin (2006) and Lin et al. (2002) posit that IS will reduce lead time. By changing variables pertaining to lead time, this study examines the influence of IS on inventory level and customer fulfillment rate.
In this section, the influence diagram is constructed first in order to understand interrelationships among different variables. Then, the influence diagram is converted into the rate and level diagram to clearly simulate effects of IS and collaboration on the inventory level and customer fulfillment rate.
Influence diagram
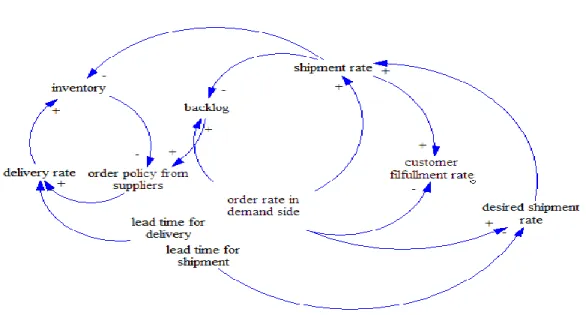
This influence diagram examines the interrelationships among various variables. As each variable is seldom independent; it may influence other variables, which, in turn, affect other variables further. Most of the influences usually move in one direction, causing a loop at the end, as shown in Figure 2.
Figure 2: The influence diagram.
As displayed in Figure 2, this influence diagram can be divided into two parts. The first part represents that as an organization orders more goods from suppliers, the delivery rate will be higher. The delivery rate has a positive correlation with inventory. The higher the delivery rate is, the more likely the inventory will increase. However, there is a negative relationship between inventory and order policy. If an organization has enough inventories to satisfy demands, it does not have to order additional orders from its suppliers.
The second part in Figure 2 begins with the “order rate in demand side” state. With increase in the number of customer orders, an organization has more desire to deliver the goods to the customers (i.e., the desired number of shipments will be higher) which leads to a higher shipment rate. What’s more, the backlog is the difference between the shipment rate and the order rate in demand side. There is a negative relationship between the shipment rate and the backlog, while the relationship between the order rate in demand side and the backlog is positive. On top of that, as the lead time for shipment or delivery increases, the desired shipment rate and delivery rate will decrease. Finally, the more the shipment rate is, the higher the customer fulfillment rate is; however, the customer fulfillment rate decreases as the order rate in demand side increases.
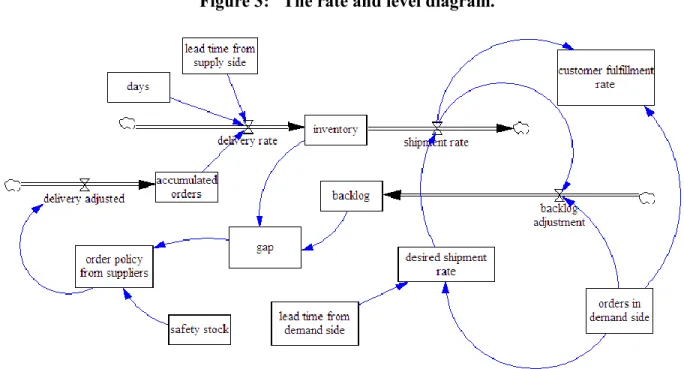
Rate and Level Diagram
The influence diagram is converted into the rate and level diagram (Figure 3). Based on some models (Lin et al., 2002; Li & Lin, 2006; Saeed, 2009), formulas are identified and revised for the purpose of this study. This model had been reviewed by practitioners and researchers. The system was simulated for 52 days using Vensim® PLE. The orders in demand side (i.e., the customers’ orders) and the lead times for delivery and shipment follow normal distributions. Moreover, each inventory is replenished to pre-defined safety stock and orders are from external sources.
shipment rate. The ‘desired shipment rate’ is calculated by taking the ‘orders in demand side’
divided by the ‘lead time from demand side.’ The variable ‘orders in demand side’ is defined as the customers’ order rate per day. Moreover, the backlog should be negative; thus, the ‘gap’ is the sum of the ‘inventory’ and the ‘backlog.’ By subtracting the gap from the safety stock, the result depicts the order policy from suppliers, which is the number of orders that an organization has to order every day. Last but not least, the delivery rate is the accumulated orders over days and the lead time from supply side.
Figure 3: The rate and level diagram.
SIMULATION RESULTS
In this system, a normal condition is first given to serve as a benchmark for comparing the system’s inventory level and the customer fulfillment rate in different scenarios. The lead times from supply and demand sides, as well as the orders in demand side are assumed to follow normal distributions. By changing the average and standard deviation of each of the two variables (the lead times from supply and demand sides), the system’s level and the customer fulfillment rate will change accordingly.
The initial setting of the normal condition is shown in Table 1. The average and standard deviation of the lead time from supply side are three days and two, while those in lead time from demand side are four days and two. In the settings of the customers’ orders, the average is 98 percent and standard deviation is two.
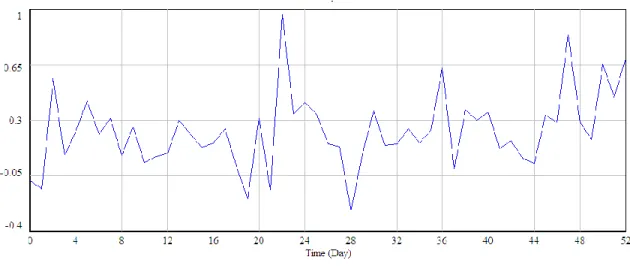
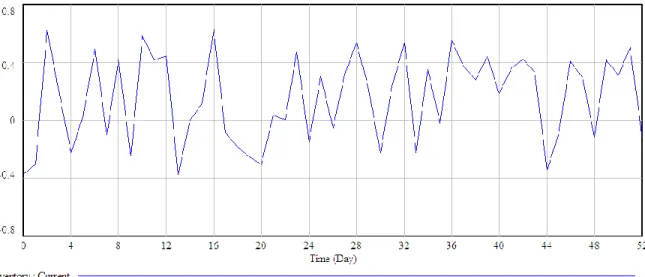
The inventory level and the customer fulfillment rate are displayed in Figure 3 and Figure 4. Most inventory levels are above zero, but few are below zero, indicating that there are some deliveries delayed during the period. This leads to lower shipment rate to customers and further decreases the customer fulfillment rate (Figure 4). As Figure 5 suggests, the customer fulfillment rate ranges from 0.2 to 0.6. Because customers’ goods cannot be shipped in a timely manner (the
shipment rate decreases), backlogs occur, which in turn causes an organization to order more from suppliers.
Table 1: Initial Setting.
Parameter Value Safety stock 7000 (units)
Lead time from supply side RANDOM NORMAL ( 1, 5, 3, 2, 0) (days) Lead time from demand side RANDOM NORMAL (1, 6, 4, 2, 0) (days) Orders in demand side RANDOM NORMAL (0, 1, 0.98, 2, 0)
Figure 4: Inventory level under normal condition.
Moreover, as illustrated in Figure 4 and Figure 5, when inventory gradually increases (or decreases) steadily each day, the customer fulfillment rate will decrease (or increase). For example, inventory decreases from day 3 to day 10, and the customer fulfillment rate increases during this period. If customers order goods from a company, when there is inventory on hand, goods can be shipped to customers in a timely manner. In this scenario, the customer fulfillment rate will be higher.
Collaboration facilitates supply chain members in sharing more information with each other. By sharing information, companies can respond to customers more quickly. Therefore, the lead time will be reduced. Another condition is given by changing the lead times from supplier and demand sides in order to examine the influence on inventory level and the customer fulfillment rate. The parameter settings are outlined in Table 2. The average of the lead time from supply side is two days; the standard deviation remains the same as under the normal condition. The average lead time from demand side is one and a half days; the standard deviation is also unchanged. The settings of the safety stock and the orders in demand side remain the same.
Table 2: Parameter Settings by Changing Lead Times.
Parameter Value Safety stock 7000 (units)
Lead time from supply side RANDOM NORMAL( 1, 2, 2, 2, 0) (days) Lead time from demand side RANDOM NORMAL(1, 3, 1.5, 2, 0) (days) Orders in demand side RANDOM NORMAL(0, 1, 0.98, 2, 0)
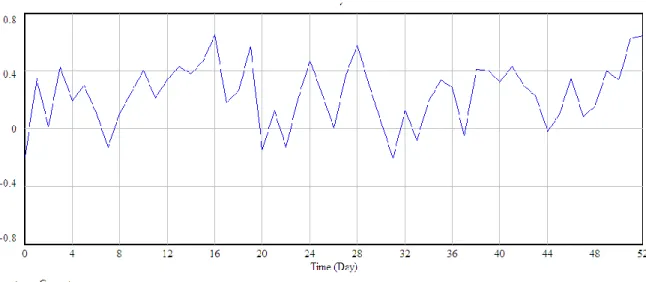
The inventory level and customer fulfillment rate are displayed in Figure 6 and Figure. 7. As Figure 7 suggests, the inventory level is lower and fluctuates less than that under the normal condition (Figure 3). Furthermore, the customer fulfillment rate ranges from 0.4 to 0.8, which is higher than the result under the normal condition. This result is supported by the research of Ozbayrak et al. (2007). As a result, IS does aid a company in managing its inventory more properly and thereby enhancing the customer fulfillment rate.
Figure 7: The customer fulfillment rate resulting from changes of lead times.
DISCUSSION
To achieve 100 percent customer fulfillment rate (Figure 8), some parameters should be revised, as illustrated in Table 3. The lead times from supply and demand sides are not assumed to fit a normal distribution. Rather, in this study we assume they should be one day (meaning that there is no information delay). The safety stock and orders in demand side remain unchanged.
As described in Figure 9, the inventory level fluctuates more than that shown in Figure 6. There are some late deliveries from suppliers because of negative inventory levels. In order to maintain 100 percent customer fulfillment rate, a company has to order products or materials from suppliers more frequently, which may result in more ordering costs. Thus, the company has to reconsider its ordering and inventory control policies while in order to avoid having too many holding costs for inventories.
Table 3: Parameter Settings When Customer Fulfillment is 100 Percent.
Parameter Value Safety stock 7000 (units) Lead time from supply side 1 (day) Lead time from demand side 1 (day)
Orders in demand side RANDOM NORMAL(0, 1 , 0.98 , 2, 0)
Figure 9: Inventory level when customer fulfillment is 100 percent.
CONCLUSION AND FUTURE RESEARCH
A general model for identifying interrelationships among IS, collaboration, and SC performance has been proposed in this study. The SD approach used in the research can analyze complex situations, especially in a collaborative SC environment. Based on the literature review, we conclude that companies need to collaborate with their partners by sharing transactional and strategic information. Valuable information exchange has an impact on the two SC performance metrics used in this study: i.e., it leads to time reduction, which in turn impacts inventory levels and the customer fulfillment rate.
A benchmark model was first given under normal conditions to compare the system’s inventory level and customer fulfillment rate in different scenarios. By changing the parameters of the lead times both from supply and demand sides, the system’s results were then compared to those under normal conditions. The conclusions of the study are illustrated in the following paragraphs.
When sharing and exchanging information, companies have more instant and accurate information pertaining to customers’ orders and needs. Lead times from supply and demand sides will thus decrease. This lean SC system can create value for customers. Manufacturers can design products based on customers’ needs and wants. Suppliers can then deliver raw materials to manufacturers more quickly. The raw materials are then transformed into customer-based products. Finally, distributors can ship finished goods to retailers or end-user customers in a
timely manner.
Since companies can share instant information with each other, they are able to allocate their internal resources immediately. More specifically, once customers demand orders from a retailer or distributor, who in turn posts the information on its enterprise resource planning system or other telecommunication systems shared with the partners, SC members with the updated information can check their inventory at hand immediately. If they have enough inventory, they can ship products to downstream retailers or customers. If not, they can call suppliers for more products. As a result, every company ensures that they have enough inventories for customers’ orders. In addition, shipping products to customers at the right time and place will lead to increased customer fulfillment rate.
MIT is noteworthy that Ozbayrak et al. (2007)assumed that operational decisions are determined based on actual customer demand rather than predicted demand. Their study also mentioned that the assumption was based on the organizational use of communication and computer technology. However, in this study, customers’ orders follow normal distributions. It is more reasonable to assume normal distributions because even if companies use information systems and share valuable information with SC members, they still cannot predict demands very accurately.
Finally, this study is a pioneer in modeling and analyzing interrelationships among IS, collaboration, and SC performance using SD. Future research can apply our suggested approach to different industries. Moreover, a collaborative SC environment, trust is also an important issue. Before sharing available information, companies need to build trust with each other. Future research can focus more on the trust issue.
REFERENCES
Byrne, P. J., & Havey, C. (2006). The impact of information sharing and forecasting in capacitated industrial supply chains: a case study. International Journal of Production Economics, 103, 420-437.
Dangelico, R. M., Garavelli, A. C., & Petruzzelli, A. M. (2010). A system dynamics model to analyze technology districts' evolution in a nowledge-based perspective. Technovation, 30, 142-153.
Fiala, P. (2005). Information sharing in supply chains. Omega, 33, 419-423.
Fynesa, B., Vossb, C., & Burca, S. D. (2005). The impact of supply chain relationship quality on quality performance. International Journal Production Economics, 96, 339-354.
Galanakis, K. (2006). Innovation process: Make sense using systems thinking. Technovation, 26, 1222-1232.
Kessler, W., McGinnis, L., Bennett, N., Makins, Q., Nagao, D., & Bennett, N. (2012). Enterprise alignment and inertia risks during transformation. Information Knowledge
Kim, S. K., Yamada, T., & Kim, H. (2008). Search for alternatives and collaboration with incumbents: two-sided sourcing behavior in business markets. Decision Sciences, 39, 85-114.
Klein, R., & Rai, A. (2009). Interfirm strategic information flows in logistics supply chain relationships. MIS Quarterly, 33, 735-762.
Koha, S. C. L., Gunasekaranb, A., & Rajkumarc, D. (2008). ERP II: The involvement, benefits and impediments of collaborative information sharing. International Journal of Production Economics, 113, 245-268.
Li, S., & Lin, B. (2006). Accessing information sharing and information quality in supply chain management. Decision Support Systems, 42, 1641-1656.
Li, S., Rao, S. S., Ragu-Nathan, T. S., & Ragu-Nathan, B. (2005). Development and validation of a measurement instrument for studying supply chain management practices. Journal of Operations Management, 23, 618-641.
Lin, F. R., Huang, S. H., & Lin, S. C. (2002). Effects of information sharing on supply chain performance in electronic commerce. IEEE Transactions on Engineering Management, 49, 258-268.
Liu, R., & Kumar, A. (2011). Leveraging Information Sharing to Configure Supply Chains,"
Information Systems Frontiers, 13, 139-151.
Ouyang, Y. (2007). The effect of information sharing on supply chain stability and the bullwhip effect. European Journal of Operational Research, 182, 1107-1121.
Özatağan, G. (2011). Dynamics of Value Chain Governance: Increasing Supplier Competence and Changing Power Relations in the Periphery of Automotive Production-Evidence from Bursa, Turkey. European Planning Studies, 2011, 19, 77-95.
Ozbayrak, M., Papadopoulou, T. C., & Melek, A. (2007). Systems dynamics modeling of a manufacturing supply chain system. Simulation Modelling Practice and Theory, 15, 1338-1355.
Pereira, J. V. (2009). The new supply chain's frontier: Information management. International Journal of Information Management, 29, 372-379.
Prajogo, D., & Olhager, J. (2012). Supply chain integration and performance: The effects of long-term relationships, information technology and sharing, and logistics integration.
International Journal of Production Economics, 135, 514-522.
Saeed, K. (2009). Can trend forecasting improve stability in supply chains? A response to Forrester's challenge in Appendix L of Industrial Dynamics. System Dynamics Review, 25, 63-78.
Seidmann, A., & Sundararajan, A. (1998). Sharing logistics information across organizations: Technology, competition and contracting, in Information Technology and Industrial Competitiveness: How IT Shapes Competition, Kemerer, C. F., Ed. Boston, MA: Kluwer.
Shukla, S. K., Tiwari, M. K., Wana, H. D., & Shankar, R. (2010). Optimization of the supply chain network: Simulation, Taguchi, and Psychoclonal algorithm embedded approach.
Computers & Industrial Engineering, 58, 29-39.
Swaminathan, J. M., & Tayur, S. R. (2003). Models for supply chains in e-business.
Management Science, 49, 1387-1406.
Thakkar, J., Kanda, A., & Deshmukh, S. G. (2008). A conceptual role interaction model for supply chain management in SMEs. Journal of Small Business and Enterprise Development, 15, 1, 74-95.
Tokar, T., Aloysius, J. A., Waller, M. A., & Williams, B. D. (2011). Retail promotions and information sharing in the supply chain: a controlled experiment. International Journal of Logistics Management, 22, 5-25
Whipple, J. M., & Russell, D. (2007). Building supply chain collaboration: a typology of collaborative approaches. The International Journal of Logistics Management, 18, 2, 174-196.
Yu, M. M., Ting, S. C., & Chen, M. C. (2010). Evaluating the cross-efficiency of information sharing in supply chains. Expert Systems with Applications, 37, 2891-2897.
COMMUNICATIONS Frank Lin [email protected] (909) 537-5701 Conrad Shayo [email protected] (909) 537-5798