POLICY RESEARCH WORKING
PAPER
2604
Eliminating Excessive Tariffs
Average most-favored-nationtariffs in the "Quad" (Canada,
on Exports of Least
the European Union, Japan,Developed
Countries
and the United States) havefallen to about 5 percent. But tariffs more than three times
Bernard Hoekman the average
most-favored-Francis Ng nation duty are not
Marcelo Olarreaga uncommon in the Quad and
have a disproportionate effect on exports of least developed countries. Giving the poorest countries duty-free access for peak-tariff products would increase their total annual exports by roughly $2.5 billion.
The World Bank
Development Research Group
Trade
May 2001
Public Disclosure Authorized
Public Disclosure Authorized
Public Disclosure Authorized
POLICY RESEARCH WORKING PAPER 2604
Summary findings
Most goods imported from developing countries enter increase their total annual exports by 11 percent-or Quad markets duty-free, and average tariffs in Quad roughly $2.5 billion. Exports to Quad countries of peak-markets are very low. But tariffs for some commodities tariff products would expand by 30-60 percent.
are over 100 percent. Such "tariff peaks" are often Considering that peak-tariff items account for only a concentrated in products developing countries want to small share of developing countries' exports, granting export: agricultural and food products-especially such least developed countries duty-free access would have staples as sugar, cereals, and fish; fruits and vegetables; only a negligible impact on other developing countries. food products with a high sugar content; and tobacco For the same reason, Quad imports increase only and alcoholic beverages-and products from such labor- marginally, suggesting that this factor should not intensive sectors as apparel and footwear. constrain implementation of duty-free access for the
Giving least developed countries full duty- and quota- poorest countries. free access in the Quad for peak-tariff products would
This paper-a product of Trade, Development Research Group-is part of a larger effort in the group to analyze impediments to developing country export growth. Copies of the paper are available free from the World Bank, 1818 H Street NW, Washington, DC 20433. Please contact Lili Tabada, room MC3-333, telephone 202-473-6896, fax 202-522-1159, email address [email protected]. Policy Research Working Papers are also posted on the Web at http:// econ.worldbank.org. The authors may be contacted at [email protected], [email protected], or [email protected]. May 2001. (51 pages)
Phe
Policy Research Working Paper Series disseminates the fndings of work in progress to encourage the exchange of ideas about
developmnent issues. Air objective of tbe series is to get the findings out quickly, even if the presentations are less than fully polisbed. The papers carry the names of the authors and should be cited accordingly. The findings, interpretations, and conclusions expressed in this paper are entirely those of the authors. They do not necessarily represent the view of the World Bank, its Executive Directors, or t.he countries they represent.
Eliminating Excessive Tariffs on Exports
of Least Developed Countries*
Bernard Hoekmantf Francis Ngt Marcelo Olarreagatt
JEL: F13, F14, 019
Keywords: Market access, least developed countries, trade preferences
* We are grateful to Ataman Aksoy, Uri Dadush, Elena lanchovichina, William Martin, Aaditya Mattoo, and participants in a trade semninar at the World Bank for helpful discussions and suggestions; to Gerard Durand, Alice Enders, Daniel Morales, and Javier Suarez for valuable advice and data on tariffs; and to Lili Tabada for excellent assistance.
Development Research Group, World Bank, 1818 H Street, NW, Washington, DC, USA. Centre for Economic Policy Research, London, UK.
Introduction
Average most-favored-nation (MFN) tariffs in the Quad (Canada, the EU, Japan and the US) have fallen to about 5 percent. Given that the Quad grant developing countries preferential access to their markets through the General System of Preferences (GSP) and related schemes, as well as reciprocal trade agreements such as NAFTA or the Euro-Mediterranean Partnership Agreements, the majority of goods imported from developing countries enters into Quad markets on a duty-free basis.' Despite the low average MFN and preferential tariff rates that apply in developed countries, tariffs for some commodities are over 100 percent. Such tariff peaks are often concentrated in products that are of export interest to developing countries. They include major agricultural staple food products, such as sugar, cereals and fish; tobacco and certain alcoholic beverages; fruits and vegetables; food industry products with a high sugar content, clothing and footwear. The Uruguay Round of multilateral trade negotiations actually increased tariff dispersion, as tariffication of non-tariff barriers (NTBs) in agriculture led to the imposition of high duties on agricultural products that had previously been quota constrained (Hoekman and Kostecki, 2001). As a result, tariffs that are more than three times higher than the average MFN duty are not uncommon in the Quad.
In many cases where there are tariff peaks, preferences tend to be limited, in that 'sensitive' products are excluded from the schemes or some type of quantitative limitation is imposed, either in terms of the amount that can be imported under the preferential rates (a tariff rate quota) or in terms of the countries that are eligible (Michalopoulos, 1999, Hallaert, 2000). Moreover, the tariff structure of developed countries shows significant tariff escalation, so that market access for more processed products (embodying greater value added) is more restricted. For example, fully-processed manufacturing food products face tariffs twice as large as products in the first-stage of processing in the EU and Japan, with final goods confronting an average MFN tariff of 24 and 65 percent, respectively. In Canada the ratio is even higher: tariffs on fully-processed food products are 12 times higher than for l" stage processed products
' Both GSP and North-South FTAs give rise to trade diversion. This will benefit some developing countries, but hurt others.
(the MFN tariff on fually processed is 42 percent).2 The existence of duty-drawback systems for Quad-based exporters and the fact that GSP preferences in the Quad are more likely to be granted for products with low MFN tariffs (see below), reinforces the degree of escalation, as some imports of semi-processed products or raw materials are exempted from duties when used as inputs in export production.
This paper assesses the potential effects on the value and the pattern of trade from implementing initiatives to grant least developed countries (LDCs) duty free access for tariff peak items in Quad markets.3 The paper is motivated by recent proposals of the Commission of the European Communities to provide LDCs with free access to the EU for all products except arns. We investigate what implementation of this proposal by all Quad countries would mean for LDCs. The paper focuses on tariff peaks only-tariffs below 15 percent are ignored. We do this for a number of reasons. First, peaks affect commodities that are of relatively greater importance for LDCs than other developing countries-they account for a larger share of total LDC exports. Second, from a political economy point of view this is where the 'action' is-these are the products with the highest protection in the Quad. Third, moving beyond tariff peaks to consider elimination of all tariffs on all imports from LDCs requires the use of a computable general
equilibrium model of the world economy. Although such tools are readily available, they do not allow a detailed and disaggregated analysis of the effect of liberalization at the product and country level. As we are interested in determining the likely impact of duty-free access on the pattern and composition of trade, we use a partial equilibrium
approach. By limiting our focus to tariff peaks-which account for only a small share of total trade of most countries-such an approach is unlikely to lead to misleading
conclusions.4
We do not quantify the effect of remaining NTBs-the focus is solely on tariffs and tariff preferences. NTBs are relatively unimportant in the Quad-only 1.2 percent of tariff lines are subject to NTBs in Canada, 4.2 percent in Europe, 2.6 in Japan and 2.9 in the US (OECD, 1997a). However, they do apply to a sector that is of great interest to
2Figures are from WTO Trade Policy Reviews of Quad countries.
3 We use the United Nations definition of LDCs. This comprises the 48 countries listed in Table 7 below. 4 See lanchovichina, Mattoo and Olarreaga (2000) for a CGE-based estimate of the gains for Sub-Saharan Africa of unrestricted market access for all goods in the Quad.
developing countries-clothing-which is still constrained by quotas. By ignoring these quotas and the associated rents, our analysis underestimates the potential export response by LDCs following duty-free access for tariff peak products. However, given that the WTO Agreement on Textiles and Clothing requires that remaining quotas are to be removed no later than 2005, in the medium term what matters are the tariff preferences. As any duty free access initiative will in all likelihood take some time to be implemented, ignoring textiles and clothing quotas should not have major implications for our results. In the case of agriculture, the Uruguay Round led to tariffication of all NTBs in the Quad (with the exception of rice in Japan). Although tariff rate quotas are often used, these involve two-tier tariff systems, with out of quota imports subject to higher tariffs. In this paper we use out of quota tariffs as the appropriate measure of protection, which may lead to an overestimate of the effects of duty-free access. Specific tariffs-frequently used for agricultural products in the Quad-have been converted into ad valorem equivalents using OECD data (OECD, 1997a; 2000).
The paper is structured as follows. We start with a description of the extent and importance of existing tariff peaks in the Quad (Section 1); the preferential treatment granted to developing countries for these tariff peaks products (Section 2) and the prevailing pattern of developing country exports (Section 3).5 We then assess the possible impact of granting duty free access for tariff peak items to the Quad for LDCs, using partial equilibrium simulation methods (Section 4). Section 5 concludes.
1
Tariff peaks and imports in Quad
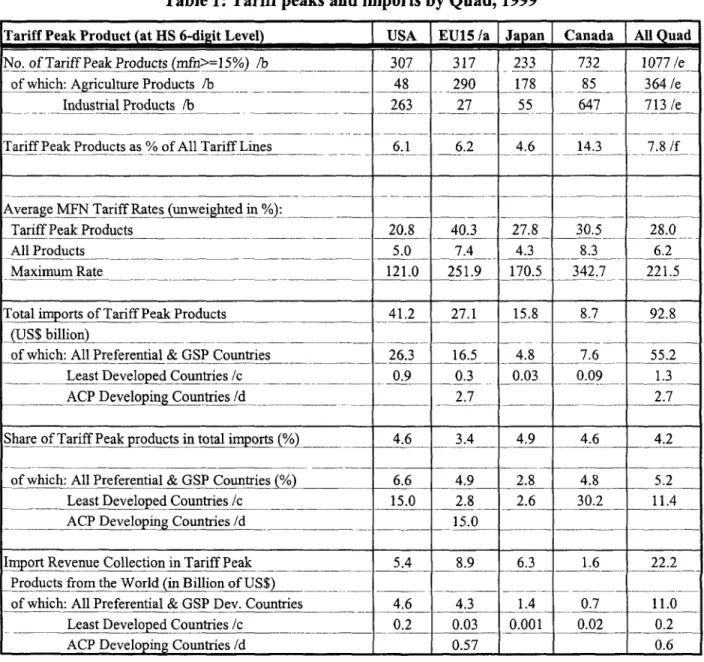
Between 6 and 14 percent of Quad tariff lines at the 6-digit of the Harmonized System (HS) are above 15 percent (Table 1).6 There are 200 to 300 such lines in the US, the EU and Japan, whereas Canada has more than 700 tariff peaks. The average tariff in the Quad over all tariff peak products is 28 percent, or 4.5 times the unweighted total average tariff of 6.2 percent. The highest average tariff for peak products is found in the EU with an average of 40.3 percent (compared to an average of 7.4 percent for all products). In the
s Under preferential treatment we include both unilateral schemes such as GSP, Lome or LDC preferences, and those granted under bilateral agreements, such as NAFTA, Canada-Chile and the Euro-Med
agreements.
US and Canada, most of the tariff peaks are in industrial products (over 85 percent), whereas in the EU and Japan most peaks affect agricultural products (91 and 77 percent). The maximum tariff rate at the 6-digit level of aggregation in Canada, the EU, Japan and the US, respectively, applies to butter (340 percent), edible bovine offal (250 percent), raw cane sugar (170 percent) and ground nuts in shell (120 percent).
Total imports of products subject to tariff peaks in the Quad in 1999 was $92.8 billion. More than 60 percent of Quad imports of these products originate in developing countries (55.2/92.8-see Table 1) and potentially face an average tariff of 28 percent.7 This represents around 5 percent of total developing countries exports to the Quad. LDC exports are disproportionately affected by tariff peaks in the Quad-products subject to tariff peaks represent 15 to 30 percent of total exports to the US, EU and Canada. Up to $22 billion of tariff revenue may be collected on these tariff peak items by Quad countries, half of which is contributed by developing country exporters (including those with preferential treatment); LDC exporters may pay up to $200 million in tariff revenue, in spite of their preferences.
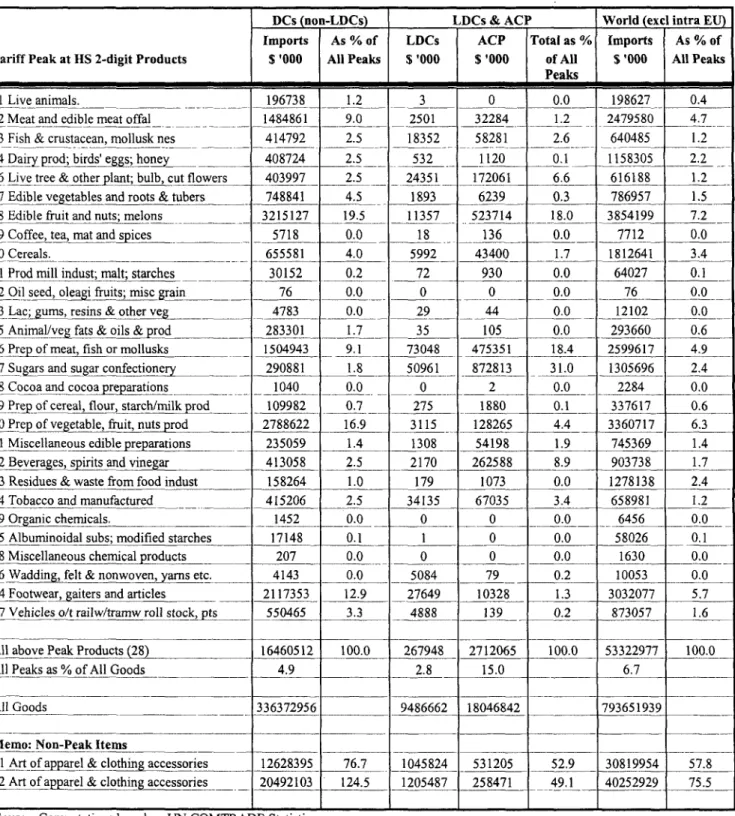
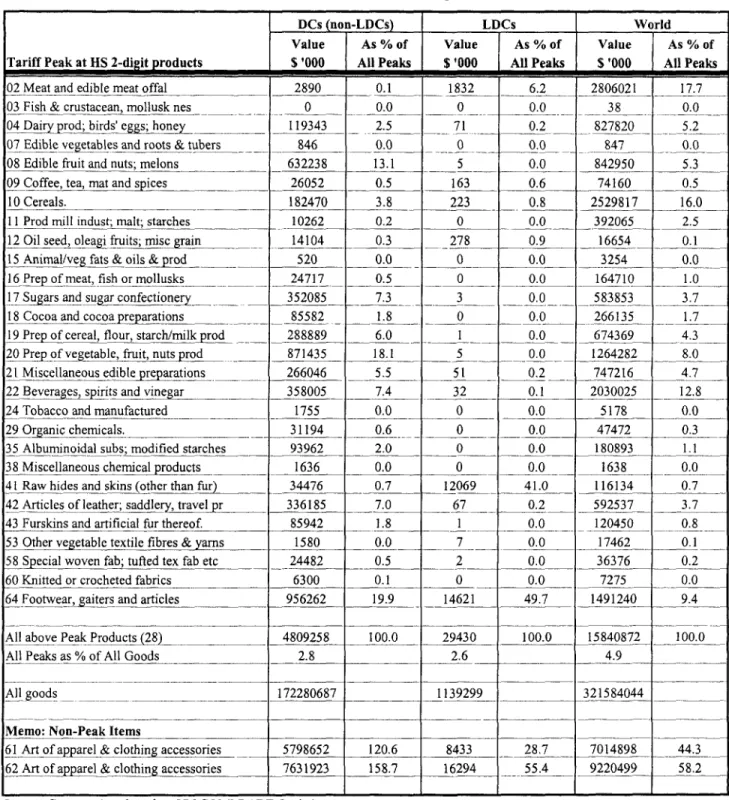
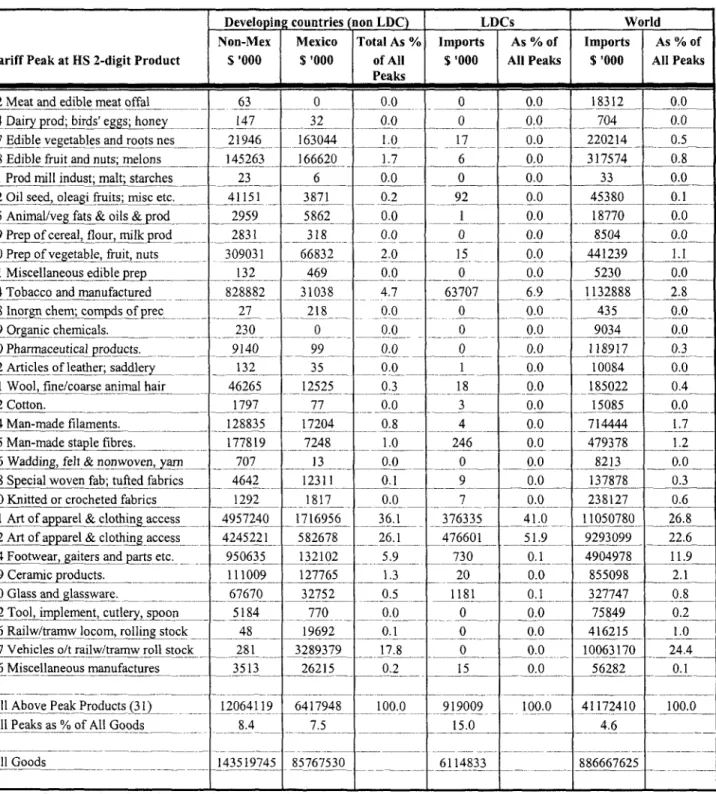
Tables 2a-d provide a more detailed description of Quad imports of peak products from developing countries at the HS 2 digit level. The trade values reported correspond only to imports of products with tariffs above 15 percent at the 6 digit level for each of the 2 digit categories. In the US and Canada, the largest import category subject to tariff peaks is apparel: more than 90 percent of LDC exports of tariff peak products to the US and Canada occur in HS 61 and 62 (apparel and clothing). For developing countries in general, clothing and footwear represent more than 60 percent of exports of tariff peak products to the Quad. Exports of clothing to the EU and Japan are also relatively large, but these products are not tariff peak items in either market. Most developing country exports of tariff peak products to the EU and Japan occur in agriculture, food products and footwear.
7 "Potentially" because tariff preferences granted to developing countries through bilateral or unilateral schemes will bring down the tariff faced by these exporters.
Table 1: Tariff peaks and imports by Quad, 1999
Tariff Peak Product (at HS 6-digit Level) USA EU15 /a Japan Canada All Quad
No.ofTariffPeakProducts(mfn>-15%) lb _ 307_ 317 233 732 1077/e
of which: Agriculture Products /b 48 290 178 85 364 /e
Industrial Products /b 263 27 55 __ 647 713 /e
Tariff Peak Products as % of All Tariff Lines ____ 6.1 _ 6.2 4.6 14.3 7.8 /f
Average MFN Tariff Rates (unweighted in °/-):
Tariff Peak Products ____ _ ___ 20.8 40.3 27.8 30.5 28.0
All Products _ _ _ ___ 5.0 7.4 4.3 8.3 6.2
Maximum Rate ______________ 121.0 251.9 _170.5 342.7 221.5
Total imports of Tariff Peak Products 41.2 27.1 15.8 __8.7 92.8
-(US$ billion) ____ _________
of which: All Preferential & GSP Countries _ 26.3 16.5 _ 4.8 7.6 55.2
Least Developed Countries /c _ __ 0.9 _ 0.3 0.03 0.09 1.3
ACP Developing Countries /d 2.7 2.7
Share of Tariff Peak products in total imports (%) ___ 4.6 3.4 4.9 4.6 4.2
of which: All Preferential & GSP Countries (%) 6.6 4.9 2.8 4.8 5.2
_ Least Developed Countries /c _ 15.0 2.8 2.6 30.2 11.4
_ ACP Developing Countries /d _ _ 15.0 ___ _
Import Revenue Collection in Tariff Peak 5.4 8.9 6.3 1.6 22.2
Products from the World (in Billion of US$) ____ __
of which: All Preferential & GSP Dev. Countries 4.6 4.3 1.4 0.7 11.0
___ Least Developed Countries /c 0.2 0.03 0.001 0.02 0.2
ACP Developing Countries /d 0.57 0.6
Notes: /a Excludes all EU intra trade in world totals
lb No overlapping items in the Quad aggregates
/c Based on the United Nations classification of 48 countries
/d Based on fourth Lornm Convention for 59 Africa, Caribbean and Pacific (ACP) low income countries. Includes a large number of LDCs.
/e Number of non-overlapping categories.
/f This is the simple (unweighted) average across Quad countries. Note that of the 5032 tariff lines at the 6 digit level of the Harmonized System, 21 percent (1077/5032) includes a tariff peak item in at least one Quad member.
Table 2a: Canadian Tariff Peak Imports by HS 2-digit (1 996-98 average)
Tariff Peak at
MS
2-diRit ProductAll Peaks $ '000 All Peaks $ '000 FAll Peaks01 Live animrals. 134 0.0 0 -- 0.0 25118
-0.3--02 Meat and edible meat offal 120.0- 0 0.0116718 1.3,
04Diypo;birds' egg~s; o~ 9653 0.3 12 0.0 227028 2_6 _
06 Live tree & olther pat; biulb, cut flowers 38432 _1I 3 - 0-.0- -- 50659 -0.6
08 Edible fruit and nuts; melons 0 00 0 - 0.0 2000
10 Cereals-.- - 2937 01. -0 0.0 --- 6482 0.2
I I Prod miill indust; mialt; starches 649 0.0 -- 0--- 0.0 1651 1 0.2 12 Oil seed, oleagi fruits; misc gran 0 0.0 0 0.0 - -0 0.0 13 Lac; ums, ~resins & other ~veg_____ 0 0.0 0 0.0 3 0.0 15 Animalvegfats & ol&prd ________ _14003 0.4_5 0.0 67360 0.8 l6Prepofmeat, fishormollusks _______ ~16 0.0 0 -0.0 ___ 111379 1.3
17 Sugam confectionery and sugar ~~~~~0 0.0O 0 0.0 _ 76 0.0 18 Cocoa and cocmgpeparton ___ 1500.3 __ 12 0.0 225982 __ 2.6 19 Prep of cereal, flour, starch/milk prod ___ 2583 0.1 1 0--.0 109161 1.3_ _
20 ?rep of vegetble, fruis usrd 8454 0.2 4 001-1073 O.1 21 Miscellaneous ediblekrearationis __21007 0__.6 17 0.0 3-33050 _3.8 22 Bevemges, spirnts and viegar -- ____ 5573 0.2 1 0.0 116947 __ 1.3 23 Residues & waste from food indust ___ 8333 . 0.2 148 -, 0.2 141109 __ - 1.6
24 Tobacco and mranufactured _______ 313 0.0 0 0.0 10187 _ . 33 Essential oils&rcesinoids, perf. 197 0.0 1 0.0 81149 0.9__ 35 Alburninoidal suLbs; modified starches 110 0.0 0 0.0 5602 0.1 39 Plastics and articles thereof. 36479 1.0 151 0.2 396692 4.6 40 Rubber and articles thereof. 35795 1.0 85 0.1 _ 100675 1.2 42_Articles of lea ther;saddlery, ntavetpr. ___ __ B08267 3.0 45 0.1 118978 1.4 43 Furskins and artificial fur thereof 9796 0.3 7 0.0 17308 0.2 51 Wool, fine/coasie animnal hair nes 32530 0.9 9 0.0 87919 1.0
52 Cotton. ____51587 1.4 26 0.0 241263 __ 2.8
53 Othervegetabl textil fibres yarns ________ 2193 0.1I 0 0.0 4220 0.0
54 Man-made filaments. 79183 2.2 1 0.0 249164 2.9
55 Man-made stape ibes _ ____ _ ___ 98053 2.7 60 0.1 272819 3.1
56 Wadn,fl owvn an t.9119 0.3 15 00240986 2.
57Cqarpsand ot~hertextile floor covenngs 71_Tl48 _ _0.2 176 0.2 66718 0.8 58_~pecial woven fab; tufted tex fab etc ___ 22818 0.6 1 1 0.0 106245 1.2
59 Imregnate, ~coated, ~cover/laminated 1128 0.4 1 0.0 164554 1.9 60 Knitted or crocheted fabrics _____ 78072 2.2 2 0.0 247784 2.9
61 Art ces____ 76272 _fpae&cohn 20.9 34576 3 8.9 1134671 _13.1 62 Artof aprl&cohnaces_____ 1068566 29.6 50355 56.6 1502785 17.3 63 Other made up textilce articles __ ___ 141153 3.9 1410 1.6 414617 4.8
64 Footwear, giesadatcs_____ 606225 16.8 141 0.2 859968 9.9
65 Headgear and parts thereof. 4650 1.1 1559 1.8 56996 0.7 67 Prepr feathems & down; art flower nes 2629 0.1 89 0.1 3727 0.0 689Artofsatonie, plaster,cemenit,asbestos 0 0.0 0 0.0 177 0.
70 Glass and_glssware. ___ 150 0.0 0 0.0 44277 0.5
85 Electrical mech_equi prt_ sunpr171068 -4.7 2 0-.0 392525 4.5 86_Railw/tramw locom,rr lin toket. _______ 700 _ 0 0.0 _ 22473 0.3 89 Ships, boats and floating structures _________ 53387 1.5 0 0.0 73031 0.8
91 Clocks and watches and parts ns _______ 8740 0.2 9 _ 0.0 13005 . .... 0.1I 94 Furniture; bedding, mattress, cushion __ 16789 0.5 1 0.0 54570 0.6
95 Toys, games & sportsm reuisites, nes 26841 0.7 0 0.0 54440 __ 0.6
96 Miscellaneous manufactured articles ______ 10824 0.3 4 0.0 75004 0.9
All above Pcak Products ~50 ____ 3612335 100.0 88940 100.0 8683203 -100.0 All Peaks as % of All Goods 12.1 ___ 30.2 ______ 4.6
All goods 29735968 _______ 294206 _______ 189663049
Table 2b: European Union Tariff Peak Imports by HS 2-digit (1 996-1998 average)
DCs (no Cs) LDCs & ACP World (exi intra EU)
Imports As % of LDCs ACP (Total as % Imports
TAs
% ofTariff Peak at US 2-digit Products $ '000 All Peaks $ '000 $ '000 of All $ '000 All Peaks
LPeaks-01 Live animals. ___196738 1.2 3 0 0.0 198627 0.4
02 Meat and edible meat offal 1484861 9.0 2501 32284 1.2 2479580 4.7
03 Fish & crustacean, mollusk nes 414792 2.5 18352 58281 2.6 640485 1.2
04 Dairy pro; , birds' egs; holly 408724 2.5 532 1120 0.1 __ 1158305 _ _2.2
06 Live tree & otherjplant; bulb, cut flowers 403997 2.5 24351 172061 6.6 616188 1.2
07_Edible yegetables and roots & tubers -748841 4.5 1893 6239 0.3 786957 1.5
08_Edible fruit and nuts; melons 3215127 19.5 11357 523714 18.0 3854199 7.2
09 Coffee, tea, mat and spices 5718 0.0 18 136 0.0 7712 0.0
1 0 Cereals. ____ 655581 4.0 5992 43400 1.7 1812641 3.4
I1I_Prod mill indust; malt; starches 30152 0.2 72 930 0.0 64027 0.1
12 Oil seed, oleagi fruits; misc grain __ -- 76 0.0 0 0 0.0 76 -0.0
13 Lac; gums, resins & other yeg 4783 0.0 29 44 0.0 12102 0.0
15 Animal/veg fats & oils & prod -283301 __1.7 _ 35 105 0.0 293660 0.
16 Prjepometfihr mollusks 1504943 9.1 73048 475351 18.4 2599617 4.9
17 Sugms and suga cfctoey290881 1.8 50961-- 872813 3 1.0- 1305696 2.4
18 Cocoa and cocoa preparations__ ____ 1040 0.0 _ 0 2 0.0 2284 0.0
19 Prep) of cereal, flour, starchlmilk prd109982 0.7 27 80 01_ 337617 0.6
20 Prep of vegetable, fruit, nuts prod 2788622 16.9 3115 128265 4.4 3360717 6.3
21 Miscellaneous edible prepaaios235059 1.4 1308 54198 1.9 745369 1.4
22_Bevrgs prtsadvngr413058 2.5 2170 262588 8.9 903738 1.7
23 Residues & waste from food indust 158264 1.0 179 1073 0.0 1278138 2.4
24 Tobacco and manufactured 415206 2.5 34135 67035 3.4 658981 1.2
29 Organic chemiucals. 1452 0.0 0 0 0.0 6456 0.0
35 Alburninoidal subs; modified starches 17148 0.1 1 0 0.0 58026 0.1
38 Miscellaneous chemical products ____ 207 0.0 0 0 0.0 1630 0.0
56 Wadding, felt & nonwoven, yarns etc. 4143 0.0 5084 79 _ 0.2 10053 0.
64 Footwear, gaiters and articles 2117353 12.9 27649 10328 1.3 3032077 5.7
87 Vehicles o/t railw/tramw roll stock, pts__ 550465 3.3 4888 139 0.2 873057 1.6
All above Peak Products (28) 16460512 100.0 267948 2712065 100.0 53322977 100.0
All Peaks as % of All Goods ______ 4.9 _____ 2.8 15.0 ____ 6.7 ___
All Goods ___ ____ 336372956 ____ 9486662 18046842 793651939 ___
Memo: Non-Peak Items
61 Art of apparel & clothn acsoies 12628395 76.7 1045824 531205 52.9 30819954 57.8 62 Art of apparel&cltin ccsore 20492103 124.5 1205487 258471 49.1 40252929 75.5
Table 2c: Japan's Tariff Peak Imports by HS 2-digit Product (1996-98 average)
DCs (non-LDCs) LDCs World
Value] As % of Value As % of Value As %of
Tariff Peak at HS 2-digit products $ '000 | All Peaks $ '000 All Peaks $ '000 All Peaks
02 Meat and edible meat offal 2890 0.1 1832 6.2 2806021 17.7
03_Fish & crustacean, mollusk nes 0 0.0 00 _ 0.0 _ 38 0.0
04 Dairy popd; birds eggs; honey__ 119343 _ 2.5 71 0.2 _ _- 827820 5.2
07 Edible vet_ables and roots & tubers 846 0.0 0 0.0 _847 - _° 0.0
08 Edible fruit and nuts; melons 632238 13.1 5 0.0 842950 5.3
09 Coffee, tea, mat and spices 26052 0.5 163 0.6 74160 0.5
10 Cereals. 182470 3.8 223 0.8 2529817 16.0
11 Prod mill indust; malt; starches 10262 0.2 0 0.0 392065 2.5
12 Oil seed, oleagi fruits; misc grain 14104 0.3 278 0.9 16654 0.1
15 Animal/yeg fats & oils & prod __ 520 0.0 0 | 0.0 3254 0.0
16 Prep of meat, fish or mollusks 24717 0.5 0 0.0 164710 1.0
17 Sugars and sugarconfectioney 352085 7.3 3 0.0 583853 3.7
_8 Cocoa andcocoapreparations 85582 1.8 0 0.0 266135 1.7
19 Prep of cereal, flour, starch/-ilk prod 288889 6.0 1 0.0 674369 4.3
20rep-ofegetable, fruit,nutsprod 871435 18.1 5 0.0 1264282 8.0
21 Miscellaneous edible preparations 266046 5.5 51 0.2 747216 4.7
22 Beverages, spirits and vinear 358005 7.4 32 0.1 2030025 12.8
24 Tobacco and manufactured 1755 0.0 0 0.0 5178 0.0
29ganic chemicals. 31194 0.6 0 0.0 47472 0.3
35 Albuminoidal subs; modified starches 93962 2.0 0 0.0 180893 1.1
38 Miscellaneous chemical products 1636 0.0 0 0.0 _ 1638 0.0
41_Raw hides and skins (other than fur) 34476 0.7 12069 41.0 116134 0.7
42 Articles of leather; saddlery, travel pr 336185 7.0 _ 67 _ 0.2 592537 3.7
43 Furskins and artificial fur thereof 85942 1.8 __ 1 _ 0.0 120450 0.8
53 Other vegetable textile fibres & yarns 1580 0.0 7 0.0 17462 0.1
58 Special woven fab; tufted tex fab etc 24482 0.5 2 0.0 36376 0.2
60 Knitted or crocheted fabrics _ 6300 0.1 0 0.0 7275 0.0
64 Footwear, gaiters and articles 956262 19.9 14621 49.7 1491240 9.4
All above Peak Products 28 4809258 100.0 29430 100.0 15840872 100.0
All Peaks as % of All Goods ___ 2.8 2.6 4.9
All goods _X _ 172280687 1139299 _ __ 321584044 _
-Memo: Non-Peak Items
61 Art of apparel& clothin accessories 5798652 120.6 8433 28.7 7014898 44.3
62 Art of & clothin accessories 7631923 158.7 16294 55.4 9220499 58.2
Table 2d: United States Tariff Peak Imports by HS 2-digit (1996-98 average)
1Developin
countries (non LDC) LDCs World_______________________ NonMex_Meico Peak s Imot As%f Iprs As f
Tariff Peak at HS 2-digit Product S '000 $ '000 of All $ '000 All Peaks $ '000 All Peaks
02 Meat and edible meat offal 63 - 0 --- -0.0 0 0.0 18312
__0.0-04 Dairy prod; birds' e~s, k(onqy _ 1 47 -- 32 0 0. 0 0.0- 704 0.0
07 Edible vegetables and roots nes __ 21946 163044 1.0 _ 17 0.0 _ 220214 _ 0.5
08_Edible fruit and nuts; melons 145263 166620 -1.7 6 - 0.0 _ 317574 0.8
1 1 Prod mill indust; malt;_starches ___ 23 6 0-.0 0_ 0.0 33 0.0
12 Oil seed, oleagi fruits; misc etc. 41151 _ 3871 __ -0.2.- _ --92 _ 0.0 453,80 0.1I
15 Animal/veg fats & oils &prod 2959 5862 0.0 I 0.0 _ 18770 0.0
o9Pepf cereal, flour, milk_prd 2831 318- 0.0 0- 0.0 _ 8504 0---.0O
20 Prep of vegetable, fruit, nuts 309031 66832 _ 2.0 1_ 15 0.0 441239 1.1
21 Miscellaneous edible prep -- __ 132 469 0.0 0 0.0 5230 0.0
24 Tobacco and manufactured 828882 31038 _4.7 _ 63707 6.9 1132888 2.8
28 Inorgn chem;_compdsof prec - -- 27 218 _ 0.0 _- 0 -0.0 435 0.0
29 Organic chemicals. __230 0 0.0 __ 0 0.0 9034 0.0
30 Pharmaceutical- mioducts, -9140 99 0.0 0.__ 0.0.- 18-917- 0.3
42 Articles of leather; sadd1ery_ _ 132 35 _ 0.0 I 0.0 10084 0.0
51_Wool, fine/coarse animal hair 46265- 12525 _ 0 O-.3 10.1822 0.4
52_Cotton. 1797 _ 77 0.0 __3 0.0 15085
0.0-54 Man-made filaments.__ ____ 128835 17204 0.8- 4 0. 0 714444 1.7
55 Man-made staple fibres. 177819 7248 _ _1.0 246 0.0 479378 1.2
6Waddijng, felt & nonwoven,-y4rn _ 707- 13 _ 0. 0 0.0 8230.0
58 Special woven fab; tufted fabrics __ 4642 12311 0.1 9 0.0 137878 0.3
60 Knitted or crocheted fabrics 1292 1817 __0.0 ___ 7 0.0 238127 0.6
61 Art of apparel &clothing access - 4957240 1716956 36.1 _ 376335 41.0 11050780 26.8
62 Art of apparel & c1tigaccess -_ 4245221 582678 26.1 476601 51.9 9293099 __22.6
64 Footwear,gaiters and partsetc.___- 950635 .- 1321-02 -. ,-5.9 --- 730 0.1 OA -4904978 11.9
69 Cerami roducts. __ 111009 127765 1.3 _ 20 0.0 855098 2.1
70 Glass and_glassware. -_ 67670 32752 -~0.5 _ 11-81- 0.1 327747 0.8
82 Tool, implement,cutlery, soon 5184 _ 770 --.0-.0 - -0 -0.0 75849 0.2
86 Railw/tramw locom, rojllng stock 48 19692 0.1 __ 0 0.0 416215 1.0
87 Vehicles o/t railw/tramw roll stock _ 21 3289379 17.8 0 0.0. 10063170 __24.4
96 Miscellaneous manufactures 3513 _ 26215 0,2 _ 15 0.0 56282 0.1
AllAbovePeakProducts_(31) _12064119 6417948 100.0 919009 __100.0 41172410 100.0
All Peaks as % of All Goods 8.4 7.5 15.0 __ 4.6
All Goods _143519745 85767530 6114833 886667625
2
Tariff peaks and developing country preferences
Most developing countries enjoy preferential access to Quad markets, either through unilateral schemes such as the GSP, or through free trade agreements such as NAFTA or EU Association Agreements. In the case of Canada, Japan and the EU, around 170 developing countries benefit from GSP (or better) preferences. In the case of the US, 29 developing countries are excluded from GSP, so that only 140 developing countries benefit from some sort of preferential access.
Preferences granted by the Quad are of a cascading nature-countries with FTAs generally get the best treatment, followed by LDCs and other developing countries. The US grants preferences to the members of the Andean Pact (ATP) and the Caribbean (CAR), and to Mexico under NAFTA.9 For the EU, we report both Lome preferences (ACP), and the FTA preferences granted to Eastern Europe and Mediterranean countries. Note that in the case of the EU three different groups of countries are constructed: LDCs that are not ACP members; ACP countries (broken down into LDC and non-LDC countries); and non-ACP, non-LDC developing countries that benefit from GSP treatment. Finally, in the case of Canada, developing countries are grouped into those benefiting from LDC, GSP, or Caribbean preferences, and Mexico and Chile, that benefit from FTAs.
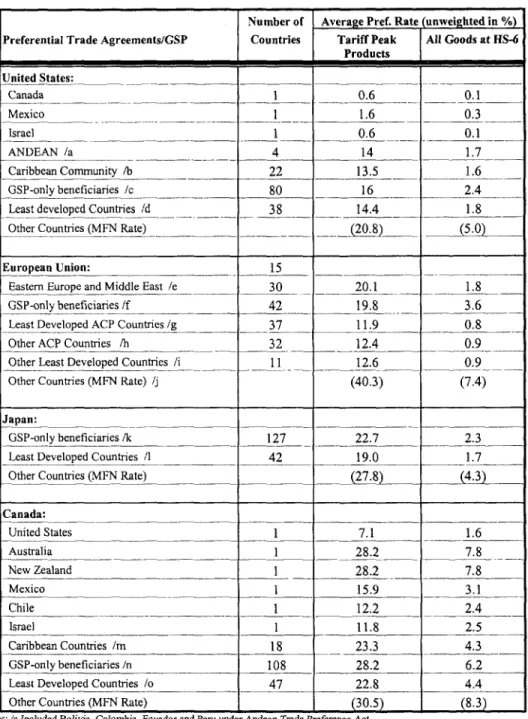
On average these preferential schemes are quite generous. In the EU, the average tariff faced by LDCs or ACP members is below 1 percent, compared to the 7.4 percent average MFN tariff. GSP preferences in the EU are less generous, but still imply more than a 50 percent margin. Japan and the US follow with a 50 percent preference margin under their GSP regime, and an average 60 percent preference for LDCs. Canada gives a 25 percent preference to GSP countries and 45 percent to LDCs. The US data suggest that preference margins granted to developing countries are relatively small in products with tariff peaks. GSP countries only benefit on average from a 20 percent margin. LDCs have a 41 percent margin; Andean Trade Pact and Caribbean countries benefit on average from a 45 percent preference margin.
8 The EU was the first customs territory to grant GSP preferences to developing countries in 1971. See Kenan and Stevens (1997) or Hallaert (2000) for a detailed description of the European GSP.
9 In the simulations discussed in section 4 we also include preferences for developed countries that benefit from preferences in other Quad markets (see footnotes in Table 3 for a description).
Table 3: Tariff Peaks and Preferential Duty Rates in the Quad, 1999
Number of Average Pref. Rate (unweighted in %)
Preferential Trade Agreements/GSP Countries Tariff Peak All Goods at
HS-6
Products United States: _________ ____ Canada 1 0.6 _0.1 Mexico 1 1.6 0.3 Israel ___ __- __ 1 0.6 0.1 ANDEAN /a 4 14 1.7 Caribbean Comnmunity /b __ _ 22 13.5 1.6 GSP-only beneficiaries /c 80 16 2.4Least developed Countries Id 38 14.4 1.8
Other Countries (MFN Rate) ___ _.(0.8 (5.0
European Union: 15
EasternEurope and Middle East /e 30 20.1 1.8
GSP-only beneficiaries /f 42 19.8 3.6
Least Developed ACP Countries /g 37 11.9 0.8
Other ACP Countries /h 32 12.4 _ 0.9
Other Least Developed Countries /i I 1 12.6 0.9 Other Countries (MFN Rate) /j (40.3) (7.4) Japan:
GSP-only beneficiaries /k 127 22.7 2.3 Least Developed Countries /1 | 42 19.0 1.7 Other Countries (MFN Rate) _ ___ (27.8 (4.3)
Canada: United States 1 7.1 1.6 Australia ___ 1 28.2 7.8 New Zealand 1 28.2 7.8 Mexico l 1 15.9 3.1 Chile ___ ____ 1 12.2 2.4 Israel 1 11.8 2.5 Caribbean Countries /m _ 18 23.3 4.3 GSP-only beneficiaries /n 108 28.2 6.2 Least Developed Countries /o 47 22.8 4.4 Other Countries (MFN Rate) (30.5) (8.3)
Notes: /a Included Bolivia, Colombia, Ecuador and Peru under Andean Trade Preference Act.
/b Based on 20 Caribbean countries under Caribbean Basin Economic Recovery Act and Bahamas, Nicaragua.
/c Included 80 developing countries or territories under GSP scheme but excluding 29 other developing economies.
/d Based on UN 48 least developed countries but excluding 10 countries.
/e Including countries with reciprocal and non reciprocal trade agreements with the EU.
/f Most developing countries in Latin America and Asia; excludes Hong Kong, Korea and Singapore (non-GSP nations). /g Included 37 ACP and least developed countries under Lome Convention.
lh Included ACP 32 countries under Lome Convention but not under the group of least developed countries. /i Included II least developed countries but not under ACP countries.
/j Included all industrial countries, Hong Kong, Korea, Singapore and 14 transition countries.
/k 127 countries; excludes Albania, Bosnia, Estonia, Latvia, Lebanon, Lithuania, Macedonia, Moldova, Vietnam, Yugoslavia. /1 Excludes 3 LDCs: Comoros, Djibouti and Tuvalu. 3 others (Congo DR, Kiribati and Zambia) are included in the GSP group.
/m Included 18 Caribbean countries or territories under Commonwealth Caribbean Countries Tariff.
In Excluded 8 developing countries: Albania, Aruba, Bosnia & H4erz, Macedonia, Mongolia, Oman, Saudi Arabia, Yugoslavia /o Excluded Myanmar.
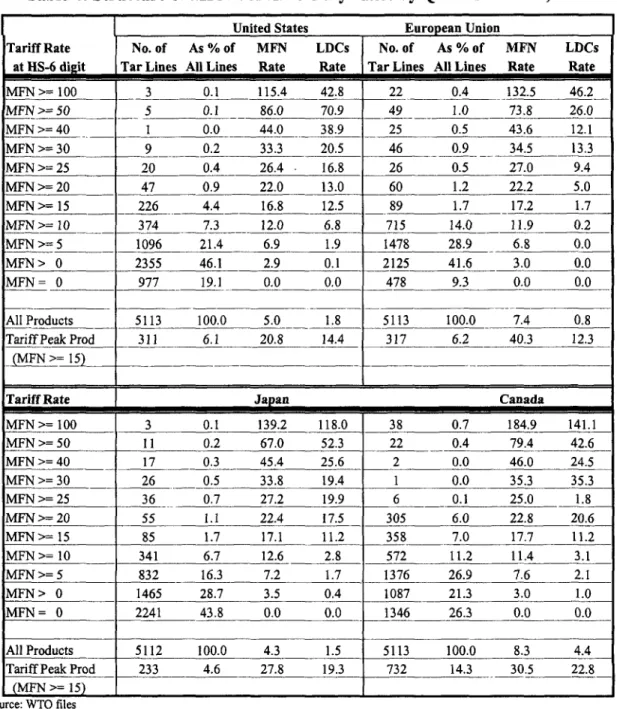
Preferences are much less generous for tariff peak products. Indeed, except for the EU, the preference margins are significantly below the average across all products. Preference margins for GSP beneficiaries in Canada, Japan and the US on tariff peak items are only 8, 18 and 23 percent, respectively. For LDCs the margins fall to 25 percent in Canada and 30 percent in the US and Japan. More detail on the structure of preferences for different tariff brackets in the Quad is provided in Table 4. For example, for tariffs between 50 and 100 percent, the preference margin granted to LDCs is only 17 percent in the US and 22 percent in Japan. Thus, although existing preferential schemes grant significant preferences to developing countries, preferences are concentrated in products which already enjoy low tariffs (between 0 and 10 percent) rather than on tariff peaks. In other words, preferential schemes offer little protection against tariff peaks in the Quad, except for the European Union. Data on the average MFN import duties on tariff peak products at the HS 2 digit level, and preference margins granted by the Quad to different groups of developing countries are provided in Appendix A. A value of 1 in the preference columns means that the products enter the Quad member duty-free-there is a
100 percent margin.
3
Tariff peaks and LDC exports
In order to simulate the possible effect of duty free access to the Quad, data are required on the total value of LDC exports to the world of products that are subject to tariff peaks in the Quad. Tariff peaks in the Quad affect LDC exports to the world because Quad tariffs lower world prices (see Appendix C). Data on global exports of LDCs of products subject to peaks in the Quad are reported in Tables 5a-d at the HS 2 digit level, where values again correspond only to those 6-digit products within each 2 digit category that face tariff peaks in the Quad (i.e., they do not correspond to exports of all products within the 2 digit category). Total exports of LDCs to each Quad member and to the world at the 2 digit level are reported in Appendix B. They amount to $22.7 billion, of which $17 billion is exported to the Quad.10
10 More than 26 percent are mineral fuels exports (HS 27) for which there are no tariff peaks in the Quad. Non-oil exports of LDC amount to $17 billion.
Table 4: Structure of MFN and LDC Duty Rates by Quad Countries, 1999
(
United States European UnionTariff Rate TaNo. of As % of MFN LDCs No. of As % of MRN LDCs
at aS-6 digit Tar Lines All Lines Rate Rate Tar Lines All Lines Rate Rate
MFN>=I00 I 3 0.1 115.4 42.8 22 0.4 132.5 46.2 MFN>=50 5 0.1 86.0 70.9 49 1.0 73.8 26.0 MFN>=40 1 0.0 44.0 38.9 25 0.5 43.6 12.1 MFN>=30 9 0.2 33.3 20.5 46 0.9 34.5 13.3 MFN>=25 20 0.4 26.4 16.8 26 0.5 27.0 9.4 MFN>=20 47 0.9 22.0 13.0 60 1.2 22.2 5.0 MFN>= 15 226 4.4 16.8 12.5 89 1.7 17.2 1.7 MFN>= 10 374 7.3 12.0 6.8 715 14.0 11.9 0.2 MFN>-5 1096 21.4 6.9 1.9 1478 28.9 6.8 0.0 MFN> 0 2355 46.1 2.9 0.1 2125 41.6 3.0 0.0 MFN = 0 977 19.1 0.0 0.0 478 9.3 0.0 0.0 AllProducts 5113 100.0 5.0 1.8 5113 100.0 7.4 0.8
Tariff Peak Prod 311 6.1 20.8 14.4 317 6.2 40.3 12.3
(MFN>=15 __ _
_-Tariff Rate
[
Japan CanadaMFN>= I00 3 0.1 139.2 118.0 38 0.7 184.9 141.1 MFN >= 50 11 0.2 67.0 52.3 22 0.4 79.4 42.6 MFN>=40 17 0.3 45.4 25.6 2 0.0 46.0 24.5 MFN >= 30 26 0.5 33.8 19.4 1 0.0 35.3 35.3 MFN>=25 36 0.7 27.2 19.9 6 0.1 25.0 1.8 MFN >= 20 55 1.1 22.4 17.5 305 6.0 22.8 20.6 MFN>=15 85 1.7 17.1 11.2 358 7.0 17.7 11.2 MFN>=10 341 6.7 12.6 2.8 572 11.2 11.4 3.1 MFN>=5 832 16.3 7.2 1.7 1376 26.9 7.6 2.1 MFN> 0 1465 28.7 3.5 0.4 1087 21.3 3.0 1.0 MFN= 0 2241 43.8 0.0 0.0 1346 26.3 0.0 0.0 All Products 5112 100.0 4.3 1.5 5113 100.0 8.3 4.4
Tariff Peak Prod 233 4.6 27.8 19.3 732 14.3 30.5 22.8
(MFN >= 15)
Source: WTO files
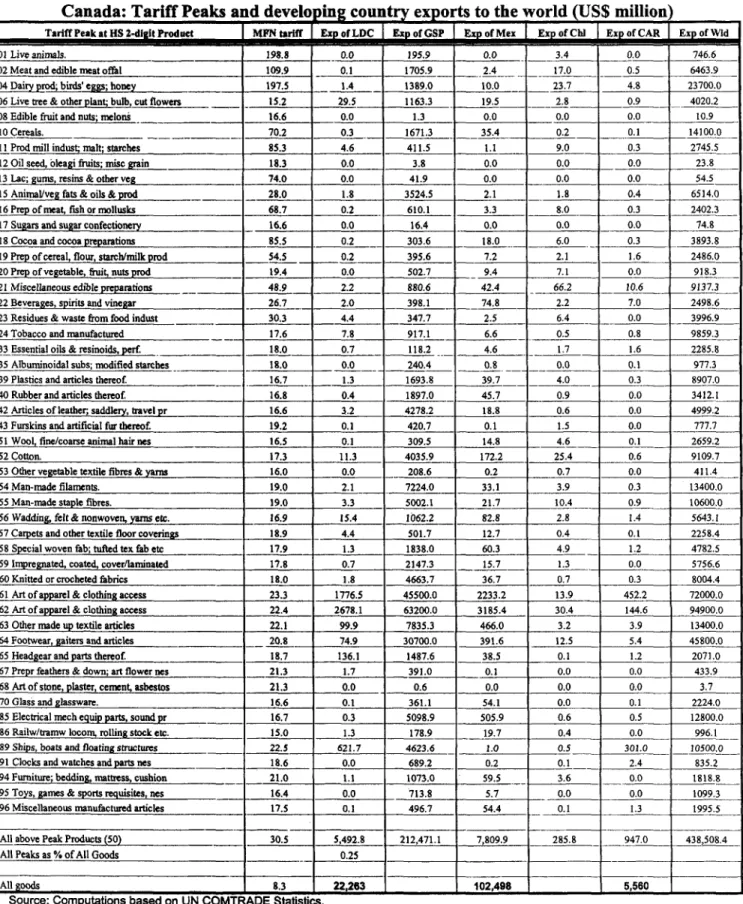
More than $5.5 billion of LDC exports to the world, or 25 percent of their total exports, are potentially affected by tariff peaks in Canada (Table 5a-column 3). Most of these affected exports are in apparel and clothing (HS 62 and 62). More interestingly, more than 99 percent of LDC exports of apparel to the world are affected by a tariff peak in Canada (total exports are reported in Appendix B). There is almost no preferential access for LDCs in these items (the preference margin is only 8 percent-see Table Al). This implies that full duty free access to Canada is likely to have a significant effect on
LDC exports. Exports of other developing countries potentially affected by a Canadian tariff peaks are also concentrated in apparel-and preference margins are even smaller (around 3 percent). However, Mexico and Chile benefit from a 66 percent preference margin in these items under their respective bilateral trade agreements with Canada which brings the tariff they face to around 10 percent.
Similarly, more than $3 billion of LDC exports to the world, or 14 percent, are
potentially affected by tariff peaks in the US (Table 5d). Most LDC exports to the world
facing a tariff peak in the US are again concentrated in apparel ($2.6 billion dollars), and do not benefit from preferential access. Tobacco is another tariff peak item that is an important export for both LDCs and GSP beneficiaries. In the case of LDCs, more than 95 percent of their total exports of tobacco to the world potentially face a tariff peak in the US of 63 percent (the MFN rate on these products averages 73 percent, with a 14 percent preference margin for LDCs-see Appendix Table B4).
The numbers are smaller in the case of Japan and the EU (Tables 5b and 5c), with tariff peaks in each market affecting some $500 and $800 million of LDC exports to the world, respectively. Although these numbers are small in absolute terms, the effect of peaks in these markets on specific LDCs may be quite large. For example, currently Djibouti, Kiribati, Somalia and Tuvalu together export less than $50 million to the world. LDC exports affected by EU tariff peaks are concentrated in meat and fish products (HS 16), fish and crustaceans (HS 03), sugar (HS 17), tobacco (HS 24) and footwear (HS 64) (Table 5b). However, as indicated in Table A2, with the exception of meat, fish or mollusk products (HS 16) and sugar (HS 17), all of these exports benefit from full duty free access into the EU. In the case of preparations of meat, the 68 percent preference margin brings the tariff faced by LDC exporters around 10 percent. In the case of sugar, however, the preference margin granted to LDCs is quite small; their exports face an
average tariff of 29 percent.
LDC exports that are affected by Japanese tariff peaks include sugar (HS 17), raw hides and skins (HS 41) and footwear (HS 64) (Table 5c). Of these, sugar is the only one where no preference is granted to LDCs. Full duty free access is granted for footwear, while in the case of hides and skins, an 80 preference margin is granted to LDCs-see Appendix Table A3.
Table Sa
Canada: Tariff Peaks and develo ing country exports to the world (US$ million)
Tariff Peak at HS 2dgtProduct |MFN triff of LDC Exp of GSP |Exp of Mex Exp of Chi Exp of CAR xp of Wid
01 Live animals. 198.S 0.0 195.9 0.0 3.4 0.0 746.6
02Meatandedibleneatoffal 109.9 01 1705.9 24 17.0 0.5 6463.9
04 Dairy prod; birds' eggs; honey 197.5 1-4 1389.0 10.0 23.7 4.8 23700.0 06 Live tree & otherplant; bulb, cutflowers 15.2 29.5 1163.3 19.5 2.8 0.9 4020.2 08 Edible fruit and nuts; melons 16.6 0.0 1.3 0.0 0.0 0.0 10.9
10 Cereals. 70.2 0.3 1671.3 35.4 0.2 0.1 14100.0
I IProd mill indust; malt; starches 8 85.3 4.6 411.5 1.1 9.0 0.3 2745.5 12 Oil seed, oleagi fruits; misc grain 18.3 0.0 3.8 0.0 0.0 0.0 23.8 13 Lac; gums, resins & other veg 74.0 0.0 41.9 0.0 0.0 0.0 54.5 15 Animal/veg fats & oils & prod 28.0 1.8 3524.5 2.1 1.8 0.4 6514.0 16 Prep of neat, fish or mollusks 68.7 0.2 610.1 3.3 8.0 0.3 2402.3 17 Sugars and sugar confectionery 16.6 0.0 16.4 0.0 0.0 0.0 74.8 18 Cocoa and cocoa preparations 85.5 0.2 303.6 18.0 6.0 0.3 3893.8 19 Prepofcereal, flour, starch/milkprod 54.5 0.2 395.6 7.2 2.1 1.6 2486.0 20 Prep of vegetable, fruit, nuts prod 19.4 0.0 502.7 9.4 7.1 0.0 918.3 21 Miscellaneous edible preparations ___ 48.9 2.2 880.6 42.4 66.2 10.6 9137.3 22 Beverages, spirits and vinegar 26.7 2.0 398.1 74.8 2.2 7.0 2498.6 23 Residues & waste from food indust 30.3 4.4 347.7 2.5 6.4 0.0 3996.9 24 Tobacco and manufactured 17.6 7.8 917.1 6.6 0.5 0.8 9859.3 33 Essential oils & resinoids, perf. 18.0 0.7 118.2 4.6 1.7 1.6 2285.8 35 Alburninoidal subs; modified sarches I 18.0 0.0 240.4 _ 0.8 0.0 0.1 977.3 39 Plastics and articles thereof 16.7 1.3 | 1693.8 39.7 4.0 0.3 8907.0 40Rubberandarticlesthereof. 16.8 0.4 1897.0 - 45.7 0.9 0.0 3412.1 42 Articles of leather, saddlery, travel Dr 16.6 3.2 4278.2 18.8 0.6 0.0 4999.2 43 Furskins and artificial fur thereof. 19.2 0.1 420.7 0.1 1.5 0.0 777.7 51 Wool, fine/coarse animal hair nes 16.5 0.1 309.5 14.8 4.6 0.1 2659.2
52 Cotton. 17.3 11.3 4035.9 172.2 25.4 0.6 9109.7
53 Other vegetable textile fibres & yarns 16.0 0.0 | 208.6 0.2 0.7 0.0 411.4
54 Man-made filaments. 19.0 2.1 7224.0 33.1 3.9 0.3 13400.0
55 Man-made staple fibres. 19.0 3.3 5002.1 21.7 10.4 0.9 10600.0 56Wadding,felt &nonwoven,yarnsetc. 16.9 15.4 1062.2 82.8 2.8 1.4 5643.1
57 Carpets and other textile floor coverings 18.9 4.4 501.7 12.7 0.4 0.1 2258.4 SB Special woven fab; tufted tex fab etc 17.9 1.3 1838.0 60.3 4.9 1.2 4782.5 59 14regnated, coatd, cover/laminated 17.8 0.7 2147.3 15.7 1.3 0.0 5756.6 60 Knitted or crocheted fabrics 18.0 1.8 4663.7 36.7 0.7 0.3 8004.4 61 Art of apparel & clothing access 23.3 1776.5 45500.0 2233.2 13.9 452.2 72000.0 62Artofapparel & clothing access 22.4 2678.1 63200.0 3185.4 - 30.4 144.6 94900.0
63 Other made up textile articles 22.1 99.9 7835.3 466.0 3.2 3.9 13400.0 64 Footwear, gaiters and articles 20.8 74.9 30700.0 391.6 12.5 5.4 45800.0
65 Headgear and parts thereof. 18.7 136.1 1487.6 38.5 0.1 1.2 2071.0
67Preprfeathers&down;artflowernes 21.3 1.7 391.0 0.1 0.0 0.0 433.9 68 Art of stone, plaster, cement, asbestos 21.3 0.0 0.6 0.0 0.0 0.0 3.7
70 Glass and glassware. 16.6 0.1 361.1 54.1 0.0 0.1 2224.0
85 Electrical mech equip parts, sound pr 16.7 0.3 5098.9 505.9 0.6 0.5 12800.0 86 Railw/tramw locom, rolling stock etc. 15.0 1.3 178.9 19.7 0.4 0.0 996.1 89 Ships, boats and floating srtmuures 22.5 621.7 4623.6 _ 2.0 0.5 301.0 10500.0 91 Clocks and watches andparts nes 18.6 0.0 689.2 0.2 0.1 2.4 835.2 94Furnitue;bedding,matress,cushion _ t_ 21.0 1.1 1073.0 59.5 3.6 0.0 1818.8 95 Toys, games & sports requisites, nes 16.4 0.0 713.8 5.7 0.0 0.0 1099.3 96 Miscellaneous manufactured articles 17.5 0.1 496.7 54.4 0.1 1.3 1995.5
All above Peak Products (50) 30.5 5,492.8 212,471.1 7,809.9 285.8 947.0 438,508.4
All Peaks as % of All Goods _ 0.25 __ All goods 8.3 22,263 102,498 5,560
Table 5b:
EU Tariff Peaks and developing countries exports to the world US$ million)
Tariff Peak at HS 2-digit Products MFN Exports of Exports of Exp of Exports of Exports of World
Tariff LDC GSP ACP ACP+LDC FTAs trade
(Non- (non LDC)
ACP)
01 Live animals. 38.2 0.7 747.1 0.7 1.0 247.2 6455.3
02 Meat and edible meat offal 71.0 0.4 4053.2 35.7 9.7 876.6 35436.3
03 Fish & crustacean, mollusk nes 18.7 28.3 1980.6 235.1 86.5 175.4 3401.9
04 Dairy prod; birds' eggs; honey 59.1 1.1 942.5 7.5 0.6 542.9 28565.7
06 Live tree & other plant; bulb, cut flowers 16.9 0.1 959.5 190.2 29.6 235.9 3552.6
07 Edible vegetables and roots & tubers 25.4 0.2 1490.6 16.9 2.0 227.3 2991.5
08 Edible fruit and nuts; melons 20.2 0.4 6446.6 549.0 12.1 945.5 8832.7
09 Coffee, tea, mat and spices 16.0 0.0 7.2 0.3 0.0 4.3 64.6
10 Cereals. 75.6 9.8 4708.6 52.5 11.4 687.1 35831.3
11 Prod mill indust; malt; starches 38.2 5.2 530.4 10.4 0.6 148.3 5779.8
12 Oil seed, oleagi fruits; misc grain 74.4 0.0 0.1 0.0 0.0 3.3 8.4
13 Lac; gums, resins & other veg __ _ 17.8 _ 0.0 23.1 0.0 ° 0.1 2.5 112.8
15 Animal/veg fats & oils & prod 56.0 0.8 134.1 2.2 0.1 _ 369.4 4623.0
16 Prep of meat, fish or mollusks 23.5 24.9 5214.1 490.3 56.8 578.3 11229.7
17 Sugars and sugar confectionery 37.6 1.4 3540.0 1155.3 83.1 514.9 11643.8
,18 Cocoa and cocoapreparations 24.0 0.0 8.2 0.8 0.0 3.8 140.1
19 Prep of cereal, flour, starch/nmilk grod 34.1 1.6 938.8 10.0 0.3 143.1 9413.7
20 Prep of vegetable, fruit, nuts prod 26.1 1.4 5222.8 170.3 3.7 1516.9 16249.0
21 Miscellaneous edible preparations 19.2 2.1 1373.4 83.4 2.0 245.7 11612.6
22 Beverages, spirits and vinegar 35.7 2.3 1747.4 365.8 3.4 392.6 11729.6
23 Residues & waste from food indust 71.4 5.2 652.4 14.9 4.8 153.4 8403.0
24 Tobacco and manufactured 56.2 3.6 1292.4 384.4 47.1 731.5 18118.1
29 Organic chemicals. 33.9 0.0 54.0 0.0 0.0 3.6 182.8
35 Albuminoidal subs; modified starches 24.9 0.0 191.5 0.3 0.0 5.7 1140.6
38 Miscellaneous chemical products 45.9 0.0 13.2 0.0 0.0 1.9 103.9
56 Wadding, felt & nonwoven, yarns etc. 21.1 0.4 75.6 0.3 10.2 1.6 114.8
64 Footwear, aiters and articles 18.2 31.4 11400.0 50.7 1.5 293.0 9117.8
87 Vehicles o/t railw/tramw roll stock, pts 16.3 5.0 2533.0 3.5 0.5 170.8 25041.1
All above Peak Products (28) 40.3 126.5 56280.5 3830.5 366.9 9222.2 269896.6
All Peaks as % of All Goods All Goods
Table 5c:
Japan's Tariff Peaks and world exports of developing countries (millions US$)
Tariff Peak at HS 2-digit products
1
MFN | Exp. Of Exp. of Word tradeTariff LDC GSP
02 Meat and edible meat offal 39.31 12.7 1755.5 12991.7
03 Fish & crustacean, mollusk nes 15.00 0.8 101.2 975.8
04 Dairy prod; birds' eggs; honey 28.99 3.2 1514.4 23006.5
07 Edible vegetables and roots & tubers 15.80 0.0 15.9 31.0
08 Edible fruit and nuts; melons 19.81 27.2 9279.3 16292.5
09 Coffee, tea, mat and spices 17.81 6.5 556.5 1998.6
10 Cereals. 63.38 16.9 1592.2 8527.1
I I Prod mill indust; malt; starches 23.24 11.2 543.6 3530.4
12 Oil seed, oleagi fruits; misc grain 19.10 23.8 66.6 111.1
15 Animal/veg fats & oils & prod 26.99 0.1 114.3 1268.5
16 Prep of meat, fish or mollusks 20.69 0.2 686.1 1662.8
17 Sugars and sugar confectionery 71.25 175.4 5636.1 10761.1
18 Cocoa and cocoa preparations _ 22.77 0.7 557.0 5570.7
19 Prep of cereal, flour, starch/milk prod 21.91 6.4 1775.9 12640.9
20 Prep of vegetable, fruit, nuts prod 22.69 4.7 6327.4 12775.8
21 Miscellaneous edible preparations 22.35 7.8 1860.0 11362.8
22 Beverages, spirits and vinegar 38.65 9.5 3314.3 23943.4
24 Tobacco and manufactured 18.63 0.2 533.3 1578.4
29 Organic chemicals. 20.00 0.0 196.0 746.5
35 Albuminoidal subs; modified starches 23.31 0.1 206.8 1483.1
38 Miscellaneous chemical products 80.83 0.0 9.6 74.4
41 Raw hides and skins (other than fur) 26.08 370.9 5158.7 11496.8 42 Articles of leather; saddlery, travel pr 15.52 12.2 5085.9 6690.7
43 Furskins and artificial fur thereof. 16.25 0.7 827.3 2226.4
53 Other vegetable textile fibres & yams 16.00 0.2 482.2 946.1
58 Special woven fab; tufted tex fab etc 17.90 1.3 310.5 635.0
60 Knitted or crocheted fabrics 15.70 1.7 245.9 483.6
64 Footwear, gaiters and articles 36.24 95.6 18062.0 31305.7
All above Peak Products (50) 27.8 790.2 66814.5 205117.5
All Peaks as % of All Goods _ _
All goods 4.3 22263
Table 5d:
US tariff peaks and global exports of developing countries (US$ million)
Product Description MFN Export ExportG Export Export Export Export Export LDC SP NGSP MEX ATP CAR WLD
02 Meat and edible meat offal 19.2 0 538 1 0 0 0 1170 04 Dairy prod; birds' eggs; honey 20.9 0 298 2 0 2 0 694 07 Edible vegetables and roots nes 20.6 14 1288 316 211 3 4 2808 08 Edible fruit and nuts; melons 16.7 2 1139 62 218 13 1 2254 11 Prod mill indust; malt; starches 16.3 0 10 0 0 0 0 12 12 Oil seed, oleagi fruits; misc etc. 78.0 17 695 220 4 1 0 993 15 Animal/veg fats & oils & prod 19.9 1 l 1569 30 6 34 0 2088 19 Prep of cereal, flour, milk prod 16.8 0 253 7 15 9 0 776 20 Prep of vegetable, fruit, nuts 28.7 0 3070 295 86 111 26 4981 21 Miscellaneous edible prep _ 19.8 0 623 5 1 4 0 1079 24 Tobacco and manufactured 73.5 400 9862 750 61 43 1 17143 28 Inorgn chem; compds of prec 15.1 0 1 0 0 0 0 4 29 Organic chemicals. 16.8 0 65 15 0 0 0 156 30 Pharmaceutical products. 30.0 0 950 42 9 1 0 2169 42 Articles of leather; saddlery 20.0 0 39 76 0 0 0 137 51 Wool, fine/coarse animal hair 20.5 0 1660 139 26 17 0 2804
52 Cotton. 18.3 0 122 51 0 1 0 230
54 Man-made filaments. 16.4 2 3370 5356 24 11 0 11570 55 Man-made staple fibres. 16.3 3 3992 2978 17 17 0 9283 56 Wadding, felt & nonwoven 15.2 0 53 47 0 4 0 146 58 Special woven, tufted fabrics 18.5 0 850 753 39 12 0 2087 60 Knitted or crocheted fabrics 18.6 0 377 663 2 4 0 1294 61 Art of apparel & clothing 19.5 1326 17607 13490 1765 293 335 40452 62 Art of apparel & clothing 18.9 1342 18087 13211 614 117 75 38129 64 Footwear, gaiters and parts etc. 27.8 40 6432 10514 143 16 1 18271 69 Ceramic products. 17.6 0 3774 122 138 39 0 5832 70 Glass and glassware. 16.2 1 1266 266 47 7 0 2098 82 Tool, implement, cutlery 15.2 0 74 152 1 0 0 313 86 Railw/tramw locom, 17.2 1 390 8 20 0 0 987 87 Vehicles o/t railw/tramw 25.0 0 11192 408 3595 94 0 33540 96 Miscellaneous manufactures 20.7 0 76 34 29 1 0 195
Total (tariff peak products) 20.8 3151 89724 50016 7073 853 447 203696
Peaks as a % of Total 0.14 0.04 0.07 0.07 0.02 0.08 0.04
Total (All goods) 5/0 22263 2108310 732781 102498 41605 5560 4787750
4. Effects of Reducing tariff peaks in the Quad
The small size of LDC exports relative to total developing country exports that are potentially affected by Quad tariff peaks implies that the gains for developing countries from a reduction in tariff peaks could be much larger than the tariff revenue collected in
the Quad on their exports. Indeed, preferential access may allow for re-directing an important share of their exports to the market that grants further preferential access. This section provides estimates of the change in LDC exports if each Quad member was to grant duty free access to all LDC exports of tariff peak items. For comparison purposes, we also calculate the impact of duty free access for peak items for all developing countries (current GSP beneficiaries), and the effect of a nondiscriminatory (MFN) reduction of all tariff peaks to a level of 5 percent (the Quad average). For each Quad member, we group developing countries according to the type of preference that they receive, distinguishing between LDCs, GSP beneficiaries and FTA partners (results for the latter are not reported for space reasons)." In all simulations we also have groups of developed countries corresponding to the different tariff regimes in Quad members. In the case of the EU and Japan, all developed countries enter into the MFN regime category, whereas for Canada we separate Australia, New Zealand, the US and Israel. We do not report results of changes in exports for developed countries.12 To further simplify the presentation, we report results at the 2-digit level of the HS. However, simulations pertain only to affected 6-digit tariff peak items within each 2-digit category.
The simulations use a simple partial equilibrium model of the world market for each 'product'-defined as a 6-digit tariff line item. We assume that each 6-digit item represents only a small share of the economy, so that the effects on other markets of a change in tariffs can be ignored. Import demand and export supply are iso-elastic and are calibrated for each country/group using trade value, unit prices, tariffs and preference margins at the 6-digit tariff line level. World markets are assumed to be perfectly competitive and integrated, in the sense that there is no further scope for arbitrage across countries. Products are perfectly homogenous. The world price is determined by equating total world import demand (the sum across countries/groups) to total world export supply (the sum across countries/groups). We employ a conservative supply elasticity of 0.5 to reflect the difficulty many LDCs will have in generating a supply response to the changed incentives following duty free access for tariff peak items. Demand elasticities were
" Stevens and Kennan (2000) have identified more than 30 tariff regimes in the EU. We follow them in working with only the major aggregate categories/groups.
derived using the estimates reported in Shiells, Stem and Deardorff (1986) and Stern et
al. (1976).
Appendix C provides a more detailed description of the methodology and data sources. As shown there, granting duty free access to a group of developing countries unambiguously reduces the world price (at the existing world price there is excess supply), which will in turn reduce other developing countries' exports. The country/group benefiting from duty free access obviously benefits (in spite of the world price decline). We report results for each Quad member in turn.
Canada
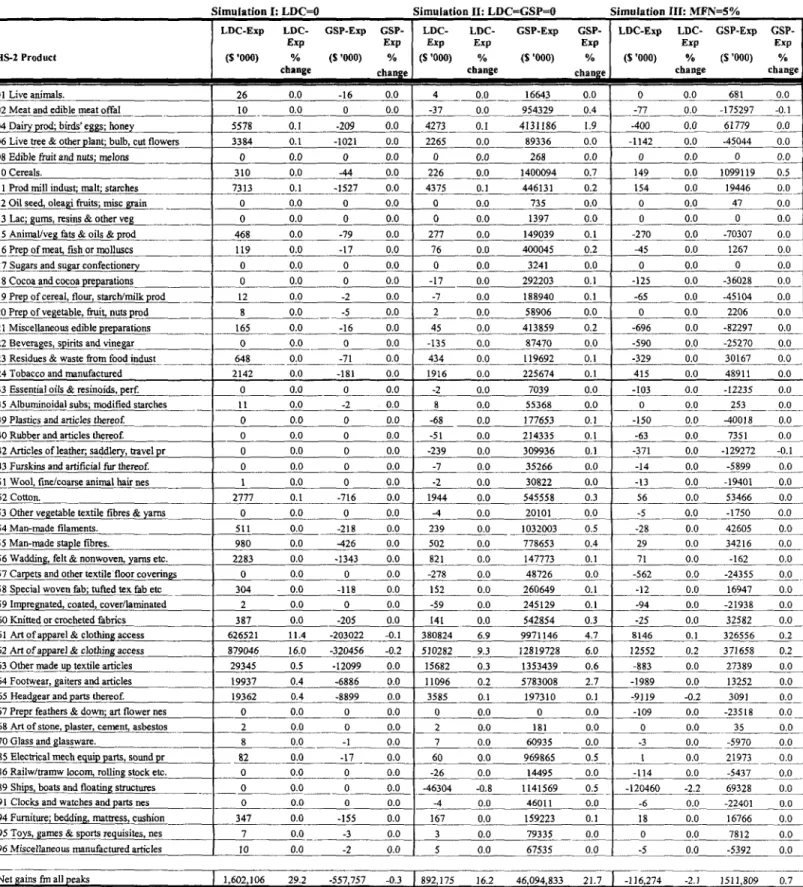
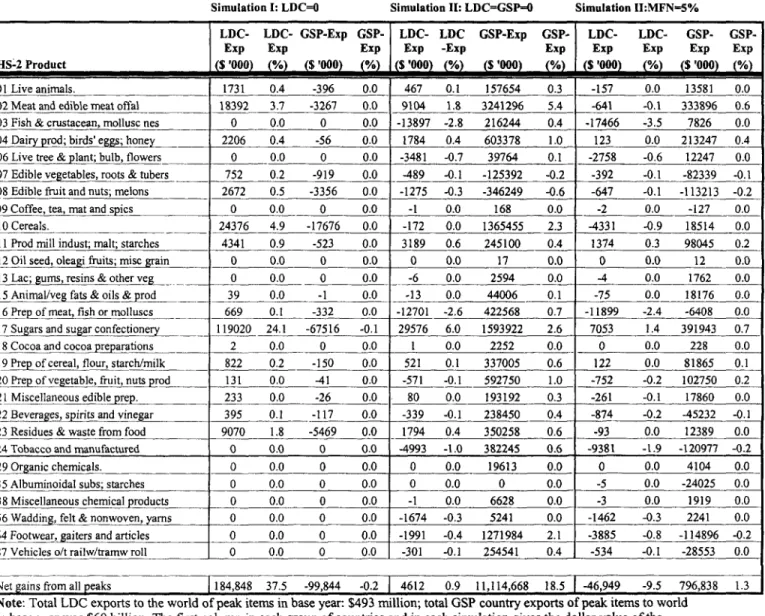
Table 6a reports changes in the value of exports of LDCs and GSP beneficiaries, both in terms of dollar value of percentage change of tariff peak exports to Canada, following the elimination of tariff peaks in Canada. The first simulation grants duty free access to LDCs only, whereas the second simulation grants full duty free access to all developing countries for peak items-including not only LDCs, but also GSP beneficiaries. Both scenarios have implications for developing country groups. Thus, duty free access for LDCs will result in some trade diversion away from GSP beneficiaries and FTA members. Extending duty free access to all developing countries will be to the detriment of countries that currently obtain the greatest preference margins, generally countries that are members of FTAs.
LDC exports expand by $1.6 billion if duty free access is granted exclusively to these countries. Under this scenario the loss in export revenue (associated with trade diversion) for other developing countries is small-total exports fall by $555 million relative to the base line. This is equivalent to 0.3 percent of their total exports of peak products to the world. Note that the predicted changes in export revenue for LDCs are larger than the tariff revenue data in Table 1. The reason is that all exports to the world of products facing tariff peaks in Canada will be affected by Canada's tariff reforms.
The greatest increases for LDC exports under the preferential duty free access scenario occur in products that are both highly protected and where LDCs have en existing supply capacity (as reflected in existing exports to the world of the products
concerned). As can be seen from Table 6a, virtually all of the increase occurs in categories 61-62 of the HS: apparel.13 Coming a far second is footwear and headgear.
Which LDCs are the major gainers? Table 7 reports the total predicted increase in exports for each LDC. In absolute terms, Bangladesh is by far the largest gainer, with a more than $1 billion increase in exports following the grant of duty free access to LDCs (equal to some 60 percent of the total increase in LDC exports). Liberia follows with a $180 million increase. However, in relative terms, the increase in exports of Bangladesh and Liberia is similar to those of Haiti, Lao and Cambodia-who all see their exports increase by 20 percent. Table 8 shows the top 5 products at the 2 digit level of the Harmonized System would experience the largest increase in export revenue in dollar terns and the top 5 countries that benefit from these increases. Bangladesh is the top
exporter in all 5 products.
The largest gains for developing countries obviously occur when duty free access is granted to all developing countries (simulation II). Exports to Canada of peak items by non-LDCs increase by 22 percent, while those of LDCs increase by 16 percent. In absolute termns, the increase in GSP countries exports dominates, reflecting their much larger share of the total market. Total exports of tariff peak products increase by some $47 billion, of which $46.1 billion accrues to GSP beneficiaries (2.1 percent of their total exports to the world) and $892 million to LDCs (4 percent of total LDC exports to the world). Most of the overall increase in exports again occurs in textiles and apparel. However, a few other sectors are also significant, including dairy and cereals.
An MFN reduction in tariff peaks to 5 percent, moving the structure of protection closer to uniformity, would generate an increase in total export revenue of slightly more than 0.1 percent for non-LDC developing countries ($1.5 billion). LDCs would see their exports decline slightly (0.5 percent of current exports to the world), as existing preferential access is eroded. The largest losses are for Mexico ($925 million-not reported), reflecting preference erosion in the Canadian market. However, this represents less than 1 percent of total Mexican exports to the world.
13 Most of these gains are heavily concentrated in around 10 tariff lines at the 6 digit level of the
The European Union
Table 6b reports changes in the value of exports of LDCs and GSP beneficiaries, both in terms of dollar value and percentage change of tariff peak exports to the EU, following elimination of tariff peaks by the EU. The effect of duty free access for LDCs are smaller than in the case of Canada, reflecting the fact the EU already provides significant preferential access to all developing countries. However, exports of LDCs could increase by some $185 million, representing a 37 percent increase in exports of peak items to the EU. In contrast to the Canadian case, most of the increase in exports occurs in agricultural commodities, especially sugar products (accounting for 64 percent of the increase), followed by cereals, meat, and fruit. Exports of textiles and clothing are of course also important in the EU, but these are not tariff peak items.
Full duty free access for all developing countries would increase exports of tariff peak items to the EU by some 18 percent ($11 billion), while not detrimentally affecting LDC exports. Sugar accounts for about 15 percent of the total increase. The largest expansion occurs in meat (almost 30 percent). Cereals and footwear are other important growth areas, each accounting for about 15 percent of the total increase. A MEN reduction in peaks to 5 percent would increase non-LDC developing country exports of tariff peak items by only 1.3 percent, and reduce LDC exports of such products by some 9 percent. LDC expoi ts of sugar would expand slightly, but most categories decline.
Table 7 reports export increases by LDC. The largest absolute increase under duty free access for LDCs only occurs in Madagascar with an expansion in exports of $26 million, equivalent to about 4 percent of Madagascar's total exports. In relative terms, the LDC that gains the most from duty free access to the EU is the Maldives, with a 19 percent increase in exports ($13.5 million); followed by Kiribati with a 17 percent increase ($1 million) and Somalia with a 15 percent increase ($4.4 million). Table 8b reports the top 5 products in terms of export value growth at the 2 digit level of the Harmonized System and the top 5 exporters in these categories. Countries that gain include Malawi, Myanmar, Sudan and Nepal.
Granting duty free access to LDCs generates an export revenue loss for those ACP countries that are not LDCs (however, ACP members as a whole experience a net gain of $135 million, as the majority are LDCs). Our estimates suggest that the $23
million loss in export revenue for these non-LDC ACP countries associated with granting duty free access to LDCs represents less than 0.1 percent of their total exports to the world. Finally, if tariff peaks are reduced on a MFN basis to 5 percent, then the loss for ACP countries that do not benefit from LDC preferences would be ten times larger (around 1 percent). LDCs would also see their export revenue fall by 0.2 percent as their preference margins erode.
Japan
In the case of Japan, elimination of tariff peaks for LDCs has a significant effect on their exports of sugar and certain cereals. Increases in exports of these commodities account for almost all of the 62 percent increase in LDC exports of tariff peak items to Japan (Table 6c). Other developing countries lose market share in Japan as a result of granting duty free access to LDCs, but the decline in exports is only 0.4 percent of their total exports to the world.
One would expect to see large increases in exports of products such as rice and groundnuts, as these are highly protected, with ad valorem equivalents of the specific tariffs that apply to out of quota quantities often exceeding 100 percent-WTO (1997). Rice is currently the only quota constrained product in Japan-the domestic/world price ratio is over 5. In the simulations, LDCs do not experience a large increase in exports of these items because they are not significant exporters of these commodities.'4 Those LDCs that produce rice largely consume it domestically. Total exports to the world of cereals-including rice-by LDCs was only $20 million in the late 1990s (Appendix B). Thus, no matter how high the preference margin in Japan, the methodology used in the simulations cannot generate a large increase in exports. In the longer run, rice producers might change policies so as to export domestic production to Japan, importing their requirements from the rest of the world. There is clearly a large incentive to do this, and doing so would greatly increase the gains of preferential access to the Japanese market.
14 Using the out of quota ad-valorem equivalents provided in the WTO's 1997 Trade Policy Review of
Japan for groundnuts and dairy products and setting an ad-valorem equivalent for rice at 150 percent provides slightly larger gains for LDCs and other developing countries. Full duty free access to LDC generates an extra $15 million to the existing $497 million increase in exports; whereas when GSP
beneficiaries also benefit from duty free access, this generates an extra $2 billion to the existing $14 billion increase in GSP exports.
If full duty free access is extended to all developing countries, their total exports would expand by $13.6 billion, or 20 percent of total exports to Japan. LDC exports would also increase slightly. The composition of the increased trade would be different. In addition to sugar, which would account for about 25 percent of the total increase, major growth categories include footwear (another 25 percent), alcoholic beverages, cereals, and meat.
The LDC that benefits the most from duty free access to Japan in absolute terms is Bangladesh, with a simulated export increase of $229 million (47 percent of the total increase in LDC exports). However, this represents only around 5 percent of Bangladesh exports. In relative terms, the main beneficiaries are Somalia (a 43 percent increase in exports-or 12.8 million) and Cape Verde (a 23 percent increase-$4.4 million). Sudan and Togo follow with more than 10 percent. Looking at the major growth items, countries that gain significantly include Madagascar, Myanmar and Nepal (Table 8a).
United States
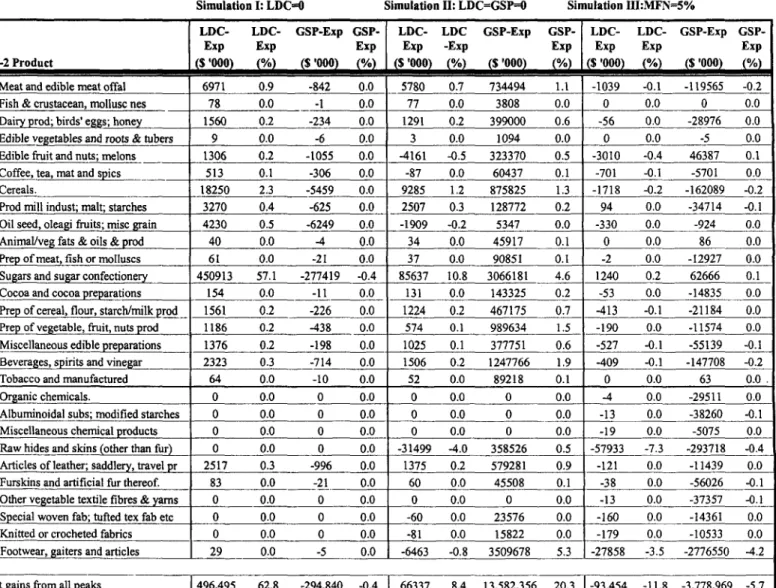
Granting duty free access to LDCs for the 307 tariff peaks in the US while keeping tariffs on other sources of supply unchanged (first column of Table 6d) generates an extra $1.1 billion dollar of export revenue for LDCs (a 35 percent increase, or 5 percent of their total exports to the world). Other developing countries see their export revenue contract, but the aggregate reduction is less than $0.4 billion. Total diversion losses are negligible given the small size of LDC exports. Mexico, the Andean Pact and Caribbean countries are not affected (their overall export revenue contracts by just $18 million, compared to total exports of $150 billion). Most of the action in the US market revolves around apparel, which accounts for two-thirds of the LDC export increase. Tobacco accounts for most of the remaining increase.
If duty free access is extended to all the developing countries that now have preferential treatment, total exports of tariff peak items to the US of both the LDC and non-LDC group would expand by about 20 percent. Total exports of LDCs to the world increases by 2.9 percent. In the case of GSP countries, the $18 billion increase is equal to 1 percent of their exports to the world. Many more product categories would see
significant increases, but the same categories dominate. One noteworthy difference is the predicted increase in imports of automotive products (mostly parts).
The smallest gain for LDCs is obtained when tariff peaks in the US are reduced to
5 percent on a MIFN basis. This generates an increase of only 4 percent in total LDC exports of tariff peak items to the US. GSP developing countries increase their export revenue by a total of almost $3 billion, some of which occurs to the detriment of Mexico.
The LDC that benefits the most from duty free access to the US is Bangladesh, with an increase in exports of $737 million (67 percent of the total increase in exports of LDCs). This represents a 16 percent increase in Bangladesh's exports to the world. In relative terms, the main beneficiary is Malawi with a 25 percent increase. If we focus on the major growth items, countries that expand their exports include Cambodia and Myanmar (textiles) and Malawi, Gambia and Sudan.
Summary of the simulation results
The results suggest that the greatest impact for LDCs associated with a reduction in tariff peaks is to be expected if full duty free access is granted to them exclusively. In order to calculate the total impact on LDC exports, the gains calculated above for each LDC in each Quad market cannot simply be added. This is because in some cases tariff peaks on a 6-digit item are found in more than one Quad market. It is therefore necessary to correct for double counting. Once this is done, we arrive at an estimate of the total increase in LDC exports following duty-free access for peak products in the Quad of $2.5 billion. This is equivalent to an 11 percent increase in their total exports of all goods to the world. Total imports into the Quad associated with duty free access for peak products will expand by only a modest $132 million (most of it concentrated in the US-not reported). The reason for this small effect on the import side is that the increase in LDC
export revenues essentially involves diversion of trade from other sources (both developed and developing countries). The small import effect suggests there is not a compelling reason to be concerned with possible adjustment costs for domestic import-competing industries located in the Quad. The diversion does imply losses for other developing countries. However, these losses are very small in relative terms, given the very small magnitude of LDC exports. Overall, the decline in exports of other developing