Electronic copy available at: http://ssrn.com/abstract=1715094 Banks
EMEA
Company: Rosbank, Bloomberg ticker ROSB RM
All data presented has been based solely on financial statements (IFRS financial reports for 2009, 2008,) found on the company website at http://www.rosbank.ru/en/reports/ .
Important objective of this report is to adhere to complete transparency. All ratios, coefficients, rate of change, etc… presented here can be found in supporting excel file which themselves are cross-referenced with the balance sheet data presented in the excel file.
Sample research
24 November 2010Electronic copy available at: http://ssrn.com/abstract=1715094
Part I. Company analysis
Company valuation via Free cash flow to equity model and Residual income model:
FCFE model Mio rubles
2007 2008 2009 2010(e) 2011(e) 2012(e) 2013(e) 2014(e)
Net income 6163 627 -14369 -2526
Depreciation and amortization 4608 8870 27545 13674
Other NCA -467 -19817 -928 -7071
Changes to non-cash capital
Minimum reserve deposits with
Central Bank of Russian Federation -1455 6078 -6811 -730 Deposits from Central Bank of
Russian Federation - 75250 -59290 7980
Due from banks-due to banks 10278 23756 -16087 5982 Net financial assets at fair value
through profit or loss -3440 3676 2123 786
Wk -1322 -1624 -1209 -1385
Disposal of fixed assets 1097 626 255 660
Net change in l.t. borrowing 3651 5163 -10090 -426
FCFE 19112 102606 -78861 14286 FCFE EX CB SUPPORT 19112 27356 -19571 6306 8724 12070 16699 23103 PV of FCFE 7435 8766 10336 TV 135323 PV of TV 83760
Total fair value of the company 110297
Per share value 147.76
Residual income model
2007 2008 2009
Common equity 40800 43154 32865
Shares outstanding 720 720 739
Book value per share 56.7 59.95 44.5
Per share value 55.5
Risk on Russia is closely related to oil price as can be evident from the oil/CDS1 relationship. Current CDS level is at historical
lows2. Rosbank valuation is standing in line with international comparisons, very close to the regression line (Chart 1). Any raise
in risk free rate will raise COE and therefore lower valuation.
1
Credit default swap on Russia
Sensitivity analysis to COE/ROE and Value of the company for Residual income model COE 15% 16% 17% 18% 19% 20% 21% 22% ROE 16% 50 17% 56 50 18% 62 55 49 19% 67 60 54 49 20% 73 65 59 53 48 21% 79 70 63 58 51 47 22% 84 75 68 62 54 50 47 23% 90 81 73 66 57 53 50 47
Cost of equity calculation
Ungeared beta based on regression results versus RTS index (2006-2008) 0.93
Russia l.t. bond yield, RUB 7.5%
Market risk premium for Russia* 10.7%
Terminal growth rate** 5.0%
CAPM cost of equity 17.3%
* Damadaran at ttp://ssrn.com/abstract=1556382 ** According to DB estimation
Input Data
Number of shares , mio 746.5
ROE, assumed 25% increase from 2004-2007 average 20.4%
Assumptions
2004 2005 2006 2007 2008
average prices (midcycle ROE)
ROE* 16.9% 15.5% 15.0% 17.9% 1.5% 16.3%
CAGR
Net income (mio Rubles) 2327 3018 9805 6163 38.4%
*Net income before extraordinary items - minority
Chart 1. P/B versus ROE
R-squared: 0.310252, t-Statistic: 7.223394, sample = 118 banks from EM, Rosbank marked in red
Chart 2. P/B versus ROE, Averages
R-squared: 0.335829, t-Statistic: 6.745910, sample = 92 banks from EM, Rosbank marked in red
0 1 2 3 4 5 6 0 10 20 30 40 50 P /B ROE 0 0.5 1 1.5 2 2.5 3 3.5 4 4.5 0 5 10 15 20 25 30 35 40 P /B 5 Y r A v g
Company analysis and comparables, ROSBANK Company analysis 2009 2008 Balance-sheet ratios Loans/Assets 0.55 0.65 Loans/Deposits 0.75 1.06 Deposits/Liabilities 0.79 0.67 Gearing (Assets/Equity) 13.83 11.64
Income statement ratios
Asset Margin 0.15 0.12 Liability Margin 0.08 -0.06 NIM 0.06 0.06 Growth rates Revenue 0.09 Operating expense 0.03 Provisions expense 2.24 Net profit -23.88 Comprehensive profit -5.97 Loans -0.15 Deposits 0.08 Assets -0.09 Performance Efficiency ratio -0.65 -0.56 ROAA -0.03 0.00 ROAE -0.37 0.01 Dividend Payout 0.00 0.00
Per share data
EPS -19.66 0.87 DPS NA NA BVPS 44.53 59.95 Asset Quality NPL/gross loans 0.35 0.30 Reserves/NPL 0.43 0.22 Reserves/total loans 0.21 0.07 Valuation
P/E negative earnings 0.87
P/B 44.47 59.95
International comparison, 93 sample banks, only some presented here
Short Name ROE
3Yr Avg ROE P/B P/B 5Yr Avg SBERBANK-CLS 22.4 13.3 2.3 3.1 TURKIYE GARANTI 26.4 29.8 2.5 2.2 AKBANK 21.1 20.1 2.3 2.3 ISBANK-C 21.0 18.3 2.0 1.8 PKOBP 13.4 21.3 2.5 3.5 PEKAO 14.1 18.5 2.6 3.2 YAPI KREDI BANK 20.1 21.2 2.5 2.3 KOMERCNI BANKA 17.0 21.1 2.2 2.5 OTP BANK PLC 13.6 21.1 1.2 2.3 TURKIYE VAKIFL-D 19.9 18.2 1.5 1.6 FINANSBANK 16.1 19.1 2.7 2.9 DENIZBANK AS 23.0 20.9 2.6 2.3 BZWBK 16.2 19.2 2.5 3.1 BRE 3.2 17.1 1.9 2.8 HANDLOWY 8.5 11.4 1.9 1.7 INGBSK 13.1 13.6 2.1 2.1 BRD-GROUPE SOCIE 25.1 35.4 1.8 4.1 GETIN 7.4 15.6 1.9 2.6 ZAGREBACKA BANKA 9.3 11.3 0.9 1.9 TURK EKONOMI BAN 16.9 17.1 1.4 1.9 PRIVREDNA BANKA 9.5 12.5 0.9 2.1 FORTIS BANK AS 5.5 9.8 1.2 1.5 BANKBPH 1.2 16.4 1.1 2.3 KREDYTB 1.3 10.8 1.5 2.0 VUB AS 15.5 18.7 1.0 1.9 TURKIYE SINAI 26.5 20.3 1.6 1.1 TATRA BANKA 12.9 18.1 0.8 1.5 SEKERBANK 16.7 18.6 1.1 1.5 NORDEABP 12.8 12.0 1.5 1.2 JSCB UKRSOTSBANK 2.0 12.1 0.9 2.8 ALTERNATIFBANK 16.4 21.1 1.1 2.1 BANK OF COMMUN-H 19.5 19.4 2.0 2.9
Eastern Europe Comparables
median 13.8 18.2 1.7 2.1
Emerging Asia Comparables
median 14.9 15.5 2.2 1.7
Latin America Comparables
median 20.6 22.6 3.2 2.3
Total sample median 15.8 17.6 2.2 2.1 ROSBANK, midcycle 16.3 14.1 2.4 2.9
Part 2. Macro view on banking sector in Russia
Central bank does not target amount of credit (money) in the economy, it targets short term interest rate (bank reserves) to run monetary policy today3. By having too much excess reserves (which central bank can create via open market operations),
banks can expand credit (deposits) in the economy and make profit on the difference between cost of liabilities and return on assets. Differently put, commercial banks are important vehicle in credit creation4. However, the ability of banks to create credit
does not necessarily mean that credit will be created. Credit can be either used for transactions that are within GDP accounting and within non-GDP accounting, such as all asset (real estate) and financial transactions. Thus during the last several decades we have observed increased amount of credit that has been used in financial and real estate transactions and therefore traditional quantity equation has recorded a decline in velocity (say M2, M3 velocity) since raising part of the money supply was used for non-GDP transactions.
In sum, the accurate representation of money supply in a large non-cash based economy is credit creation5. It is important to
distinguish between productive credit creation, which is used for the creation of new goods and services, and which is non-inflationary, and unproductive credit creation, which leads to one of two types of inflation. Unproductive credit creation can take the form of “consumptive credit”, which is the extension of credit for the consumption (but not creation) of goods and services – consumer price inflation (which hasn’t been observed due to emerging markets and China integration in the world economy with vast productive capacity and labor force). Unproductive credit creation can also take the form of non-GDP credit, which is credit created for the use in asset or financial transactions (observed in the USA, elsewhere). Excessive (>GDP growth rates) unproductive credit creation is unsustainable in the medium to long run6. When banks are exposed to unproductive credit, they
are exposed to asset price fluctuations. Consequently, if prices fall (when borrowing (credit) raises quicker than income (GNDI which is equal to GDP) is growing, at one stage the borrower will not be able to pay back/refinance all those loans) and as bank assets shrink, they can no longer expand credit to productive sector (and neither to unproductive) – this is Fisher’s debt deflation theory.
Credit in the broad term is what matters for asset prices. Asset prices and development of financial system is what mattered for growth during the last decade.
Below relationship between credit as proxied by major Russian banks7 assets, nominal GDP, real estate prices and RTS index
is being analyzed.
3
Many countries that introduced monetary targeting failed. The Bank of England went through a number of monetary targets without success. It finally abolished the procedure entirely in the mid-1980s. The bank of Japan was more successful, it met monetary targets with the utmost precision. By precisely controlling credit creation through its window guidance it could also achieve any targeted goal for deposit measures, such as M2+CD. Fed and Bank of England did not have window guidance. The reason for abandoning targets for money growth and instead setting interest rates as a way of making monetary policy comes from 1970s when prior stable relationship between money growth and either inflation or nominal income growth no longer existed (more in Friedman, Kutter (2010)).
4
An accurate representation of credit creation is given in (Werner (2009))
5 Via regression analysis, credit to productive part of GDP has been proved to be the most efficient in explaining the long turn performance. Other variable
such as interest rates, M0, M2 monetary aggregates are insignificant at conventional level of alpha. Bank credit appears to be in a stable long-term relationship with nominal GDP growth.
6 The problem with contemporary monetary policy is that credit creation vehicle is given to commercial banks. Being private entities, they aim at raise in
profitability and do not consider social wellbeing when conducting regular business. Short-termism is associated with raise in leverage and boom-bust cycles.
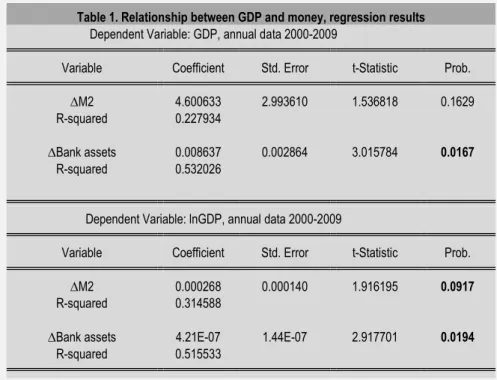
Table 1 shows that relationship between nominal GDP and money (credit) is better proxied by bank assets rather than M2 monetary aggregate.
Table 1. Relationship between GDP and money, regression results
Dependent Variable: GDP, annual data 2000-2009
Variable Coefficient Std. Error t-Statistic Prob. ∆M2 4.600633 2.993610 1.536818 0.1629 R-squared 0.227934
∆Bank assets 0.008637 0.002864 3.015784 0.0167
R-squared 0.532026
Dependent Variable: lnGDP, annual data 2000-2009
Variable Coefficient Std. Error t-Statistic Prob. ∆M2 0.000268 0.000140 1.916195 0.0917
R-squared 0.314588
∆Bank assets 4.21E-07 1.44E-07 2.917701 0.0194
R-squared 0.515533
Since GDP is a flow concept and monetary aggregate/bank credit is a stock concept, nominal GDP data is regressed on change in the monetary aggregate/bank credit for equalization purpose.
Real estate prices are too better aligned with credit rather than money stock, M2. (table 2)
Table 2. Relationship between GDP and money, regression results
Dependent Variable: ln Real Estate8, annual data 2000-2009
Variable Coefficient Std. Error t-Statistic Prob. ∆M2 0.000332 0.000161 2.059412 0.0734
R-squared 0.346468
∆Bank assets 5.32E-07 1.57E-07 3.381111 0.0096
R-squared 0.588306
It is, therefore, possible to conclude that bank assets have higher explanatory power in real estate movements, GDP
movements. Banks have access to funding via bonds, syndicated loans that get transferred to the real economy for productive usage as well as for unproductive usage (real estate, stock market).
8
Below, bank assets are regressed on oil price – relationship is strong.
Table 3. Relationship between bank assets and oil price, regression results
Dependent Variable: Bank assets, annual data 2000 - 2009
Variable Coefficient Std. Error t-Statistic Prob. OIL Price 107502.2 35536.19 3.025146 0.0144
R-squared 0.504173
Dependent Variable: lnBank assets, annual data 2000 - 2009
Variable Coefficient Std. Error t-Statistic Prob. LnOIL Price 1.493854 0.315379 4.736688 0.0011
R-squared 0.713706
Vector autoregression is applied to see if autoregressive process takes place.
Table 4. Vector Autoregression Estimates for bank assets and oil price, regression results
Standard errors in ( ) & t-statistics in [ ]
Bank Assets OIL Price Bank Assets t-1 -1.061424 -3.15E-05
(0.07894) (4.8E-05)
[-13.4458] [-0.66008] Bank Assets t-2 0.619011 4.91E-05
(0.09082) (5.5E-05)
[ 6.81579] [ 0.89428] Bank Assets t-3 1.826377 -4.48E-05
(0.11741) (7.1E-05) [ 15.5557] [-0.63109] OIL Price t-1 44199.26 0.421432 (816.097) (0.49297) [ 54.1593] [ 0.85488] OIL Price t-2 62131.91 2.729728 (2393.54) (1.44584) [ 25.9582] [ 1.88798] OIL Price t-3 73515.18 -0.108813 (3313.57) (2.00160) [ 22.1861] [-0.05436] R-squared 0.999992 0.922194
Indeed, there is an autoregression process in place, i.e. developments in oil price predict developments in credit but developments in credit do not predict developments in oil (unsurprisingly, since Russian credit is analyzed).
It is, therefore, possible to conclude that credit in the economy that is created by banks is basically explained by the oil price. If oil price is high, capital flows into the country, increasing money supply and credit and leading to raise in inflation. The latter occurs in the Russian economy for the following reasons: first of all, undeveloped (relatively to developed markets) financial system does not allow for complete sterilization of increases in money supply. Second of all, capacity (physical, labor) in Russia is relatively (relatively to, say, China) scarce, therefore scarce supply raises input prices and puts pressure on wages immediately, which is forwarded to final prices. Finally, Russia, being an exporting country, cannot afford strong currency (to support current account), and relatively weak currency leads to inflation since, naturally, import prices raise in local currency. The economic structure is, therefore, quite straightforward.
The application of the above analysis to the banking sector is straightforward, too. Profitability (ROA, ROE) is going to be dependent on commodity prices until structural changes take place in the economy (to move higher up the value creation chain and not to be dependent on commodities – this discussion is beyond the scope of this paper.)