Durham Research Online
Deposited in DRO:
06 August 2019
Version of attached le:
Accepted Version
Peer-review status of attached le:
Peer-reviewed
Citation for published item:
Obaid, Ahmed K. and Allen, Mark B. (2019) 'Landscape expressions of tectonics in the Zagros fold-and-thrust belt.', Tectonophysics., 766 . pp. 20-30.
Further information on publisher's website:
https://doi.org/10.1016/j.tecto.2019.05.024
Publisher's copyright statement: c
2019 This manuscript version is made available under the CC-BY-NC-ND 4.0 license
http://creativecommons.org/licenses/by-nc-nd/4.0/ Additional information:
Use policy
The full-text may be used and/or reproduced, and given to third parties in any format or medium, without prior permission or charge, for personal research or study, educational, or not-for-prot purposes provided that:
• a full bibliographic reference is made to the original source
• alinkis made to the metadata record in DRO
• the full-text is not changed in any way
The full-text must not be sold in any format or medium without the formal permission of the copyright holders. Please consult thefull DRO policyfor further details.
Durham University Library, Stockton Road, Durham DH1 3LY, United Kingdom Tel : +44 (0)191 334 3042 | Fax : +44 (0)191 334 2971
1
Landscape expressions of tectonics in the
Zagros fold-and-thrust belt
1 2
Ahmed K. Obaid 1,2, Mark B. Allen 2 3
1 Department of Geology, University of Baghdad, Al-Jadriyh Street, Baghdad, Iraq
4
2 Department of Earth Sciences, University of Durham, Durham DH1 3LE, UK
5 [email protected]; m.b.allen@durham,ac.uk 6 7
Abstract
8 9This study uses geomorphic indices, including normalized channel steepness index (ksn),
10
integrated relief and hypsometric index (HI), to investigate how landscape responds to 11
tectonic and climatic drivers in the Zagros fold-and-thrust belt, and show how geomorphology 12
can be a sensitive indicator of tectonic processes. There is a broad association of relatively 13
high ksn values (>50 m0.9) with the upper elevation limit for seismogenic thrusting, which
14
occurs regionally at the 1250 m topographic contour. Higher ksn values occur beyond this
15
seismicity cut-off in the Bakhtyari Culmination, but are rare in the Fars region. We measured 16
HI values for 17380 third order river basins across the Zagros. In many areas the low/high HI 17
transition (0.3) is typically at the elevation limit of seismogenic thrusting. There are two 18
important exceptions. In the Dezful Embayment/Bakhtyari Culmination the low/high HI 19
transition lies at higher elevations than the thrust seismicity cut-off. In the Fars region, the HI 20
transition lies at lower elevations than the seismicity cut-off. We explain these differences by 21
the different climates of the two areas: wetter conditions and vigorous drainage systems in the 22
Dezful/Bakhtyari region retard orogenic plateau growth; drier climate and low power rivers in 23
the Fars region promote plateau growth. Orographic precipitation may itself have a tectonic 24
control; regional basement strength variations have caused intense thrusting and high relief in 25
the Bakhtyari Culmination. Integrated relief of five across-strike Zagros topographic swath 26
profiles is in the range 2.2 – 2.8 108 m2. We argue that this consistency within ~25% relates to 27
the comparable strain rates across different sectors of the Zagros, regardless of local 28
structural, drainage network or climatic variations. 29
1. Introduction 30
The tectonics of the Zagros are far from completely understood, despite it being one of the 31
largest and most active fold-and-thrust belts on Earth (Fig. 1). Information in the present 32
landscape has not been fully analysed to improve tectonic models. Nor do we understand the 33
interactions of landscape, tectonics and climate. In this study we have conducted a range-wide 34
2
analysis of geomorphology to improve the current state of knowledge of Zagros tectonics. We 35
hypothesise that geomorphic and structural variations between different regions of the range 36
might correlate with variations in climate, but that the climatic variations might ultimately be 37
controlled by the pre-collisional, basement geology of the Zagros. 38
One of the major tectonic events of the Cenozoic was the closure of the Neo-Tethys Ocean. A 39
consequence of this closure was the Arabia-Eurasia collision, which initiated the Zagros fold-40
and-thrust belt as one of the largest and most tectonically active mountain ranges in the world 41
(Mouthereau et al., 2012). It has accommodated part of the Arabia-Eurasia convergence 42
(Blanc et al. 2003; McQuarrie, 2004; Ghasemi and Talbot, 2006; Alavi, 2007) since at least 43
the Early Miocene (Fakhari et al., 2008; Khadivi et al., 2010; Khadivi et al., 2012). The 44
Zagros fold-and-thrust belt deforms both the underlying basement and the overlying folded 45
sedimentary cover of the Arabian Plate (Talebian and Jackson, 2004). The Zagros represents 46
an area with a wide range of exposed geology, but mainly sedimentary rocks from the Jurassic 47
to the Holocene (Fig. 1b). 48
Whereas there is pronounced crustal deformation within the Zagros, shown by the abundant 49
seismicity and shortening across the range, the Turkish-Iranian Plateau represents a region of 50
the collision zone where there is little active convergence, relatively low relief, and subdued 51
seismicity (mainly strike-slip) (Nissen et al., 2011). The boundary between the plateau and the 52
active fold-and-thrust belt is debatable, but there is a marked cut-off in thrust seismicity at the 53
1250 m elevation contour (Fig. 1a). Most thrust events are confined to the low elevation part 54
of the Zagros Simply Folded Belt, below the 1250 m elevation contour (Nissen et al., 2011). 55
Elevations continue to climb to the northeast, but with little indication of active shortening, at 56
least at upper crustal levels (Allen et al., 2013). The thrust seismicity cut-off is therefore an 57
important marker for studies of landscape response to tectonism in the Zagros. 58
Active tectonism has been widely investigated using multiple geomorphic indices because of 59
their ability to detect the landscape response to tectonic drivers (e.g. Lavé and Avouac, 2000; 60
Keller and Pinter, 2002; Zielke at al., 2010). In addition, these indices provide measurements 61
which help assess the relative roles of crustal displacement and the variation in rock resistance 62
during landscape development (e.g. Walcott and Summerfield, 2008). . 63
The study of river-fold interaction in the Zagros has previously been dealt with by local 64
studies in different parts of the Zagros (e.g. Bahrami, 2013; Bretis et al., 2011; Burberry et al., 65
2008, 2010; Ramsey et al., 2008; Walker et. al., 2011; Zebari and Burberry, 2015; Obaid and 66
3
Allen, 2017). This paper studies the regional landscape response of the Zagros to potential 67
climatic and tectonic drivers. The geomorphic indices used are: hypsometric index (HI) of 68
drainage basins, ksn values, and the integrated topographic relief for across-strike topographic
69
swath profiles. 70
4 71
5 72
Fig.1. Regional topography, tectonics and lithologies of the Zagros fold-and-thrust belt. (a) Tectonic division zones after Berberian (1995), GPS 73
velocities (stable Eurasia reference frame) after Vernant et al., 2004. UDMA = Urumieh-Dokhtar Magmatic Arc; SSZ = Sanandaj-Sirjan Zone; 74
HZF = High Zagros Folds; ZSFB = Zagros Simply Fold Belt; LDF = Limit of Deformation Front; MB = Mesopotamian Basin. (b). Exposed 75
lithologies of the Zagros fold-and-thrust belt (redrawn after (1) the geological map of Turkey 1:2,000,000; (2) Sissakian, 2000 and (3) Afaghi and 76
Salek, 1975a; 1975b; 1977a; 1977b; 1977c; Afaghi et al., 1978).
77
6 1.1. Regional Zagros geology
79
The Zagros region has been subjected to a series of compressional and extensional phases 80
during its geological history that have initiated and later reactivated a series of basement 81
faults (Ameen 1992; Jassim and Goff 2006; Stern and Johnson 2010; Lacombe et al., 2011; 82
Burberry 2015). The Arabia-Eurasia collision is only the latest of these events. The Zagros 83
fold-and-thrust belt is built over what was the northern, passive continental margin of the 84
Arabian Plate before its initial collision with Eurasia. Initial collision may have been roughly 85
at the Eocene-Oligocene boundary (~35 Ma, Allen and Armstrong 2008; Perotti et al., 2016) 86
or in the Late Oligocene-Early Miocene (~27-23 Ma, Mouthereau et al., 2012; McQuarrie and 87
van Hinsbergen, 2013). The present Zagros fold-and–thrust belt (Fig. 1a) passes through the 88
north and northeast of Iraq, across southern Iran and ends at ~57o E where it juxtaposes the 89
Makran accretionary complex (Mouthereau et al., 2006; Alavi 2007). GPS data suggests that 90
the region accommodates a northward movement of the Arabian Plate at a rate of ~16-26 91
mm/yr (Vernant et al. 2004), with the convergence rate increasing eastwards. 92
The Zagros orogen consists of three main parallel tectonic units (Fig. 1a). From the northeast 93
to the southwest these units are the subduction-related Urumieh-Dokhtar Magmatic Arc, the 94
Sanandaj-Sirjan Zone and the Zagros fold-and-thrust belt. 95
Many folds have developed as a consequence of the Arabia-Eurasia collision. These are the 96
classic “whaleback” structures of the Zagros fold-and-thrust belt, which trend NW-SE along 97
the greater part of the range. Anticlines in the north western part of the Zagros (north of ~36o 98
N) and in the Fars region in the SE have more E-W trends (Fig.1). The High Zagros Fault 99
separates the High Zagros folds to the north from the Simply Folded Belt to the south. Other 100
structural divisions have been described across the strike of the orogen, but these are 101
secondary, and bounded by features such as the Mountain Front Fault that may not be 102
continuous along the length of the range (Fig.1). 103
Along the strike of the Zagros there are variations in the degree of exhumation, topographic 104
elevation, relief, stratigraphy, position of the deformation front and structural style changes 105
along strike (Talbot and Alavi, 1996). These along-strike changes divide the range into 106
several domains, referred to as salients and embayments, adjacent to the higher elevation 107
Turkish-Iranian Plateau to the northeast (Fig.1). These domains are the Kirkuk Embayment, 108
Lurestan (Pusht-e Kuh) Arc, Dezful Embayment and Fars Arc, from the northwest to 109
southeast (Berberian 1995; Lacombe et al., 2006; Mouthereau et al., 2007; Casciello et al., 110
7
2009). The southwestern margins of the Kirkuk and Dezful embayments form a roughly linear 111
deformation front, separated by the Lurestan/Pusht-e Kuh Arc (salient). To the southeast, the 112
Fars Arc forms a curved deformation front, convex to the south. There are differences in the 113
strain distribution within the Zagros related to the occurrence of the embayments (e.g. low 114
strain in the Dezful Embayment complemented by high strain in Bakhtyari Culmination) 115
(McQuarrie, 2004; Allen and Talebian, 2011). The origin of the Dezful Embayment has been 116
related to the pre-continental collision of the Arabian Plate margin, and the irregular 117
distribution of Cretaceous ophiolites upon it (Allen and Talebian 2011). It is not clear whether 118
this model applies to the Kirkuk Embayment, however. 119
The boundary between the Simply Folded Belt and the Mesopotamian Foreland Zone is the 120
current Zagros deformation front, although subtle Cretaceous-Cenozoic structures appear to 121
the south of this line (including oil and gas fields). The pre-collisional significance of the 122
boundary is unclear, but likely relates to differences in the Palaeozoic-Mesozoic rifting 123
history of the Arabian Plate, associated with the opening of Tethys. The “Unstable” and 124
“Stable” terms in stratigraphic descriptions (e.g. Jassim and Goff, 2006) relate to the 125
differences began in the pre-Cenozoic, pre-collisional, history and stratigraphy. 126
Because the Zagros fold-and-thrust belt is built on the original passive continental margin of 127
the Arabian Plate, the great majority of exposed rocks are sedimentary, and belong either to 128
pre- or post-collisional sequences. Total sedimentary thickness commonly exceeds 10 km. 129
Palaeozoic strata are rarely exposed. Precambrian basement occurs as fragments brought up 130
by diapirs of the Hormuz Series salt, itself of latest Precambrian-Cambrian age. Carbonates 131
occur at various levels within the stratigraphy, with important units in the Cretaceous 132
(Bangestan Group) and mid Tertiary (Asmari Limestone and equivalents). Later Tertiary and 133
Quaternary units are predominantly clastic, generally coarsen upwards and reveal the foreland 134
propagation of deformation (Ruh et al., 2014). In terms of erodibility (Moosdorf et al., 2018), 135
the carbonate units are particularly resistant, and commonly preserve the morphology of 136
anticlines. Later Cenozoic clastic units are less resistant, and are more commonly preserved in 137
synclines that are topographic lows between the anticlines. Within the Late Cenozoic clastics 138
there are evaporites within the Gachsaran Formation and marl in the Mishan and Aghajari 139
formations. 140
The climate of the Zagros is classified as arid to semi-arid with hot dry summers and cold dry 141
winters (Kottek et al., 2006). The interaction between the Mediterranean and Sudan Lows 142
8
synoptic systems with different elevations across the Zagros Mountains produces precipitation 143
variability in space and time (Boroujerdy et al., 2013). 144
2. Methods and data 145
2.1. Climate 146
Rainfall data from the Tropical Rainfall Measuring Mission satellite TRMM 3B43 147
(https://mirador.gsfc.nasa.gov/) were analysed for the time series 1998-2016 (resolution 148
0.25˚* 0.25˚~25*25 km) to allow investigation of first order precipitation variations on 149
geomorphic indices (Section 3.1), and broader interactions with tectonics. 150
2. 2. Topographic swath profiles 151
Swath profiles represent continuous changes of surface altitude along the swath by maximum, 152
mean and minimum elevations across the swath width. The general pattern of a landscape can 153
be represented by the mean elevation. The difference between the maximum and the 154
minimum elevations is the relief (Molin et al., 2004; Scotti et al., 2014) (also called incision 155
by Andreani et al., 2014; although there is no requirement that a previous surface is incised). 156
Twenty-five swath profiles oriented NE-SW have been analysed (supplementary figure 1), 157
using the Shuttle Radar Topography Mission (SRTM) 30 dataset
158
(https://www2.jpl.nasa.gov/srtm/) (30 m pixel size). The width of swaths is 25 km on either 159
side of the swath centre. Across-profile relief values were integrated to give an indication of 160
overall relief for the range within each profile area. This is the first time this relief integration 161
approach has been applied to the regional tectonic geomorphology of a fold-and-thrust belt, as 162
far as we are aware. Therefore the Zagros system is something of a test case. The intention is 163
to see what variation there is along the strike of the range, bearing in mind differences in the 164
structure and climate, as well as any other potential variables. 165
166
2.3. Normalized river-channel steepness (ksn) analysis
167
Features of active deformation can be recognised using the sensitivity of river profiles to 168
uplift processes (Seeber and Gornitz, 1983). Tectonic geomorphology methods include the 169
analysis of steady state river long profiles (e.g., Kirby et al., 2003; Snyder et al., 2000; 170
Whipple and Tucker, 1999; Wohl and Merritt, 2001) or methods which recognise a change in 171
base level (e.g., Boulton and Whittaker, 2009; Whipple, 2004; Whipple and Tucker, 1999, 172
9
2002; Whittaker and Boulton, 2012; Whittaker et al., 2007, 2008). Changes in the slope of 173
river profiles can be recognized by the occurrence of knickpoints, both in slope-area or 174
elevation-distance plots. Knickpoints can develop in response to tectonic effects (i.e. uplift 175
caused by folding and/or faulting), or changes in base level (Goldrick and Bishop, 2007; 176
Kirby and Whipple, 2012; Wobus et al., 2006), among other causes. Knickpoint distribution 177
has been used to identify tectonic forcing in active orogens (Miller et al., 2012; Schildgen et 178
al., 2012; Morell et al., 2012; Olivetti et al., 2012). 179
Tucker and Whipple (2002) and Whipple and Tucker (2002) described fluvial erosion in three 180
conditions. These conditions are 1) detachment-limited models, which represent bedrock 181
rivers where erosion is equal to uplift, and where a fall in base level or regional uplift and 182
substrate erodibility control the gradient of river. 2) Transport-limited models, where channel 183
gradient is determined by the capability of a river to transfer sediment. These cases are 184
alluvial rivers. 3) The third case is hybrid river models, where substrate erodibility and 185
sediment flux control the gradient of a channel. A dynamic equilibrium is required between 186
two competitive parameters; the rate of rock uplift and the rate of terrain removal to preserve 187
tectonic signals in the landforms (Dietrich et al., 2003). 188
The relationship between local slope of river channel (S) and upstream area (A) in the form of 189
a power law (Hack’s law) (Hack, 1957; Flint, 1974). 190
𝑆
=k
s 𝐴−𝜃(1)
191Where ks and 𝜃 are the steepness index and concavity index, respectively. Slope-area plots
192
allow the extraction of both S and A directly from DEMs using the regression of slope and 193
area data. Accordingly, the concavity index, θ, and the steepness index, ks, can be calculated. 194
The concavity index (θ) in Eq. (1) describes the change in slope along a graded river profile 195
(Wobus et al., 2006). Significant deviation from a theoretical graded profile, with a smooth 196
concave-up shape, reflects transient response to changes in tectonic rates (Boulton and 197
Whittaker, 2009; Snyder et al., 2000; Larue, 2008), rock structures and their resistance 198
differences (Larue, 2008; Phillips and Lutz, 2008) or other changes in base level and 199
landscape (Bowman et al., 2007; Harmar and Clifford, 2007). Although the concavity index 200
shows significant variability in natural streams, in a steady state it often has a value within the 201
range
~
0.4-0.6 (Kirby and Whipple, 2001; Snyder et al., 2000; Whipple, 2004; Wobus et al., 2022006). A steady state condition means that there is a balance between erosion and surface 203
10
uplift. This uniformity leads to the insensitivity of the concavity index to the factors 204
mentioned above. In contrast, the steepness index exhibits changes in value along the 205
segmented profile, dependent on these factors. The steepness index incorporates the change in 206
channel slope and drainage area, to deal with systematic variations in river gradient index as a 207
result of changes in basin shape and discharge (Goldrick and Bishop, 2007). 208
To overcome the dependence of longitudinal profiles on the basin shape, a linear regression of 209
gradient against drainage area should be applied on a log slope-log area plot. However, wide 210
variation in ks (regression intercept) can be the corollary of a small variation in 𝜃 (regression
211
slope). So, relying on the assumption of a restricted range of the concavity index in a steady 212
state (0.4 ≤ 𝜃 ≤ 0.6) (Kirby and Whipple, 2001; Kirby and Whipple, 2012; Snyder et al., 213
2000; Wobus et al., 2003; Wobus et al., 2006), the normalized steepness index (ksn)can be
214
determined by evaluating slope-area regression using a reference concavity (𝜃ref = 0.45) in
215
Eq. (2). 216
𝑆
=k
sn𝐴
−𝜃𝑟𝑒𝑓 (2) 217Here, the variation in drainage area can be surmounted and effective comparison between 218
streams profiles can be achieved, regardless of their catchment areas. In equilibrium 219
landscapes, similar concavities for multiple segments of a stream profile can be recognised, 220
but not similar steepness. Uplift results in steepened rivers, and accordingly the steepness 221
index will vary (Dietrich et al., 2003; Snyder et al., 2000). Thus, ksn can be used as a suitable
222
metric in tectonic geomorphology studies (Kirby and Whipple, 2001; Wobus et al., 2006). 223
The SRTM 30 dataset (30 m pixel size) was used for the purpose of drainage network 224
extraction, using MATLAB-based TecDEM 2.2 software (Shahzad and Gloaguen, 2011). The
225
D8 algorithm (Jones, 2002) was applied to calculate flow directions. 226
The first step in deriving ksn values is river profile generation. For this process, a minimum
227
threshold of 105 m2 contributing area was used to ensure fluvial dominated channel flow 228
(Kirby and Whipple, 2001; Montgomery and Foufoula-Georgiou, 1994; Wobus et al., 2006). 229
Using Stream Profiler software, the ksn value was calculated for the whole Zagros using a
230
reference concavity of 𝜃ref = 0.45 (Wobus et al., 2006) to overcome lithological effects on the
231
concavity index, and consequently the steepness index. Also we used TopoToolbox 2 232
MATLAB-based software (Schwanghart and Scherler, 2014) to calculate the ksn of all river
233
segments across the Zagros which have length more than 1 km. Results were compared with 234
11
lithologies represented on geological maps, to determine whether HI values are affected by 235
active tectonic or lithological changes. 236
SRTM data have inherent errors (Boulton and Stokes, 2018) which result in voids that affect 237
the flow-routing algorithm. Therefore, to test the method of river profile extraction, the 238
QaraChwalan River profile was extracted manually from the SRTM 30 m data using Global 239
Mapper GIS, and compared with the automatic extracted profile (supplementary Fig. 2). No 240
difference was found between the two profiles, which indicates the reliability of the automatic 241
drainage network extraction technique. 242
2.4. Hypsometric Index (HI) 243
The idea of hypsometry was first used to express the forms of drainage basins (catchments) 244
and their slopes (Langbein, 1947). Strahler (1952) introduced the idea of the hypsometric 245
index, or integral (HI). 246
For a given drainage basin, HI refers to the amount of residual terrain above the lowest 247
horizontal plane of a basin and it can be used as a proxy for the erosional stage and landform 248
development (Strahler, 1952; Schumm, 1956). High HI values (close to 1) mean that uplift is 249
greater than erosion and the land surface is in a youthful stage, while low HI values (close to 250
0), erosion is greater than uplift and the land surface is in a mature stage. This dimensionless 251
form enables the comparison between different basins regardless of their areas. 252
HI is a powerful tool to investigate the relative tectonism of an area, by characterizing the 253
topographic dissection of a basin (Keller and Pinter, 2002). Due to the development of Digital 254
Elevation Models (DEMs), HI can be calculated using Eq. (3) (Pike and Wilson, 1971; Keller 255 and Pinter, 2002). 256 𝐻𝐼 = 𝐻𝑚𝑒𝑎𝑛−𝐻𝑚𝑖𝑛 𝐻𝑚𝑎𝑥−𝐻𝑚𝑖𝑛 (3) 257
Where Hmax, Hmin, and Hmean are the maximum, minimum, and mean elevations respectively.
258
We adopt the approach of Gao et al. (2016), who measured HI for drainage basins of a 259
particular stream order to map out regional variations in the east of the Tibetan Plateau. The 260
rationale is that drainage basins are naturally-defined areas that reflect both tectonics and 261
lithology, and so align with changes in one or both of these parameters (e.g. slip and uplift on 262
active faults). 263
12
The parameters of Eq. (3) were obtained directly from DEM data and HI was calculated using 264
TecDEM 2.2 MATLAB-based and standard ArcGIS 10.3.1 software. The HI data were 265
converted into raster mode using the polygon to raster function within the ArcGIS 10.3.1 to 266
extract swath profiles for the HI data across different regions in the Zagros. 267
HI values for 4th order (supplementary Fig. 3a) 5th order (supplementary Fig. 3b)and6th order 268
river basins (supplementary Fig. 3c) have been tested for a comparative analysis of HI values 269
at different scales of drainage (supplementary Fig. 3a, b and c). The distribution of HI classes 270
across the Zagros is similar for all orders of river basins, but the large area basins (i.e. 6th 271
order) lack enough resolution to distinguish changes in HI values and hence potential changes 272
in tectonic style. Thus, the use of the third order river basin is preferred as it gives more 273
detailed results about landscape response to tectonics. Using second or first order basins 274
introduced problems because of the extra processing time required, and artefacts introduced 275
by the resolution of the DEM data and the ability of the software to define drainage basins 276 accurately. 277 3. Results 278 3.1. Climate 279
The TRMM 3B43 data show high variability in precipitation across different regions of the 280
Zagros (Fig. 2), taking average annual values from the dataset. The maximum precipitation (~ 281
0.35 m/year) occurs in the Bakhtyari Culmination, parts of Lurestan and the northeast of the 282
Kirkuk Embayment. The minimum precipitation (0.05 m/year) occurs in the central and 283
eastern Fars regions, the interior of the Turkish-Iranian Plateau and in the foreland. In the 284
Discussion we look at the geomorphic and tectonic data in the light of this climatic variation. 285
13 286
287
Fig. 2. SRTM 30 m shaded relief map of the Zagros, overlain by mean annual precipitation from the TRMM satellite 288
(https://mirador.gsfc.nasa.gov/) for the period 1998-2016. Note the difference in precipitation between the Fars and Dezful/Bakhtyari regions. 289
14 290
3.2. Topographic swath profile analysis 291
Five swath profiles across the Zagros are shown in Fig. 3 as representative of the 25 analysed. 292
These profiles show variations in topography across different regions of the range. The 293
difference in elevation (relief) varies from ~<50 m within the Dezful Embayment to >2500 m 294
in the Bakhtyari Culmination. Some profiles exhibit a gradual decline in elevation towards the 295
foreland such as the Sinjar and Kirkuk profiles. Other profiles show a sharp drop towards the 296
foreland, such as the Lurestan and Dezful examples. There is an increase in elevation and 297
gradient towards the hinterland at or near the limit of seismogenic thrusting at 1250 m 298
elevation (Allen et al., 2013) in both the Lurestan and Dezful sections. In contrast, there are 299
very gentle changes in elevation across the Fars region, even when passing through the thrust 300
seismicity cut-off at ~1250 m elevation, and across the High Zagros Fault. The difference 301
between the maximum and the minimum elevations within the swaths (relief) shows where 302
river networks dissect the landscapes. We integrate the relief of swath profiles (Fig. 3b). The 303
cumulative difference between the maximum and minimum elevations (shaded areas in Fig. 304
3b) shows a difference of ~25% between the five profiles. 305
15 306
16 307
Fig. 3. SRTM 30 m topography of the Zagros fold-and-thrust belt. (a) Locations for topographic swath profiles. (b) Mean, Maximum and 308
minimum elevation along the swath profiles. Integrated relief graphs show a limited relief difference in the order of ~25% between representative 309
swath profiles. LST = Limit of seismogenic thrusting; HZF = High Zagros Fault; MRF = Main Recent Fault; ZS = Zagros Suture. 310
17 3.3. Normalized river-channel steepness (ksn)
311
Longitudinal profiles (supplementary figure 4) were generated for all river segments with a 312
length of more than 1 km (Fig. 4a and b). Reaches of ksn <50 m0.9 are distributed across the
313
Iranian plateau, the foreland, intermontane rivers and the Fars region (Fig. 4). Ranges of 50 ≤ 314
ksn ≤100 m0.9 occur in the high relief areas of the Bakhtyari Culmination, Sirwan River basin,
315
and in terrain at close the 1250 m elevation contour in the NW Zagros, near the Iraq-Turkey 316
border (Fig. 4). A similar distribution occurs across the high relief areas when considering the 317
range of 100 ≤ ksn ≤150 m0.9 (Fig. 4). Values of ksn ≥150 m0.9 occur only for a few river
318
segments in the high relief areas of the Bakhtyari and the NW Zagros of Iraq and Turkey 319
(Fig.4). Generally, the Fars region exhibits relatively low ksn values compared with other
320
areas of the Zagros (Fig. 4). 321
18 322
19 324
Fig.4. Distribution of ksn values for Zagros river segments. (a) ksn values using MATLAB-Based stream profiler; note the low values in the Fars
325
region. (b) ksn values extracted using TopoToolbox software. Note the high values in the Bakhtyari Culmination and the northeast of the Kirkuk
326
Embayment. 327
20 3.4. Hypsometric Index (HI)
328
Results from 17380 third order river basins across the Zagros reflect two major groups of 329
relative low HI values (HI <0.3) (Fig. 5). The first group of relative low HI values represents 330
the Turkish-Iranian Plateau where topographic gradients are very low (Allen et al., 2013). The 331
second group of relative low HI region occurs across the foreland and Mesopotamian plain. 332
Intermediate and relatively high HI values (>0.3) occur across the mountainous areas of the 333
Zagros which are characterized by high relief and gradient (Fig. 6). Highest values occur 334
northeast of the Kirkuk Embayment, in the Bakhtyari Culmination, and close to the coast in 335
the Fars region (Fig. 5). 336
Along much of the Zagros there is a coincidence between the transition limit from HI values 337
of <0.3 to >0.3 upper elevation limit of seismogenic thrusting (Fig. 5). This pattern is seen 338
northeast of the Kirkuk Embayment, along the Lurestan/Pusht-e Kuh Arc and in the region of 339
the Kazerun Fault (western Fars). Different patterns occur in the Bakhtyari Culmination and 340
in the southeast of the Zagros (Fars region). In the Bakhtyari Culmination relatively high HI 341
values persist northeast of (above) the 1250 m elevation contour and the limit of seismogenic 342
thrusting. In the Fars region, seismogenic thrusting continues north of the transition from high 343
to low HI values (taken as HI = 0.3). 344
Swath profiles from raster data of the HI value across the Zagros (Fig. 6) show the HI value 345
increasing in areas of high relief but not within high elevation regions. Differences in 346
lithology have been examined to assess whether lithology is a significant control on HI value: 347
Figure 7 shows both HI values and lithologies for the Bakhtyari Culmination; there is no clear 348
correlation between them. 349
21 350
351
Fig. 5. HI values for 3rd order drainage basins across the Zagros. There is a broad region of relative high HI (>0.3; green-amethyst colours) along 352
the Zagros, between the Iranian Plateau and the foreland. Specific regions show variations to this broad trend. In the Bakhtyari Culmination, the 353
high/low HI transition lies at higher elevations than the thrust seismicity cut-off (~1250 m elevation contour), while in the Fars region the 354
high/low HI transition takes place at lower elevations than this cut-off. 355
22 356
Fig.6. Swath profiles extracted from HI raster data show the variation in HI across the Zagros 357
range along the swaths in Fig. 5. The width of swaths is 25 km on either side of the swath 358
centre. LST = Limit of seismogenic thrusting; ZS = Zagros Suture; HZF = High Zagros Fault; 359
MRF = Main Recent Fault. The Fars region has high HI values southwest of the LST, in the 360
opposite sense to the Dezful region. 361
362
23
Fig. 7. HI values in the Bakhtyari Culmination plotted over the geological map (geology from 364
sources in Fig. 1b), which shows similar HI values across different lithologies, and different 365
HI values across the same lithology. 366
4. Discussion 367
4.1. Swath profiles 368
The Sinjar, Kirkuk and Fars sections show steady increases in elevation toward the hinterland 369
for the first ~200 km of the swath profiles (Fig. 3), which is well-established by previous 370
work (see McQuarrie, 2004; Mouthereau et al., 2012; Allen et al., 2013 and references 371
therein). Integrating the relief along each profile (Fig. 3) shows the values for each profile are 372
within ~25% of each other, at 2.2 – 2.8 x 10⁸ m2. Given that this is a new approach to 373
analyzing the geomorphology of active fold-and-thrust belts, it is not possible to make 374
detailed comparisons with other ranges. However, we suggest that a ~25% variation is not 375
large, considering the variation is structure and climate in different parts of the Zagros. This 376
in turn suggests that the integrated relief of the mountain range may be less controlled by the 377
parameters which vary along the Zagros, such as the width of the seismogenic belt, or 378
maximum topographic gradient, and more by parameters which are similar across strike, such 379
as strain rate (Masson et al., 2005), overall shortening (McQuarrie, 2004; Vergés et al., 2011; 380
Allen et al., 2013), or the elevation difference between the hinterland plateau and the 381
undeformed foreland. 382
4.2. Normalized river-channel steepness (ksn)
383
Bearing in mind that surface uplift is extremely unlikely to be uniform across the entire 384
Zagros, with implications for the applicability of a uniform approach to analyzing ksn (Snyder
385
et al., 2000), there are broad differences in ksn values as follows. There is a general pattern
386
that higher ksn values occur where the rivers cross the 1250 m contour (Fig. 4), and so from
387
the interior, relatively aseismic region into the thrust-seismogenic part of the Zagros, but this 388
is a broad distinction, without a sharp change. ksn values are lower in the Fars region than
389
elsewhere in the Zagros. Kirby and Whipple (2012) noted the correlation between the linear 390
physiographic transition of Lesser/Greater Himalaya and the northward increase in ksn values.
391
The zone of high ksn values is on the hanging wall of the Himalayan Main Central Thrust
392
(MCT), interpreted as relating to the active uplift in the vicinity of this fault. The 393
Longmenshan in SE Tibet is another example of a sharp boundary between high and low ksn
394
values, in the region of the active Yingxiu-Beichuan and Pengguan faults (Gao et al., 2016). 395
24
Such sharp distinctions have not been found in the ksn distribution of the Zagros, perhaps due
396
to the tectonic difference between the multiple, segmented, blind thrusts of the Zagros, and 397
the laterally continuous and large scale thrusts of the Himalaya (i.e. the MCT) and SE Tibet. 398
Rivers in the Fars region commonly divert around the tips of anticlines or cross relay zones 399
between them. This is because of low discharge of rivers including the internally drained 400
basins in the region. The relatively dry climate has led to limited and ephemeral discharge of 401
rivers which is not enough to overcome the growth of anticlines. Therefore the Fars region 402
rivers have low ksn values (Fig. 4) and commonly divert around anticlines (Ramsey et al.,
403
2008). Although there are many anticlines and active seismicity in the Fars region, the dry 404
climate has an important effect in the formation of axial rivers (Ramsey et al., 2008). 405
Transverse rivers commonly occur in the Dezful/Bakhtyari region as a result of relatively 406
high precipitation and intense thrusting in the Bakhtyari Culmination, which enable rivers to 407
incise as they cross numerous anticlines. 408
4.3. Hypsometric Index (HI) 409
In the Bakhtyari Culmination (Fig. 7) we examine changes in bedrock lithologies and their 410
effects on the HI value. The Culmination consists mainly of limestones, limestones alternating 411
with marls and conglomerates, patches of ophiolitic lithologies (e.g. serpentinite, basalt), and 412
sandstones and conglomerates of the Bakhtyari Formation. To the northeast of the 413
Culmination there is a series of igneous and metamorphic rocks. For the same lithology there 414
are significant differences in the HI value. In contrast, there are areas where different 415
lithologies, such as the ophiolitic assemblages and limestones, show similar HI values (0.3-416
0.4) (Fig. 7). This result implies that differences in lithology have limited effects on the HI 417
value. 418
Figure 2 shows the climatic variation within and across the Zagros, with a seven-fold 419
difference between annual precipitation in the wettest areas (Dezful/Bakhtyari Culmination) 420
and the driest areas (parts of Fars). The relatively wet climate in the Dezful/Bakhtyari regions 421
(Fig. 2) enables the river system to erode the landscape in an area where deformation takes 422
place predominantly in a narrow zone of high strain (Allen et al., 2013) and steep slopes: the 423
Bakhtyari Culmination. The high HI region continues to the northeast of the seismogenic limit 424
of thrusting (Fig. 5). From the tectonic perspective, this region has become part of the 425
Turkish-Iranian Plateau, in that it is not experiencing active (seismogenic) shortening; from a 426
25
geomorphic perspective, it has not yet become a relatively low relief plateau, because of the 427
relief created and maintained by the drainage network (Figs. 5 and 6). 428
In the Fars region, the exposed lithology is mainly limestone, which resists erosion on the 429
flanks and crests of anticlines (Fig. 1). The relatively dry climate in Fars (Fig. 2), combined 430
with low regional gradients and sinuous rivers, reduces stream power, and thus erosion rates. 431
Consequently, the low HI zone occurs south of the limit of seismogenic thrusting (Fig. 5). 432
This part of the Fars region behaves in the opposite sense to the Dezful/Bakhtyari region, in 433
that it still experiences thrust seismicity, even in a low relief area that resembles the 434
essentially aseismic plateau interior further north (Fig. 8). We attribute the difference in the 435
location of the low/high HI transition to differences in the basement of the Dezful/Bakhtyari 436
and Fars regions. Deformation is focused in the Bakhtyari Culmination because the adjacent 437
Dezful Embayment resists deformation, attributed by Allen and Talebian (2011) to the 438
different pre-collisional histories of the Dezful Embayment and adjacent areas. There is no 439
difference within the Fars region (Allen et al., 2013; Talebian and Jackson, 2004). These 440
tectonic differences have a climatic positive feedback result in the relatively wet climate in 441
the Dezful/Bakhtyari, where there is a higher topographic barrier, while in contrast, a 442
relatively dry climate and low relief occur in the Fars region (Figs. 1, 2 and 5). 443
Regional analysis of HI values on a drainage basin scale does not show sharp changes across 444
individual structures, which would be expected if active deformation was controlled by a 445
small number of major thrusts in the Zagros. This pattern contrasts with the east of the 446
Tibetan Plateau (Longmenshan), where such abrupt jumps in HI have been observed (Gao et 447
al., 2016). 448
In the Zagros study area, HI is a more effective tool than ksn analysis, for highlighting
449
geomorphic variations that relate to the active tectonics and climate. We do not make this as a 450
universal claim, but it will be interesting to apply HI analysis in the form used by Gao et al 451
(2016) and in this paper, to other active fold-and-thrust belts in the world. 452
5. Conclusions 453
In this paper we show that the geomorphic index HI provides insights into the landscape 454
response to tectonics and climate in the Zagros (Fig. 5), and it is more effective in this regard 455
than the more commonly used ksn analysis (Fig. 4). Differences in geomorphic indices across
456
two specific areas in the Zagros can be explained by the different climate of the two areas: 457
26
wetter conditions and vigorous drainage systems in the Dezful/Bakhtyari region retard plateau 458
growth; drier climate leads to low stream power of rivers in the Fars region and promotes 459
plateau growth (Fig. 8). The cut-off in thrust seismicity, proxied by the 1250 m elevation 460
contour, provides a simple tectonic boundary marker for comparison (Nissen et al., 2011). 461
Orographic precipitation may itself have a tectonic control; regional basement strength 462
variations are another plausible cause (Allen and Talebian, 2011). Strong basement in the 463
Dezful Embayment keeps the amount of strain low in this region, but produces intense 464
thrusting and steep relief in the Bakhtyari Culmination to its northeast, so that the overall 465
strain across this part of the Zagros is similar to adjacent regions (Allen and Talebian, 2011). 466
It is possible that the Kirkuk Embayment has a similar origin to the Dezful Embayment, with 467
the same consequence, that high strain is concentrated in the imbricate zone to its northeast 468
where high ksn, HI and high relief occur.
469
We conclude that there is a positive feedback of tectonics and climate, which leads to the 470
wetter climate in the Bakhtyari Culmination, and causes rivers to cut efficiently through 471
landscapes. Youthful, high relief landscapes are the result, in contrast with the drier climate of 472
the Fars region: the Fars climate promotes subdued landscapes and plateau-like 473
geomorphologies in an area that is actively shortening by seismogenic thrusting. 474
Integrated relief along five topographic swath profiles is similar to within ~25% (Fig. 3). 475
These profiles are different to each other in terms of the distribution of elevation and climate. 476
We argue that the degree of relative similarity between the integrated relief is related to one or 477
more of the parameters that are similar between different regions, such as such as strain rate, 478
overall shortening, or the elevation difference between the hinterland plateau and the 479
undeformed foreland. 480
27 481
482
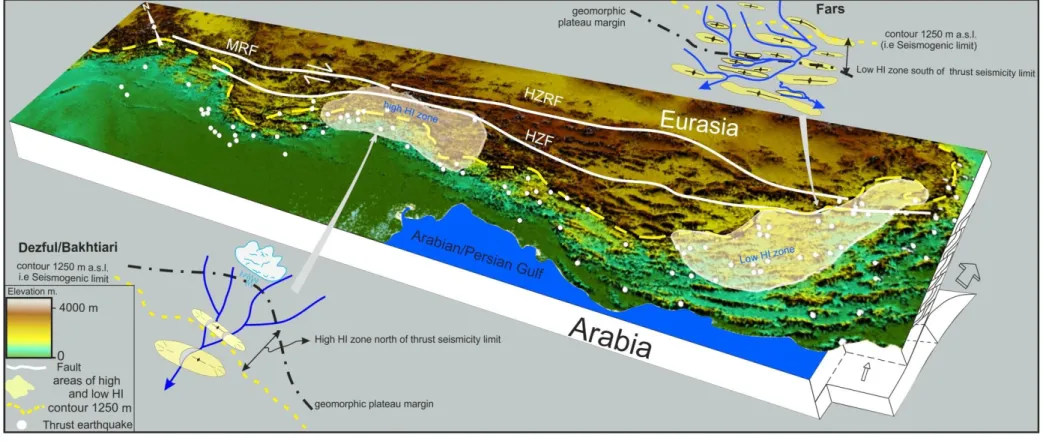
Fig. 8. Model showing how the Zagros topography responds to tectonism in term of changes in HI value. Relative high and relative low HI 483
regions relate to the cut-off in thrust seismicity (proxied by the 1250 m elevation contour). The geomorphic plateau margin is retarded to the 484
northeast in the Dezful/Bakhtyari region, and advances southwest in the Fars region. 485
28 Acknowledgements
486
We thank the Ministry of Higher Education and Scientific Research in Iraq for their support 487
of the first author's project. We thank Chris Saville for useful discussion of geomorphic 488
indices and Sarah Boulton for her help with stream profile analysis. The first author would 489
like to thanks the Institution of Geological Survey of Iraq (GEOSURV) for providing 490
geological maps included in this paper. Christoph Grützner and David Fernández-Blanco 491
provided constructive reviews. We are grateful to Christoph von Hagke and Olivier Lacombe 492
for handling the editorial process. 493
References
494
Afaghi, A, Salek, M. M., 1975a. Geological map of Iran, sheet No., 5 North-west Iran, 495
National Iranian Oil Company, Tehran, Iran, scale 1:1,000,000. 496
Afaghi, A, Salek, M. M., 1975b. Geological map of Iran, sheet No., 4 South-West Iran, 497
National Iranian Oil Company, Tehran, Iran, scale 1:1,000,000. 498
Afaghi, A, Salek, M. M., 1977a. Geological map of Iran, sheet No., 2 North-Central Iran, 499
National Iranian Oil Company, Tehran, Iran, scale 1:1,000,000. 500
Afaghi, A, Salek, M. M., 1977b. Geological map of Iran, sheet No., 3 North-East Iran, 501
National Iranian Oil Company, Tehran, Iran, scale 1:1,000,000. 502
Afaghi, A, Salek, M. M., 1977c. Geological map of Iran, sheet No., 6 South-East Iran, 503
National Iranian Oil Company, Tehran, Iran, scale 1:1,000,000. 504
Afaghi, A, Salek, M. M., Moazami, J., 1978. Geological map of Iran, sheet No., 1 North-west 505
Iran, National Iranian Oil Company, Tehran, Iran, scale 1:1,000,000. 506
Alavi, M., 2007. Structures of the Zagros fold-thrust belt in Iran. American Journal of Science 507
307, 1064–1095. 508
Allen, M. B., Armstrong, H. A., 2008. Arabia-Eurasia collision and the forcing of mid-509
Cenozoic global cooling. Palaeogeography, Palaeoclimatology, Palaeoecology. 265, 52– 510
58. 511
Allen, M. B., Talebian, M., 2011. Structural variation along the Zagros and the nature of the 512
Dezful Embayment. Geological Magazine 148, 911-924. 513
doi:10.1017/S0016756811000318. 514
Allen, M. B., Saville, C., Blanc, E. J.-P., Talebian, M., Nissen, E., 2013. Orogenic plateau 515
growth: Expansion of the Turkish-Iranian Plateau across the Zagros fold-and-thrust belt, 516
Tectonics 32, 171–190, doi:10.1002/tect.20025. 517
29
Ameen, M. S., 1992. Effect of basement tectonics on hydrocarbon generation, migration, and 518
accumulation in Northern Iraq. American Association of Petroleum Geologists Bulletin 519
76, 356–370. 520
Andreani, L., Stanek, P. K., Gloaguen, R., Krentz, Ottomar, Dominquez-Gonzalez, L., 2014. 521
DEM-Based Analysis of interactions between tectonics and landscapes in the Or 522
Mountain and Eger Rift (East Germany and NW Czech Republic). Remote Sensing 6, 523
7971–8001. 524
Bahrami, S., 2013. Analyzing the drainage system anomaly of zagros basins: Implications for 525
active tectonics. Tectonophysics 608, 914–928. 526
Berberian, M., 1995. Master “blind” thrust faults hidden under the Zagros folds: active 527
basement tectonics and surface morphotectonics. Tectonophysics 241, 193–224. 528
Blanc, E. J.-P., Allen, M. B., Inger, S., Hassani, H., 2003. Structural styles in the Zagros 529
Simple Folded Zone, Iran. Journal of the Geological Society 160, 40–412. 530
Boroujerdy, P., Nasrollahi, N., Hsu, K., Sorooshian, S., 2013. Evaluation of satellite-based 531
precipitation estimation over Iran. Journal of Arid Environments 97, 205–219. 532
Boulton, S.J., Whittaker, A.C., 2009. Quantifying the slip rates, spatial distribution and 533
evolution of active normal faults from geomorphic analysis: Field examples from an 534
oblique-extensional graben, southern Turkey. Geomorphology 104, 299–316. 535
Boulton, S.J., Stokes, M., 2018. Which DEM is best for analyzing fluvial landscape 536
development in mountainous terrains? Geomorphology 310, 168-187. 537
Bowman, D., Shachnovich-Firtel, Y., Devora, S., 2007. Stream channel convexity induced by 538
continuous base level lowering, the Dead Sea, Israel. Geomorphology 92, 60–75. 539
doi:10.1016/j.geomorph.2007.02.009. 540
Bretis, B., Bartl, N., Grasemann, B., 2011. Lateral fold growth and linkage in the Zagros fold 541
and thrust belt (Kurdistan, NE Iraq). Basin Research 23, 615–630. 542
Burberry, C.M., Cosgrove, J.W. and Liu, J.G., 2008. Spatial arrangement of fold types in the 543
Zagros Simply Folded Belt, Iran, indicated by landform morphology and drainage 544
pattern characteristics. Journal of Maps 4, 417-430. 545
Burberry, C. M., Cosgrove, J. W. Liu, J.-G., 2010. A study of fold characteristics and 546
deformation style using the evolution of the land surface: Zagros Simply Folded Belt, 547
Iran. Geological Society, London, Special Publications 330,139-154. 548
Burberry, C. M. 2015. The effect of basement faults reactivation on the Triassic-Recent 549
30
geology of Kurdistan , North Iraq. Journal of Petroleum Geology 38, 37–58. 550
Casciello, E., Vergés, J., Saura, E., Casini, G., Fernandez, N., Blanc, E., Homke, S., Hunt, 551
D.W., 2009. Fold patterns and multilayer rheology of the Lurestan Province, Zagros 552
Simply Folded Belt (Iran). Journal of the Geological Society 166, 947–959. 553
Dietrich, W.E., Bellugi, D.G., Heimsath, A.M., Roering, J.J., Sklar, L.S., Stock, J.D., 2003. 554
Geomorphic Transport Laws for Predicting Landscape Form and Dynamics. Geophys. 555
Monogr. 135, 1–30. doi:10.1029/135GM09 556
Fakhari, M.D., Axen, G.J., Horton, B.K., Hassanzadeh, J., Amini, A., 2008. Revised age of 557
proximal deposits in the Zagros foreland basin and implication for Cenozoic evolution of 558
the High Zagros. Tectonophysics 451, 170–185. 559
Flint, J.J., 1974. Stream gradient as a function of order, magnitude, and discharge. Water 560
Resources Research 10, 969–973. doi:10.1029/WR010i005p00969. 561
Gao, M., Zeilinger, G., Xu, X., Tan, X., Wang, Q., Hao, M., 2016. Active tectonics evaluation 562
from geomorphic indices for the central and the southern Longmenshan range on the 563
Eastern Tibetan Plateau, China. Tectonics, 35, 1812–1826, doi:10.1002/2015TC004080. 564
Ghasemi, A., Talbot, C., 2006. A new tectonic scenario for the Sanandaj-Sirjan Zone (Iran). 565
Journal of Asian Earth Sciences 26, 683–693. 566
Goldrick, G., Bishop, P., 2007. Regional analysis of bedrock stream long profiles: evaluation 567
of Hack’s SL form, and formulation and assessment of an alternative (the DS form). 568
Earth Surface Processes and Landforms 32, 649–6714. doi:10.1002/esp. 569
Hack, J.T., 1957. Studies of Longitudinal Stream Profiles in Virginia and Maryland. U.S. 570
Geological Survey Professional Paper 294-B, 97. 571
Harmar, O.P., Clifford, N.J., 2007. Geomorphological explanation of the long profile of the 572
Lower Mississippi River. Geomorphology 84, 222-240. 573
doi:10.1016/j.geomorph.2006.01.045. 574
Jassim, S. Z., Goff, J.C., 2006. Geology of Iraq, first ed. Dolin Prague and Moravian 575
Museum, Prague (341pp). 576
Jones, R., 2002. Algorithms for using a DEM for mapping catchment areas of stream 577
sediment samples. Computers and Geosciences 28, 1051-1060. 578
Keller, E., Pinter, N., 2002. Active Tectonics: Earthquakes, Uplift, and Landscape. Prentice 579
Hall, New Jersey. 580
Khadivi, S., Mouthereau, F., Larrasoaña, J.C., Vergés, J., Lacombe, O., Khademi, E., 581
Beamud, E., Melinte-Dobrinescu, M. and Suc, J.P., 2010. Magnetochronology of 582
synorogenic Miocene foreland sediments in the Fars arc of the Zagros Folded Belt (SW 583
31 Iran). Basin Research 22,918-932.
584
Khadivi, S., Mouthereau, F., Barbarand, J., Adatte, T. and Lacombe, O., 2012. Constraints on 585
palaeodrainage evolution induced by uplift and exhumation on the southern flank of the 586
Zagros–Iranian Plateau. Journal of the Geological Society 169, 83-97. 587
Kirby, E., Whipple, K., 2001. Quantifying differential rock-uplift rates via stream profile 588
analysis. Geology 29, 415-418. 589
Kirby, E., Whipple, K.X., Tang, W., Chen, Z.,2003. Distribution of active rock uplift along 590
the eastern margin of the Tibetan plateau:inferences from bedrock river profiles. Journal 591
of Geophysical Research: Solid Earth 108, 2217. 592
http://dx.doi.org/10.1029/2001JB000861. 593
Kirby, E., Whipple, K.X., 2012. Expression of active tectonics in erosional landscapes. Journa 594
of Structural Geology 44, 54–75. doi:10.1016/j.jsg.2012.07.009. 595
Koshnaw, R.I., Horton, B.K., Stockli, D.F., Barber, D.E., Tamar-Agha, M.Y., Kendall, J.J., 596
2017. Neogene shortening and exhumation of the Zagros fold-thrust belt and foreland 597
basin in the Kurdistan region of northern Iraq. Tectonophysics 694, 332–355. 598
Kottek, M., Grieser, Jj., Beck, C., Rudolf, B.,Rubel, F., 2006. World Map of the Koppen-599
Geiger climate classification updated. Meteorologische Zeitschrift 15, 259–263. 600
Lacombe, O., Mouthereau, F., Kargar, S., Meyer, B., 2006. Late Cenozoic and modern stress 601
fields in the western Fars (Iran): implications for the tectonic and kinematic evolution of 602
central Zagros. Tectonics 25, TC1003. doi:10.1029/2005TC001831. 603
Lacombe, O., Bellahsen, N. and Mouthereau, F., 2011. Fracture patterns in the Zagros Simply 604
Folded Belt (Fars, Iran): constraints on early collisional tectonic history and role of 605
basement faults. Geological Magazine 148, 940-963. 606
Langbein, W. B. et al., 1947. Topographic characteristics of drainage basins. United States 607
Geological Survey,W.-S. Paper 968-C, 125-157. 608
Larue, J.P., 2008. Effects of tectonics and lithology on long profiles of 16 rivers of the 609
southern Central Massif border between the Aude and the Orb (France). Geomorphology 610
93, 343–367. doi:10.1016/j.geomorph.2007.03.003. 611
Lavé, J., Avouac, J., 2000. Active folding of fluvial terraces across the Siwaliks Hills, 612
Himalayas of central Nepal. Journal of Geophysical Research 105, 5735-5770. 613
Masson, F., Chery, J., Hatzfeld, D., Martinod, J., Vernant, P., Tavakoli, F., Ghafory-Ashtiani, 614
M., 2005. Seismic versus aseismic deformation in Iran inferred from earthquakes and 615
geodetic data. Geophysical Journal International 160, 217-226. 616
McQuarrie, N., 2004. Crustal scale geometry of the Zagros fold-thrust belt, Iran. Journal of 617
32 Structural Geology 26, 519–535.
618
McQuarrie, N., van Hinsbergen, D. 2013. Retrodeforming the Arabia-Eurasia collision zone: 619
Age of collision versus magnitude of continental subduction. Geology 41, 315–318. 620
doi:10.1130/G33591.1. 621
Miller, S.R., Baldwin, S.L., Fitzgerald, P.G., 2012. Transient fluvial incision and active 622
surface uplift in the Woodlark Rift of eastern Papua New Guinea. Lithosphere 4, 131– 623
149. doi:10.1130/L135.1. 624
Molin, P., Pazzaglia, F.J., Dramis, F., 2004. Geomorphic expression of active tectonics in a 625
rapidly-deforming forearc, Sila massif, Calabria, southern Italy. American Journal of 626
Science 304, 559-589. 627
Montgomery, D.R., Foufoula-Georgiou, E., 1994. Channel network source representation 628
using digital elevation models. Water Resources Research. 29, 3925–3934. 629
Moosdorf, N., Cohen, S., von Hagke, C., 2018. A global erodibility index to represent 630
sediment production potential of different rock types. Applied Geography 101, 36-44. 631
Morell, K.D., Kirby, E., Fisher, D.M., Van Soest, M., 2012. Geomorphic and exhumational 632
response of the Central American Volcanic Arc to Cocos Ridge subduction. Journal of 633
Geophysical Research: Solid Earth 117. doi:10.1029/2011JB008969. 634
Mouthereau, F., Lacombe, O., Meyer, B., 2006. The Zagros folded belt (Fars, Iran): 635
constraints from topography and critical wedge modelling. Geophysical Journal 636
International 165, 336-356. 637
Mouthereau, F., Tensi, J., Bellahsen, N., Lacombe, O., De Boisgrollier, T., Kargar, S., 2007. 638
Tertiary sequence of deformation in a thin-skinned/thick-skinned collision belt: The 639
Zagros folded belt (Fars, Iran). Tectonics 26, Tc5006, doi: 10.1029/2007tc002098. 640
Mouthereau, F., Lacombe, O., Vergés, J., 2012. Building the Zagros collisional orogen: 641
timing, strain distribution and the dynamics of Arabia/Eurasia plate convergence. 642
Tectonophysics 532, 27–60. 643
Nissen, E., Tatar, M., Jackson, J.A., Allen, M.B., 2011. New views on earthquake faulting in 644
the Zagros fold-and-thrust belt of Iran. Geophysical Journal International 186, 928–944. 645
Obaid, A., Allen, M.B., 2017. Landscape maturity, fold growth sequence and structural style 646
in the Kirkuk Embayment of the Zagros, northern Iraq. Tectonophysics 717, 27–40. 647
Olivetti, V., Cyr, A.J., Molin, P., Faccenna, C., Granger, D.E., 2012. Uplift history of the Sila 648
Massif, southern Italy, deciphered from cosmogenic 10Be erosion rates and river 649
longitudinal profile analysis. Tectonics 31, 1–19, doi:10.1029/2011TC003037. 650
Perotti, C., Chiariatti, L., Bresciani, I., Cattaneo, L., Toscani, G., 2016. Evolution and timing 651
33
of salt diapirism in the Iranian sector of the Persian Gulf. Tectonophysics 679, 180–198. 652
Phillips, J.D., Lutz, J.D., 2008. Profile convexities in bedrock and alluvial streams. 653
Geomorphology 102, 554–566, doi:10.1016/j.geomorph.2008.05.042. 654
Pike, R. J., Wilson, S. E., 1971. Elevation-relief ratio, hypsometric integral, and 655
geomorphicarea-altitude analysis. Bulletin of the Geological Society of America 82, 656
1079–1084. 657
Ramsey, L. A., Walker, T., Jackson, J., 2008. Fold evolution and drainage development in the 658
Zagros mountains of Fars province, SE Iran. Basin Research 20, 23–48. 659
Ruh, J.B., Hirt, A.M., Burg, J.P., Mohammadi, A., 2014. Forward propagation of the Zagros 660
Simply Folded Belt constrained from magnetostratigraphy of growth strata. Tectonics 661
33, 1534-1551. 662
Schildgen, T.F., Cosentino, D., Bookhagen, B., Niedermann, S., Yildirim, C., Echtler, H., 663
Wittmann, H., Strecker, M.R., 2012. Multi-phased uplift of the southern margin of the 664
Central Anatolian plateau, Turkey: A record of tectonic and upper mantle processes. 665
Earth and Planetary Science Letters 317–318, 85–95. doi:10.1016/j.epsl.2011.12.003. 666
Schumm, S.A., 1956. Evolution of drainage systems and slopes in badlands at Perth Amboy, 667
New Jersey. Bulletin of the Geological Society of America 67, 597–646. 668
Schwanghart, W. and Scherler, D., 2014. TopoToolbox 2–MATLAB-based software for 669
topographic analysis and modeling in Earth surface sciences. Earth Surface Dynamics 2, 670
1-7. 671
Scotti, V.N., Molin, P., Faccenna, C., Soligo, M. and Casas-Sainz, A., 2014. The influence of 672
surface and tectonic processes on landscape evolution of the Iberian Chain (Spain): 673
Quantitative geomorphological analysis and geochronology. Geomorphology 206, 37-57. 674
Seeber, L., Gornitz, V., 1983. River profiles along the Himalayan arc as indicators of active 675
tectonics. Tectonophysics 92, 335341–337367. 676
Shahzad, F., Gloaguen, R., 2011. TecDEM: A MATLAB based toolbox for tectonic 677
geomorphology, part 1: drainage network preprocessing and stream profile analysis. 678
Computers and Geosciences 37, 250–260. 679
Sissakian, V.K., 2000. Geological Map of Iraq, Geological Survey and Mining, Baghdad, 680
Iraq, Scale 1:1,000,000. 681
Stern, R. J., Johnson, P., 2010. Continental lithosphere of the Arabian Plate: A geologic, 682
petrologic, and geophysical synthesis. Earth-Science Reviews 101, 29–67. 683
Strahler, A., 1952. Hypsometric (area-altitude) analysis of erosional topology. Bulletin of the 684
Geological Society of America 63, 1117–1142. 685
34
Snyder, N.P., Whipple, K.X., Tucker, G.E., Merritts, D.J., 2000. Stream profiles in the 686
Mendocino triple junction region, northern California. Bulletin of the Geological Society 687
of America 112, 1250–1263. doi:10.1130/0016-7606(2000)112<1250:lrttfd>2.3.co;2. 688
Talbot, C.J., Alavi, M., 1996. The past of a future syntaxis across the Zagros, in Alsop. In: 689
Alsop, G.I., Blundell, D.J., Davison, I. (Eds.), Salt Tectonics. Geological Society, 690
London, Special Publications, 100, pp. 89–109. doi:10.1144/GSL.SP.1996.100.01.08. 1. 691
Talebian, M., Jackson, J., 2004. A reappraisal of earthquake focal mechanisms and active 692
shortening in the Zagros mountains of Iran. Geophysical Journal International 156, 506– 693
526. 694
Tucker, G.E., Whipple, K.X., 2002. Topographic outcomes predicted by stream erosion 695
models: sensitivity analysis and inter-model comparison. Journal of Geophysical 696
Research: Solid Earth 107, doi: 10.1029/2001JB000162. 697
Vergés, J., Saura, E., Casciello, E., Fernandez, M., Villasenor, A., Jimenez-Mount, I., Garcia-698
Castellanos, D., 2011. Crustal-scale cross-sections across the NW Zagros belt: 699
implications for the Arabian margin reconstruction. Geological Magazine 148, 739–761. 700
Vernant, P., Nilforoushan, F., Hatzfel, D., Abbassi, M. R., Vigny, C., Masson, F., Nankali, 701
H., Matinod, J., Ashtiani, A., Bayer, R., Tavakoli, F., Chery, J., 2004. Present-day crustal 702
deformation and plate kinematics in the Middle East constrained by GPS measurements 703
in Iran and northern Oman. Geophysical Journal International 157, 381–398. 704
Walcott, R., Summerfield, M, 2008. Scale dependence of hypsometric integrals: An analysis 705
of southeast African basins. Geomorphology 96, 174–186. 706
Walker, R. T., Ramsey, L. A., Jackson, J., 2011. Geomorphic evidence for ancestral drainage 707
patterns in the Zagros Simple Folded Zone and growth of the Iranian plateau. Geological 708
Magazine 148, 901-910. 709
Whipple, K.X., Tucker, G.E., 1999. Dynamics of the stream-power river incision model: 710
Implications for height limits of mountain ranges, landscape response timescales, and 711
research needs. Journal of Geophysical Research 104, 17,661–17,674. 712
Whipple, K.X., Tucker, G.E., 2002. Implications of sediment-flux dependent river incision 713
models for landscape evolution. Journal of Geophysical Research 107 (B2), doi: 714
10.1029/2000JB000044. 715
Whipple, K.X., 2004. Bedrock Rivers and the Geomorphology of Active Orogens. Annual 716
Revew of Earth Planetary Science 32, 151–185. 717
Whittaker, A.C., Cowie, P. A., Attal, M., Tucker, G. E., Roberts, G. P., 2007. Contrasting 718
transient and steady-state rivers crossing active normal faults: new field observations 719
35
from the Central Apennines, Italy. Basin Research 19, 529–556. 720
Whittaker. A.C., Attal, M, Cowie, P. A., Tucker, G. E., Roberts, G., 2008. Decoding temporal 721
and spatial patterns of fault uplift using transient river long profiles. Geomorphology 722
100, 506–526. 723
Whittaker, A.C., Boulton, S.J., 2012. Tectonic and climatic controls on knickpoint retreat 724
rates and landscape response times. Journal of Geophysical Research: Earth Surface 725
117, F02024. 726
Wobus, C.W., Hodges, K. V., Whipple, K.X., 2003. Has focused denudation sustained active 727
thrusting at the Himalayan topographic front? Geology 31, 861–864. 728
Wobus, C., Whipple, K.X., Kirby, E., Snyder, N., Johnson, J., Spyropolou, K., Crosby, B., 729
Sheehan, D., 2006 . Tectonics from topography: procedurses, promise, and pitfalls. 730
Special papers-Geological Society of America 398, 55–74. doi:10.1130/2006.2398(04). 731
Wohl, E. E., Merritt, D. M., 2001. Bedrock channel morphology. Geological Society of 732
America Bulletin 113, 1205–1212. 733
Zebari, M.M. and Burberry, C.M., 2015. 4-D evolution of anticlines and implications for 734
hydrocarbon exploration within the Zagros Fold-Thrust Belt, Kurdistan Region, Iraq. 735
GeoArabia 20, 161-188. 736
Zielke, O., Arrowsmith, J.R., Ludwig, L.G., Akçiz, S.O., 2010. Slip in the 1857 and earlier 737
large earthquakes along the Carrizo Plain, San Andreas Fault. Science 327, 1119-1122. 738