Driving simulator validation for speed research
Stuart T. Godley *, Thomas J. Triggs, Brian N. Fildes
Monash Uni6ersity Accident Research Centre,Australia
Received 6 January 2001; received in revised form 16 March 2001; accepted 2 April 2001
Abstract
The behavioral validation of an advanced driving simulator for its use in evaluating speeding countermeasures was performed for mean speed. Using mature drivers, 24 participants drove an instrumented car and 20 participants drove the simulator in two separate experiments. Participants drove on roads which contained transverse rumble strips at three sites, as well as three equivalent control sites. The three pairs of sites involved deceleration, and were the approaches to stop sign intersections, right curves, and left curves. Numerical correspondence (absolute validity), relative correspondence (or validity), and interactive (or dynamic) relative validity were analyzed, the latter using correlations developed from canonical correlation. Participants reacted to the rumble strips, in relation to their deceleration pattern on the control road, in very similar ways in both the instrumented car and simulator experiments, establishing the relative validities. However, participants generally drove faster in the instrumented car than the simulator, resulting in absolute validity not being established. © 2002 Elsevier Science Ltd. All rights reserved. Keywords:Driving simulator; Simulation; Validation; Speed
1. Introduction
The use of a modern advanced driving simulator for human factors research has many advantages over sim-ilar real world or on-road driving research. These ad-vantages include experimental control, efficiency, expense, safety, and ease of data collection (see Nilsson, 1993). As such, simulators are becoming increasingly attractive for this purpose. However, there are some possible disadvantages, including simulator sickness, accurate replication of physical sensations, and most importantly, validity.
Simulators must have appropriate validity to be use-ful human factors research tools. Blaauw (1982) has proposed two levels of validity. The first is the physical correspondence of the simulator’s components, layout, and dynamics with its real world counterpart. Blaauw labeled this physical 6alidity, but it is often referred to as a simulator’s fidelity. The second level concerns correspondence between the simulator and the real
world in the way the human operator behaves, which he called beha6ioral 6alidity, although it is commonly referred to as predictive validity. It is often presumed that fidelity incorporates behavioral validity. Thus, sim-ulator studies often report the physical correspondence, and usually do not mention, let alone analyze, the behavioral correspondence. In reality, however, the two levels are not always related (Blaauw, 1982).
1.1. Physical6alidity
Researchers often account for physical validity through a description of their driving simulator, citing its many aspects that reproduce real life driving. The closer a simulator is to real driving in the way the vehicle is driven, in the way stimuli are presented, and in the way it physically reacts to that stimuli, the greater the fidelity it is considered to have (Triggs, 1996). Therefore, a moving-base driving simulator is often assumed to have greater physical validity than a fixed-base simulator. Another reported measure of fidelity is lack of simulator sickness (e.g. McLane and Wierwille, 1975; Harms, 1996), although, whether this measure is meaningful is arguable.
* Corresponding author. Present address: Department of Psychol-ogy, Mungo MacCallum Building A17, University of Sydney, Syd-ney, NSW 2006, Australia. Tel.: +61-2-9351-5697; fax:
+61-2-9660-7232
E-mail address:[email protected](S.T. Godley).
0001-4575/02/$ - see front matter © 2002 Elsevier Science Ltd. All rights reserved. PII: S 0 0 0 1 - 4 5 7 5 ( 0 1 ) 0 0 0 5 6 - 2
Although fidelity of a driving simulator is attractive, often too much importance is placed on it. In the search for simulators with ever greater fidelity, it should be remembered that, ultimately, no level of physical validity is useful to human factors research if behav-ioral validity cannot be established. Accordingly, a more sophisticated (and therefore greater physically valid) simulator may not have more behavioral validity than a less sophisticated and expensive one. As such, it will not be more useful for behavioral research (Triggs, 1996).
1.2. Beha6ioral Validity
If new research apparatus is used for conducting experiments whose findings will influence decisions made for real life situations, then it is important to know that the apparatus is eliciting similar responses as the normal real life situation. For driving simulator research, it needs to be shown that the particular simu-lator appropriately reproduces driving responses as they occur on the road.
As most advanced driving simulators are developed independently of each other, validity information is required for individual simulators. This is because dif-ferent simulators have distinct parameters, including the time delay between driver action and simulator response, the amount of physical movement available, and the size and quality of the visual display (Nilsson, 1993). In addition, different tasks using a simulator obviously can have different levels of validity. More-over, validation of an individual simulator using a single type of task is not adequate at all to argue the validity of a simulator and different simulator task.
That said, however, the accumulated evidence from different driving simulators and a range of driving tasks does add weight to the validity of simulator research.
However, the number of published driving simulator validation studies is quite limited to date (Blaauw, 1982; Harms, 1996; Riemersma et al., 1990; To¨rnros, 1998; Carsten et al., 1997).
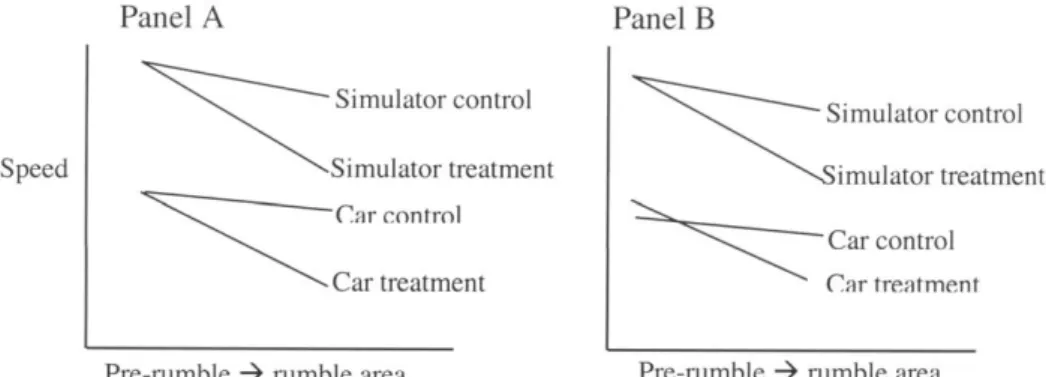
Blaauw (1982) argued that the most comprehensive method of undertaking behavioral validation research for simulators is a comparison between driving in the simulator and a real car, using tasks that are as similar as possible in the two environments. If the numerical values between the two systems are the same, then
absolute 6alidity can be claimed. A more pragmatic modification of this technique is to compare perfor-mance differences between experimental conditions in the simulator and a real car. Here, relati6e 6alidity is established when the differences found between experi-mental conditions are in the same direction, and have a similar or identical magnitude on both systems. The difference between these two types of validities is illus-trated in Fig. 1. In Panel A, it can be seen that the dependent variable being assessed is of the same magni-tude for the simulator and car for the control condi-tion, so absolute validity would be achieved. For the treatment condition, and for both conditions in Panel B, there are differences between the simulator and car, so absolute validity fails. Despite this, in Panel B, relative validity is attained because the relationship between the treatment and control conditions are the same for the simulator and car. In contrast, in Panel A these relationships are different so relative validity fails. To¨rnros (1998) observed that for a simulator to be a useful research tool, relative validity is necessary, but absolute validity is not essential. This is because re-search questions usually deal with matters relating to the effects of independent variables, with experiments investigating the difference between a control and treat-ment(s), rather than aiming to determine numerical measurements.
The current experiments involved the behavioral vali-dation of the Monash University Accident Research Centre (MUARC) driving simulator. Based on Blaauw’s (1982) two tiered approach, a three tiered approach was developed. This included an evaluation of absolute validity, relative validity (hereafter referred to as average relative validity), and interactive relative validity, which examined the similarity of drivers’ dy-namic reactions to stimuli between experimental condi-tions. The study examined drivers’ speed responses to transverse rumble strips. These were chosen as experi-mental stimuli because the simulator was to be used for a research project examining similar speeding counter-measures (reported in Godley et al., 1999). Rumble strips are lines placed across a driving lane on the approach to a hazard in an attempt to slow driving speeds more than usual before the hazard is reached. Driving speeds in response to rumble strips in an instrumented car were compared to driving speeds on the MUARC driving simulator. The instrumented car recorded driving performance through specified routes that included rumble strips at three sites, and three separate but equivalent control sites. These pairs of sites were a stop sign approach, a right curve approach, and a left curve approach. This study is referred to as the instrumented car experiment. The simulator re-sponses were recorded, in a separate experiment (simu-lator experiment), by replicating the rumble strip sites and control sites used in the instrumented car experi-ment on the simulator.
2. Method: instrumented car experiment
2.1. Participants
There were 24 participants, 12 males and 12 females, ranging in age from 22 to 52 years, with an average age of 29.8 years. All participants were post-graduate stu-dents or staff from Monash University and were re-cruited through personal contact. Every participant had a full Victorian driving license with a minimum of 3 years driving experience. None had previous experience driving an instrumented car. They were paid $10 for their participation, which involved 3 h from the time they left the university until their return.
2.2. Apparatus
2.2.1. Instrumented car
The experimental car was an instrumented Holden Apollo (engine size 2 l). It had front wheel drive and automatic transmission. Driving speed was measured through the speedometer of the car.
2.2.2. Treatment and control sites
The three pairs of sites chosen were located in subur-ban Melbourne. The sites were the approaches to a stop sign, a right curve, and a left curve. The curves had an angle of curvature of 150°. All sites were on two-lane suburban roads with a 60 kph speed limit. Each pair of sites consisted of a treatment site with rumble strips, and an equivalent control site. The corresponding treat-ment and control sites were matched as far as possible for on-road and off-road details. However, one limita-tion was that the treatment sites had wider lane widths than their control sites.
2.2.3. Rumble strips
The rumble strips used were red, 60 cm in width, almost the width of the driving lane, approximately 1 cm high, and had anti-skid surfaces. They had an observable rumble effect when cars traveled over them, producing tactile and auditory feedback to drivers. These treatments preceded an intersection or curve by 30 – 50 m, but also continued through the curves. The strips were spaced at decreasing distances apart during the approach areas to the intersection or curve.
2.2.4. Routes
Two experimental routes on public suburban roads were used to control for order of presentation between the treatment and control sites. Half of the male and female participants completed each route. These roads therefore had other vehicles traveling on them, and sometimes had vehicles parked on the side of the road.
2.3. Procedure
Participants completed an informed consent form, as approved by the Monash University Ethics Committee, and read the experimental instructions. The instructions informed them to drive as they normally would in these conditions. The experimenter sat in the front passenger seat of the car, and told the participant which direc-tions to drive. A technician sat in the back seat of the car, directly behind the participant.
A practice drive was given to the participants to familiarize them with the car. This drive lasted approx-imately 11 min, and included driving over an additional set of rumble strips on a left curve approach so that the rumble strips were not a novel experience at the first measurement treatment site they encountered. The practice drive merged into one of the two test drives. The experimental drive lasted between 40 and 50 min, depending on the driver and the traffic circumstances.
2.4. Excluded participants
Some participants were excluded from the data pool for the analysis of an individual treatment-control site
pair due to extraneous circumstances at a particular site (although no participant was removed from all analy-ses). These decisions were made without any reference to their decoded data. Exclusions occurred for one or more of the following reasons: there was a slow moving vehicle in front of the participant’s car, denying the participant an unrestricted drive to the intersection or curve; there were school children walking on the road causing the driver to slow down, or; the participant slowed dramatically due to an on-coming car approach-ing at the same time as they passed a parked car. In total, there were five participants deleted for the stop sign intersections, one for the right curves, and four deleted for the left curves.
3. Method: simulator experiment
3.1. Participants
Twenty participants, 12 males and 8 females, where involved in the simulator experiment. Their average age was 26.4 years, ranging from 22 to 40 years. All pos-sessed a full Victorian driver’s license. Participants were staff and post-graduate students at Monash University, and were recruited through electronic mail and internet news group postings. None of the participants had previous experience driving the simulator. They were not paid for their involvement, which lasted 1 h.
No participants tested in the instrumented car exper-iment were also involved in the simulator experexper-iment. However, it is common for validation studies to use the same participants in both experiments (e.g. Harms, 1996; To¨rnros, 1998), although it is not always possible (e.g. Riemersma et al., 1990). Using the same partici-pants in both environments was not chosen here be-cause exposure to rumble strips in one environment may have influenced the participants’ reactions to them in the subsequent experiment. Furthermore, the instru-mented car experiment had to be completed before the simulator experiment could start, so if the same partici-pants were used, the order each experiment was com-pleted would not have been counterbalanced between participants. Potential systematic bias and order effects were regarded as less desirable than generating addi-tional between-participants variation by using a sepa-rate group of participants. In contrast, To¨rnros (1998) used the same participants when order of presentation could not be counterbalanced between the two environ-ments, possibly leading to faster driving in the simula-tor due to boredom.
3.2. Apparatus
3.2.1. Dri6ing simulator
The MUARC Research Driving Simulator consisted
of a cabin of a Ford Falcon (engine size 4 l) with normal controls and automatic transmission. The pre-sentation of the visual stimuli was through computer generated graphics at a resolution of 640 by 480 pixels, and updated at a rate of 30 Hz. The driver had 180° of forward horizontal vision (using three screens and pro-jectors), 60° of rear horizontal vision (using a fourth screen and projector), and 45° of vertical vision. The simulator also contained a three-dimensional sound system reproducing tire and engine noises, and a verti-cal motion platform providing (angular) pitch and roll movements for accelerating, braking, cornering, and traversing raised road objects.
3.2.2. Treatment and control sites
The dimensions of the treatment sites were matched to the dimensions of the equivalent treatment site in instrumented car experiment. Control sites were exactly the same as their associated treatment site without the presence of the rumble strips.
3.2.3. Rumble strips
The rumble strips used were modeled on those em-ployed in instrumented car experiment, and were 60 cm longitudinally and 3.6 m laterally. There was a 0.5 m gap between the end of strips and both the centerline and gutter. The motion platform responded to the rumble strips by causing a 1 cm ascending bump when the car was driven onto any part of a strip, and a 1 cm descending bump when driving off a strip.
3.2.4. Routes and terrain
Four simulator routes were used, two for practice and two for the experiment. The second practice route and the experimental routes were in a suburban setting, and the second practice scenario included a rumble strip treatment. Two experimental routes were used so that the order in which the treatment and control sites appeared for each pair of sites could be counterbal-anced across participants. The routes were exactly the same as each other except for the location of the rumble strip treatments and the location of some build-ings. The left curve treatment site occurred in one route, and the stop sign and right curve treatment sites occurred in the other route.
3.3. Procedure
Participants completed the same consent form as in instrumented car experiment and read the experimental instructions. The instructions informed participants to drive as they normally would if the current environ-ment was the real road. The instructions were very similar to those for the instrumented car experiment,
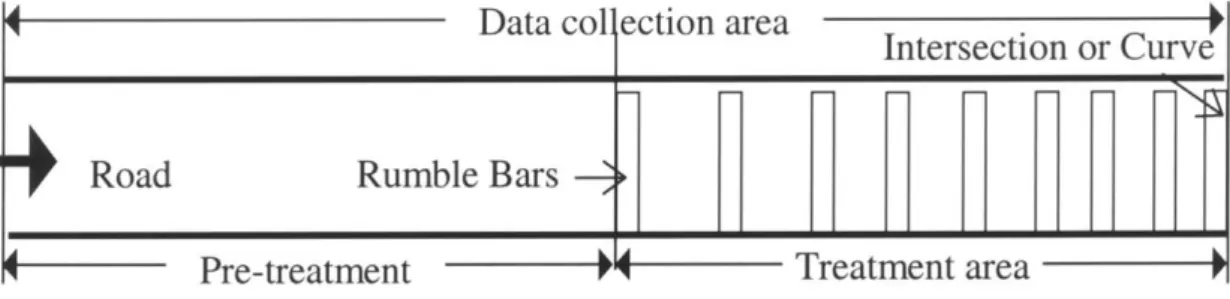
Fig. 2. Data collection area for the instrumented car and simulator experiments.
except for minor details specific to each experiment. Participants were then presented with the two practice and two experimental scenarios to drive. The experi-menter sat in the simulator car passenger seat during the whole experiment, as was the case in the instru-mented car experiment. After each drive throughout the experiment, both the participant and the experimenter vacated the car. This process was undertaken to mini-mize the possibility of the participant experiencing sim-ulator discomfort, and lasted for approximately 1 min. The order the two experimental routes were driven was counterbalanced between participants. Each drive lasted approximately 4 min.
4. Data organization and analysis
4.1. Data organization
The data for the two experiments were collected at a rate of 30 Hz, but were converted to an average speed for each meter of the track. Measurements for the data analysis were recorded during the rumble strip area up to the intersection or the commencement of the curve, as well as approximately the same distance of road immediately before the rumble strips started. A sche-matic illustration is displayed in Fig. 2.
4.2. Validation approach and data analysis
The analyses of the experiments examined simulator validation for both relative and absolute validity. This process was conducted separately for each of the three pairs of sites (stop sign, right curve, and left curve approaches).
4.3. Relati6e6alidation
Two procedures were implemented to assess relative validity. The first procedure was calleda6eraged relati6e
6alidity. For each treatment and control site, every participant’s mean speeds were averaged across the entire measurement area. The disparity between a
treat-ment and control mean speed represented the impact of the rumble strips. Average relative validity was deemed to be fulfilled when these disparities were similar in magnitude and in the same direction in both experi-ments. To analyze this issue statistically, a two-factor analysis of variance (ANOVA) was conducted, with the two sites (treatment and control) as a repeated mea-sures factor, and the two experiments as a between-par-ticipants factor. Averaged relative validation was evaluated by examining the two-way interaction be-tween the site main effect and the experiment main effect. Only the site factor main effects and interactions are reported below.
The second procedure for evaluating relative validity was calledinteracti6e relati6e6alidity. For each pair of sites, the speed profile across the entire data collection area (from the 1 m averages) was established for each treatment site relative to its control site. This pattern displayed how and when drivers reacted to the rumble strips as they traveled through the measurement area. Interactive relative validity was regarded as verified when these relative patterns were similar in the instru-mented car and simulator experiments. For statistical evidence to support interactive relative validity, a corre-lation approach was used.
Unlike the average relative validity analysis, this analysis did not attempt to demonstrate whether the pattern of relative numerical values between the treat-ment and control sites were the same across experi-ments. This disregard of absolute differences is warranted because discrepancies between experiments may simply reflect the inevitable non-perfect matching between the sites used in the on-road experiment. (For example, speed may have been initially faster at a treatment site compared to a control site because the treatment site had a wider lane width). Instead, the approach used determined whether measurements at the treatment site were decreasing and/or increasing compared to the control site as participants traveled through the data measurement area. As an illustration, in Fig. 3, the hypothetical graphs presented in Panel A and B both represent statistically significant interactive relative validity correlations. This is because the relative
patterns were very similar in both experiments through-out the majority of the measurement areas. However, in Panel B, differences between the scores of the treatment site and the control site are the opposite direction for the car and simulator experiments in the first half of the measurement area. The reason why such results would yield a significant interactive relative validity correla-tion is because the scores obtained at the treatment site are decreasing relati6e to those from its control site as participants progress from the beginning to the end of the measurement area in both experiments.
A modified correlation analysis, based on canonical correlation was used for the analysis. As separate par-ticipants were used in each experiment, the standard approach of correlating each participant’s data across the two experimental conditions was not applicable. Therefore, the following modified approach was used. For each meter, the mean speeds were averaged across participants. These averages were then contrasted be-tween the treatment and control sites in each experi-ment separately. In other words, the average for each meter (rather than each participant) was designated as the unit of measure. The modified canonical analysis then determined whether or not the pattern of a mea-surement from the treatment site relative to the control site in the instrumented car correlated with the relative pattern from the treatment site in the simulator.
In a canonical correlation, weights or coefficients are assigned to each variable. As the means for the treat-ment and control sites needed to be contrasted against each other, they needed specific weighted coefficients of negative one for the treatment means, and positive one for the control means (although the sign of these coeffi-cients could have been reversed). This correlation ap-proach assumes that the data from each 1 m segment is independent of the data from each other 1 m segment. This assumption does not hold for each participant individually, as the driving behavior during each meter is dependent on the previous meter. However, as means across all participants were used (rather than using
individual participants in the analysis), the effect of this violated assumption was minimized.
4.4. Absolute 6alidity
For absolute validation, the data were averaged across the total measurement area for both the treat-ment and control sites. From these, the averages for the treatment sites in the two experiments were compared, and separately, the averages for the control sites in the two experiments were compared. For the statistical analysis of these, two one-way ANOVAs were calcu-lated, one for the treatment sites, and one for the control sites. These ANOVAs compared the mean speed between the two experiments averaged across the total measurement area.
4.5. Size of effect
The ANOVA analyses for the averaged relative valid-ity and the absolute validvalid-ity included estimating the effect size using the omega squared ( 2) statistic. This
statistic was used because non-significant results vali-date the simulator, but non-significant results may arise from inadequate statistical power rather than a genuine absence of difference. If a large v2 coincides with a
non-significant result, it suggests that perhaps a differ-ence exists, but that it could not reach statistical signifi-cance due to an insufficient sample size and thus inadequate statistical power. If 2 is small,
non-signifi-cant results can be more confidently proclaimed to reflect genuine non-differences.
At or below 2=0.01 (small effect), it can be
pre-sumed that even if there was a difference between the groups, it would be too small to be meaningful (Cohen, 1988). Therefore, when a non-significant ANOVA records an 2B0.01, it can be claimed that the
non-significant result arose from a genuine absence of differ-ence, rather than insufficient power.
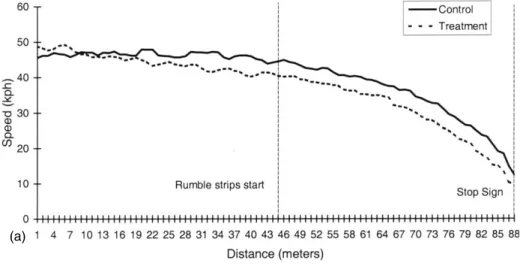
Fig. 4. (a) Mean speed at the stop sign approach for instrumented car experiment. (b) Mean speed at the stop sign approach for simulator experiment.
5. Results
It should be noted that the data from the instru-mented car, displayed in Fig. 4a, Fig. 5a, and Fig. 6a, fluctuate to an extent between subsequent averages per meter. This was a result of less than perfect data recording in the instrumented car. In comparison, the simulator data, displayed in Fig. 4b, Fig. 5b, and Fig. 6b, was recorded very accurately and thus resulted in the smooth curves present in these figures.
5.1. Stop sign approach
It can be seen in Fig. 4a and b that, averaged over the total data collection area and across both experi-ments, speed at the treatment site stop sign approach was significantly slower than at the control site,
F(1,37)=22.98, PB0.001. Treatment site speeds were slower in both experiments, by an average of 3.25 kph for the on-road trials, and by 3.64 kph in the simulator
trials. As the average difference between the sites was very similar in the two experiments, there was no significant interaction between the two driving environ-ments. There was also a very small effect size to corrob-orate this non-significant result F(1,37)=0.07,
P=0.79, 2=0.002. Thus, averaged relative validity
was established for the stop sign approach speed. The pattern of speeds for the treatment site relative to the control site was similar in both experiments throughout most of the stop sign approach. This con-cordance is supported to an extent by a significant correlationr(2,−0.5,40.5)=0.40. Thus, there was sup-port for interactive relative validity. The patterns of the speed differences in the two experiments were the same during the second half of the pre-treatment area and the first half of the treatment area. However, the simu-lator treatment site speed started to reduce, relative to speed at the control site, before it did in the instru-mented car. Also, the speeds for the two sites converged as they approached the intersection in the simulator, as
shown in Fig. 4b. However, as Fig. 4a suggests, this pattern was not observed in the data for the on-road experiment.
For absolute validity, speeds at both the treatment and control stop sign approaches were higher in the simulator than the instrumented car. The simulator treatment site speed was 4.12 kph faster F(1,37)=
11.09, PB0.01), and the simulator control site speed
was 3.73 kph fasterF(1,37)=6.05,PB0.05. Therefore, absolute validity was not established for the stop sign approach speeds.
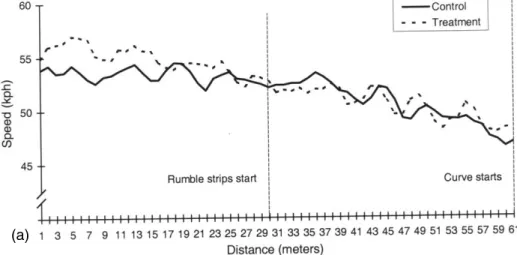
5.2. Right cur6e approach
For the right curve approaches, there was no differ-ence between the mean speed at the treatment and control sites averaged across both experiments
F(1,41)=3.66, P=0.063. This finding can be clearly seen in Fig. 5a for the on-road experiment. However, as
can be seen in Fig. 5b, the simulator treatment site was slower than its control site by 4.33 kph. This difference between the two experiments generated a significant interaction F(1,41)=7.24, PB0.01. Therefore,
aver-aged relative validity was not established at this site. In both experiments, speeds at the treatment site reduced relative to speeds at their control site as the participants approached the start of the right curve. This pattern can be seen in both Fig. 5a and b. How-ever, this pattern ended during the second half of the treatment area in the instrumented car, but continued until the curve started in the simulator experiment. Nevertheless, as the speed pattern was similar in the first three quarters of the measurement area, a signifi-cant correlation was found r(2,−0.5,27)=0.52. Thus, these results provide support for interactive relative validity.
The right curve treatment site speeds were not statis-tically different between the car and simulator
experi-Fig. 5. (a) Mean speed at the right curve approach for instrumented car experiment. (b) Mean speed at the right curve approach for simulator experiment.
Fig. 6. (a) Mean speed at the left curve approach for instrumented car experiment. (b) Mean speed at the left curve approach for simulator experiment.
ments F(1,41)=0.30,P=0.590, v2=0.007. The small
effect size from the omega squared further corroborates this non-significant result. However, the control site speed was slower by 3.84 kph in the instrumented car experiment than it was in the simulator experiment
F(1,41)=5.42,PB0.05. Therefore, the criteria for ab-solute validity were fulfilled for the treatment sites, but not the control sites.
5.3. Left cur6e approach
The main effect across experiments for the left curve approach speed showed that driving was slower at the treatment sites than at the control sitesF(1,38)=32.54,
PB0.001. As can be seen in Fig. 6a and b, respectively, this disparity occurred only marginally (by 1.27 kph) in the on-road experiment, but to the sizeable degree of 8.9 kph in the simulator trials. Thus, speed differences were significantly different between the two experi-ments, F(1,38)=18.36, PB0.001. Therefore, averaged relative validity was not established.
As participants approached the start of the left curve in both experiments, the treatment site speeds gradually reduced relative to the speeds at their control sites. This pattern remained the same in both experiments throughout the first three quarters of the data collection area. As such, a significant correlation was found
r(2,−0.5,41.5)=0.50. Thus, interactive relative valid-ity was achieved.
Participants drove significantly faster in the instru-mented car than in the simulator by 10.20 kph at the treatment left curve approaches F(1,38)=21.50, PB
0.001. The control site speeds, however, were not sig-nificantly different, but produced an effect size close to medium F(1,38)=1.96, P=0.169, v2=0.049. This
suggests that if the two experiments had larger sample sizes, a significant result may have been found showing that the on-road speed was faster than the simulator speed. Therefore, the non-significant result cannot be considered as conclusive. Thus, absolute validity was not established at the left curve approach.
6. Discussion
The aim of the above two experiments was to vali-date the MUARC driving simulator for research on speeding countermeasures. This validation consisted of three levels, averaged relative validation, interactive relative validation, and absolute validation, for the dependent variable speed. It was considered, a priori, that relative validation was more important than abso-lute validation to justify using the simulator for future experiments. A summary of the validation findings are presented in Table 1.
6.1. Relati6e6alidation
Treatment site speeds started to reduce, relative to their control sites, before the rumble strips in both experiments at all sites. As such, all three sites yielded significant correlations in relation to interactive relative validity. Furthermore, interactive relative validation is the most important measure of validity for mean speed because it demonstrates that drivers will act in the same way in the simulator across the various stages involved in reacting to the rumble strips, as they do in a real car. In addition, the rumble strips led to a average slower approach speed to the stop sign intersection in both the simulator and on-road trials.
Therefore, relative validity was well established for mean speed. However, the simulator produced larger average speed differences between its treatment and control sites during the curve approaches than the on-road trials. This occurred for two reasons. The first was because the speeds at the treatment sites in instru-mented car experiment were initially faster than they were at the control sites. The second reason was that treatment site speeds started to reduce, compared to the control site speeds, further back before the first of the rumble strips in the simulator experiment than it did in the on-road study.
In the on-road trials, the treatment site speeds were initially faster than they were at the control sites for the curve approaches. This finding may have been due to non-perfect site matching. That is, the treatment roads
chosen may have been conducive to faster speeds than the control roads chosen, probably due to two reasons. Firstly, the on-road curve treatment sites had wider lane widths than their control sites, and wider lane widths are conducive to faster driving (e.g. Leong, 1968; Vey and Ferrari, 1968; Yagar and van Aerde, 1983; Fildes et al., 1987; Organization for Economic Cooperation and Development, 1990; Tenkink and van der Horst, 1991). Furthermore, Tenkink and van der Horst (1991) have shown that curve entry speeds in-crease with wider lane widths. Secondly, the treatment sites used in the instrumented car experiment were initially chosen for rumble strip installation by the local council because they previously had high rates of single vehicle speed related accidents. Thus, the treatment site roads for the curve approaches possibly had geographi-cal characteristics that encouraged faster speeds than the control sites.
Thus, as the on-road treatment sites initially had faster speeds than the control sites, when speeds started to slow at the treatment sites (relative to the control sites), it was some distance before the treatment site speeds became slower than the control site speeds. If the initial speeds for the on-road curve sites were more similar, it might be argued that more similar treatment-control site speed differences to the simulator experi-ment may have been found. Similar speed differences did occur at the stop sign approach.
However, as mentioned above, the averaged relative validity differences at the curve sites were also exacer-bated by the speed reductions at the treatment sites starting earlier on the simulator. Similarly, speed reduc-tions started further back before the first of the rumble strips on the simulator at the stop sign approach. As this trend was found at all three sites, it was the main difference between the simulator and the on-road ex-periments concerning the relative validity results.
One speculation about these findings is that they may have occurred because of characteristics of the simula-tor, as well as the experimental procedure used in the simulator. Due to the absence of G-force motion cues in the simulator, participants may have been less aware of speed changes or felt that they had less control of the
Table 1
Establishment of validation for mean speed
Interactive relative validity
Averaged relative validity Absolute validity
(Treatment) (Control)
Yes Yes
Stop sign No No
No
Right curve Yes Yes No
No Yes
vehicle when decelerating compared to the participants in the instrumented car study. This may been a result of the intentionally short practice sessions given to partici-pants which were designed to minimize simulator sick-ness. If so, this may have contributed to them begin-ning to slow earlier on the simulator when they per-ceived the rumble strips.
Therefore, due to the above issues, participants may not have started to decelerate in reaction to the rumble strips as early as they did in the present simulator experiment if they were more comfortable with the simulator. Moreover, this earlier deceleration and the initially faster on-road treatment site speeds account for the majority of the curve approach relative speeds differences between the two experiments. Thus, it can be speculated that without the problems identified above as causing these two experimental differences, averaged relative validation for the curves may have been established.
There was also a difference between the experiments at the stop sign approach. The converging speed pat-tern at the intersection between the treatment and control sites that was found in the simulator experiment was not recorded in the on-road data. However, as all participants came to a complete stop at the intersection at both sites in both experiments, the converging speed pattern should have been found in both experiments. The reason it did not appear in the on-road data was because it could only be determined when the vehicle stopped, rather than when the front of the simulator car crossed the stop line as in the simulator data.
In summary, the simulator may have slightly en-hanced the speed differences between the three treat-ment and control sites evaluated, through both earlier and larger decelerations at the treatment sites. How-ever, when limitations uncovered here are addressed appropriately, these differences should be able to be minimized. Therefore, the simulator does seem to be a valid tool for generating and generalizing relative speed results for experiments involving road based speeding countermeasures aiming to influence decelerating drivers.
6.2. Absolute 6alidation
Absolute speed values were generally different in the two experiments. However, this finding is not particu-larly negative because simulator experiments conducted on the Monash University driving simulator only con-cerned speed differences between road environments. The experiments did not attempt to establish the nu-merical speeds at which the investigated road manipula-tions encourage participants to drive. It is interesting that the general trend found was for the simulator to induce slower speeds than the instrumented car.
7. Conclusions
There is evidence to conclude that speed is a valid measure to use for experiments on the MUARC driving simulator involving road based speeding countermea-sures. The most important indicator of an effective countermeasure is that the speed profiles found indicate a speed reduction relative to control roads or other roads. For this purpose, speed has been clearly vali-dated as a dependent variable for research using the simulator. The validity of speed only covers research investigating the relative differences between road treat-ments and control roads. It does not include investigat-ing absolute numerical speed values. Inconsistencies between the two experiments can account for many of the differences found. Differences in characteristics of the road and road environment between treatment and control sites in the on-road experiment hindered the validation. Procedural methods with the simulator, no-tably practice, may have also contributed.
Acknowledgements
This study was supported by the Federal Office of Road Safety of Australia and the Roads and Traffic Authority of the state of New South Wales, Australia. This paper is based on part of Stuart Godley’s Doctoral Dissertation. The instrumented car was arranged and operated by ARRB Transport Research Ltd. The au-thors would like to acknowledge Simon Moss for his statistics advice.
References
Blaauw, G.J., 1982. Driving experience and task demands in simula-tor and instrumented car: a validation study. Human Facsimula-tors 24 (4), 473 – 486.
Carsten, O.M.J., Groeger, J.A., Blana, E., Jamson, A.H. 1997. Driver Performance in the EPSRC Driving Simulator [LADS]: a Valida-tion Study. Final Report, Project GR/K56162. Institute of Trans-port Studies: Leeds.
Cohen, J., 1988. Statistical Power Analysis for the Behavioural Sciences, 2nd. Erlbaum, Hillsdale, NJ.
Fildes, B.N., Fletcher, M.R., Corrigan, J.McM., 1987. Speed Percep-tion 1: Drivers’ Judgement of Safety and Speed on Urban and Rural Straight Roads, Report CR 54. Federal Office of Road Safety, Canberra.
Godley, S.T., Fildes, B.F., Triggs, T.J., Brown, L., 1999. Perceptual Countermeasures: Experimental Research, Report CR 182. Aus-tralian Transport Safety Bureau, Canberra.
Harms, L., 1996. Driving performance on a real road and in a driving simulator: Results of a validation study. In: Gale, A.G., Brown, I.D., Haslegrave, C.M., Taylor, S. (Eds.). Vision in Vehicles V. Elsevier/North-Holland, Amsterdam, pp. 19 – 26.
Leong, H.J.W., 1968. The distribution and trend of free speeds on two-lane two-way rural highways in New South Wales. Proceed-ings of the Fourth Australian Road Research Board Conference 4 (1), 791 – 803.
McLane, R.C., Wierwille, W.W., 1975. The influence of motion and audio cues on driver performance in an automobile simulator. Human Factors 17 (5), 488 – 501.
Nilsson, L., 1993. Behavioural research in an advanced driving simulator-experiences of the VTI system. Proceedings of the Hu-man Factors and Ergonomics Society 37th Annual Meeting 37 (1), 612 – 616.
Organization for Economic Cooperation and Development, 1990. Road Transport Research: Behavioural Adaptations to Changes in the Road Transport System. OECD, Paris.
Riemersma, J.B.J, van der Horst, A R.A., Hoekstra, W., Alink, G.M.M., Otten, N., 1990. The validity of a driving simulator in evaluating speed-reducing measures. Traffic Engineering and Con-trol 31, 416 – 420.
Tenkink, E., van der Horst, A.R.A. 1991. Effecten van wagbreedte en
boogkenmerken op rijsnelheid [Effects of road width and curve characteristics on driving speed]. TNO Rapport IZF 1991 C-26. Instituut voor Zintuigfysiologie TNO: Soesterberg, the Nether-lands.
To¨rnros, J., 1998. Driving behaviour in a real and a simulated roadtunnel — a validation study. Accident Analysis and Preven-tion 30 (4), 497 – 503.
Triggs, T.J., 1996. Some critical human factors issues and challenges in simulation and training. In: Sestito, S., Beckett, P., Tudor, G., Triggs, T. (Eds.), Simtect 96 Proceedings, pp. 21 – 26.
Vey, A.H., Ferrari, M.G., 1968. The effects of lane width on traffic operation. Traffic Engineering 38 (11), 22 – 27.
Yagar, S., van Aerde, M., 1983. Geometric and environmental effects on speeds of 2-lane highways. Transportation Research Part A 17A (4), 315 – 325.