Nepal
Human Development
Report 2014
Government of Nepal National Planning Commission
Beyond Geography
Government of Nepal National Planning Commission
Nepal
Human Development
Report 2014
Beyond Geography
Nepal Human Development Report 2014 Beyond Geography, Unlocking Human Potential Copyright © 2014
Published by Government of Nepal National Planning Commission Singha Durbar, Kathmandu Tel: (+977)-014211136 Fax: (+977)-014211700 Email: [email protected] Web: www.npc.gov.np
United Nations Development Programme Post Office Box 107
Pulchowk Kathmandu, Nepal Tel: 977-1-5523200 Email: [email protected] Website: http://www.np.undp.org
All rights reserved. No parts of this publication may be reproduced, stored in a retrieval system or transmitted, in any form or by any means, electronic, mechanical, photocopying, recording or otherwise, without prior permission.
ISBN: 978-9937-8874-0-3
Design and Processed: Print Communication Pvt. Ltd. Thapathali, Kathmandu, Nepal
Team of Authors
Pitamber Sharma – Team Leader Basudeb Guha-Khasnobis Dilli Raj Khanal
Researchers Prakash Shrestha Pawan Kanel Statistical Assistants Tika Gautam Anwesha Aditya Editor Gretchen Luchsinger Peer Reviewers
Kul Chandra Gautam, Pushkar Bajracharya, Posh Raj Panday, Bina Pradhan, Bhuwan Bajra Bajracharya, Madan Pariyar, Hari Pradhan, Stella Tamang, Rajendra Dev Acharya, Akhilesh Upadhyay and Tula Narayan Shah
Reviewers from HDRO, RBAP and IC4HD
Thangavel Palanivel, Bishwa Nath Tiwari, Scott Standley and Tasneem Mirza, Elena Borsatti, Meenakshi Kathel, Meenaz Munshi and Jonathan Hall
Nepal Human Development Report 2014
STEERING COMMITTEEl Janak Raj Shah,Former Hon’ble Member, National Planning
Commission – Chairperson
l Yuba Raj Bhusal*, Former Member Secretary, National
Planning Commission – Member
l Pushpa Lal Shakya,Joint Secretary, National Planning
Commission Secretariat- Member
l Baikuntha Aryal, Joint Secretary, Ministry of Finance - Member l Hari Lamsal,Joint Secretary, Ministry of Education - Member l Narayan Gopal Malego*,thenJoint Secretary, Ministry of
Physical Planning and Works - Member
l Padam Chand,Joint Secretary, Ministry of Health and
Population - Member
l Hari Poudel, Joint Secretary, Ministry of Women, Children and
Social Welfare - Member
l Suman Aryal, Deputy Director General, Central Bureau of
Statistics - Member
l Rajiv Pokhrel, Under Secretary, Ministry of Health and
Population – Member
l Bhagwat Khanal, Under Secretary, Ministry of Physical
Planning, Infrastructure and Transport - Member
l Sharmila Karki, President, NGO Federation - Member l Netra Prasad Timsina, Former President, NGO Federation
- Member
l Ashutosh Tiwari, Association of INGOs – Member l Prakash Giri, Federation of Nepalese Chamber of
Commerce and Industry (FNCCI) - Member
l Ram B. BK, National Dalit Commission - Member
l Shoko Noda, Country Director, UNDP – Member
l Rabi Shanker Sainju, Programme Director, National
Planning Commission Secretariat- Member Secretary
Team for the Preparation of
* Yuba Raj Bhusal is currently Secretary, Ministry of Finance.
I
t is my pleasure to note that the Nepal Human Development Report 2014 has come out with unique features – a differ-ent theme, useful data sets and innovations in methodologies and analysis. Indeed, the Re-port is a huge intellectual contribution to the development debate of Nepal.This Report focuses on the produc-tive abilities of the regions, households and individuals. The report also reinforces the fact that there are inequalities between and within regions, as well as social groups. It reveals that there is ethnic dimension to the geographic disparity. It also points out human develop-ment does not only depend upon access to facilities and productive abilities but also on the opportunities available.
The report rightly recommends strengthening inclusive growth and looking into innovation in development models for problems that defy general economics. Inclu-sive Growth and innovation in development models are important at this time, as Nepal tries to move out of a long drawn out political transition and its commitment to graduating from Least Developed Country to a Develop-ing Country status by 2022.
While Nepal has already met Econom-ic Vulnerability Index necessary for gradua-tion and about to meet the Human Asset Index, we are far behind in meeting the cri-teria for Gross National Income. To meet the projected GNI per capita - US$2,094 - Nepal needs to invest to the tune of 16.7 trillion ru-pees in terms of the current prices between 2013/14 and 2021/22.
Given the fast pace with which the economy needs to grow – 8% annually - for graduation from a least developed country, Nepal needs to invest in areas that are grow-ing fast like the services sector. And given the inequality, as portrayed by this Human De-velopment Report and the reports published earlier, the state has to focus on agriculture, infrastructure, education, health and the so-cial sector to decrease inequality.
For that Nepal will have to focus on lead-ing sectors like hydro-power, industries, tourism, agriculture and services and make use of eco-nomic growth centers identified in this report to spur the growth that the country needs. It further needs to increase the productivity of the popula-tion with a focus on health, educapopula-tion and gain-ful employment of the youth population.
Prof. Dr. Govind Raj Pokharel
Vice-chairperson
National Planning Commission
T
he productive abilities of citizens are the real assets of a country. With right skill sets, even countries with-out significant natural endowment succeed to attain high level of development and pros-perity. Nepal Human Development Report 2014 ‘Beyond Geography, Unlocking Hu-man Potential,’ traverses a field that has not been fully explored before, namely, variation in productive abilities of different regions, households and individuals. For the first time in almost a decade, the report also provides a wealth of data and information on human development at the district level based on the 2011 population Census and other relevant surveys. The Report comes at a time when the country is making efforts to move out of an extended political transition and has envi-sioned graduating from a least developed to a developing country by 2022.The Report presents rigorous statisti-cal analysis across space and time, using the available national data. The large statistical database created in the process, can be used by the Government and other development
stakeholders to formulate policies and judi-cious budget allocations to sectors, regions, districts and socio-economic groups. The Report shows that the pattern of regional in-equalities in human development as well as productive abilities remains entrenched, but there are indications that the gaps may be nar-rowing. To reduce the inequalities further, the rate of economic growth has to be enhanced without compromising the essential quality of equality and equity. The Report suggests that fusing of the two dimensions may be rel-evant in setting a federal development agenda that facilitates a multi-pronged approach to raising productive ability which can ensure sustainable human development.
A report of this nature is always a team effort. We would like to thank the team leader, authors and researchers, the National Planning Commission Secretariat and the United Na-tions Development Programme staff, as well as the members of the Steering Committee, peer reviewers, both national and international, and many others who in various ways contributed in the preparation of the Report.
Foreword
Dr. Som Lal Subedi
Member-Secretary
National Planning Commission Government of Nepal
Jamie McGoldrick
T
he Nepal Human Development Report 2014 is a joint effort of the National Planning Commission and UNDP. However, the findings, analysis and policy recommendations of the Report are those of the authors alone.In line with UNDP Corporate Policy on national human development reports, the preparation of the Nepal Human Develop-ment Report 2014 started after the forma-tion of a NHDR Steering Committee in May 2012 followed by a National Stakeholder Workshop on 22 June 2012 that determined the theme of the report. We are thankful to the leadership of Janak Raj Shah, former member of the National Planning Commis-sion, who chaired the meeting.
Based on feedback and inputs received in the workshop, Basudeb Guha-Khasnobis, Senior Economist, UNDP Nepal, prepared a concept note on assessing Nepal’s produc-tive ability and its impact on human develop-ment. The concept note was approved by the Steering Committee in November 2012. The Steering Committee also identified a team of authors led by Pitamber Sharma, with Ba-sudeb Guha-Khasnobis and Dilli Raj Kha-nal as members. The authors were supported by researchers Prakash Shrestha and Pawan Kanel and statistical assistants Tika Gautam and Anwesha Aditya. The team worked in close consultation with the National Plan-ning Commission and UNDP throughout 2013. We would like to acknowledge the in-tellectual contribution and perseverance of the entire team.
The analysis presented in the report would not have been possible without the support provided by the Central Bureau of Statistics. Grateful acknowledgements are
due to Deputy Director Generals Suman Aryal and Rudra Suwal, and Director Ishwori Prasad Bhandari of the Central Bureau of Sta-tistics.
The team presented the preliminary draft to the Steering Committee meeting on 12 December 2013 for their guidance and inputs. The initial draft was revised based on the inputs of the Steering Committee members. Also, in order to ensure effective participation of various stakeholders and na-tional ownership in finalizing the report, four consultations were organized with 1) repre-sentatives of various government ministries and departments, 2) political parties, 3) civil society and the private sector, and 4) develop-ment partners on 24-25 February 2014. We thank all the participants of the stakeholder consultations for their valuable feedback.
In parallel, the report went through a peer review process. In addition to 11 nation-al peer reviewers, the UNDP Human Devel-opment Report office, the UNDP Regional Bureau for Asia and the Pacific, and the In-ternational Centre for Human Development provided valuable feedback. The written comments received from the peer reviewers and comments from stakeholder consulta-tion were incorporated into the report, and the final document was edited by Gretchen Luchsinger.
The report would not have been possible without the continuous support and guidance from the National Planning Commission, particularly Secretary Yubaraj Bhusal and Joint Secretary and National Project Director, Strengthening National Planning and Monitoring Capacity of NPC project, Pushpa Lal Shakya. Joint Secretaries Teertha Raj Dhakal and Gopi Nath Mainali
also contributed to finalizing the Report. Moreover, Rabi Shanker Sainju, Programme Director of NPCS also contributed to initi-ate the work. The support and follow-up of UNDP Country Director Shoko Noda, Assistant Country Director Heema Khad-ka, Programme Analyst Dharma Swarna-kar; and Communication Analysts John Narayan Parajuli and Tapa Dipti Sitaula from UNDP Nepal was equally invaluable. We also extend our appreciation to Narayan Raj Maharjan, GIS Analyst from the UN Resi-dent Coordinator’s Office for producing the necessary maps.
Our thanks also go to the staff of UNDP-funded Strengthening National Planning and Monitoring Capacity proj-ect of the National Planning Commis-sion, especially National Project Manager Gyanendra Kumar Shrestha and Communi-cations and Documentation Officer Arjun Bahadur Kumal, who supported the entire process. Our thanks are also due to Hari Marasini of Print Communication who took the responsibility of designing and printing the report.
Contents
Foreword ...vii Message ...viii Acknowledgements ...ix Overview ...1 CHAPTER 1 Enhancing Productive Abilities of People and Regions 5 Capability, inclusive growth and a productive economy ...6Report objectives ...7
The regional framework ...7
Salient features of the analysis ...8
CHAPTER 2 Progress in Human Development 11 Measuring human development ...11
Comparing South Asian nations on the HDI ...12
Regional HDI values for 2011 ...12
2011 HDI values for the nine eco-development regions ...13
HDI values by district for 2011 ...14
HDI values by caste and ethnicity ...17
Gender and human development ...18
The human poverty index ...21
HPI values over time ...24
CHAPTER 3 Regional Access to Facilities and Household Well-being Indexes 27 Individual ability index ...28
Household well-being index ...28
Regional access to facilities index ...29
Measurement issues ...29
Calculating the regional access to facilities index ...29
Calculating the household well-being index ...31
Caste and ethnicity ...35
Concluding remarks ...35
CHAPTER 4 Labour and Total Factor Productivity 39 Labour productivity at the district level ...39
Labour productivity in the nine eco-development regions...41
Some findings on total factor productivity and manufacturing...43
Industry dynamics of total factor productivity ...46
CHAPTER 5
Youth Productive Ability and Employment Status 53
Productive ability and actual employment ---55
Hours of work and productive ability ---57
Caste and ethnicity ---59
Productive abilities across the nine eco-development regions ---62
Concluding remarks ---62
CHAPTER 6 Conclusions and Recommendations ---65
Human development: trends and implications ---66
Labour and total factor productivity: trends and implications ---67
Trends in the regional access to facilities, household well-being and individual ability indexes ---67
Policy implications and key messages ---69
Bibliography ---75
ANNEXES Annex 1: Data Sources and GNI Calculations ---81
Annex 2: Technical Notes on Calculating the HDI and Related Indexes ---84
Annex 3: Caste and Ethnicity Classification ---89
Annex 4: Values of the HDI and Related Indexes ---90
Annex 5: Per Capita Gross National Income---99
Annex 6: Construction of the Principal Component Analysis based indexes ---102
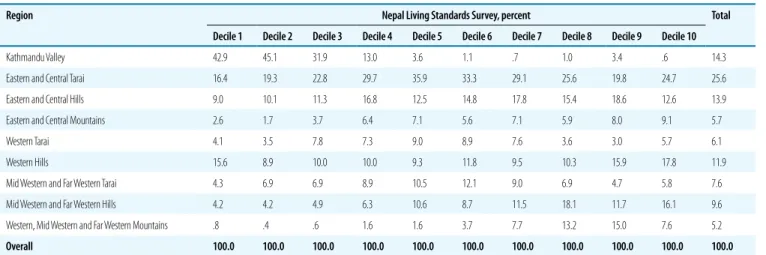
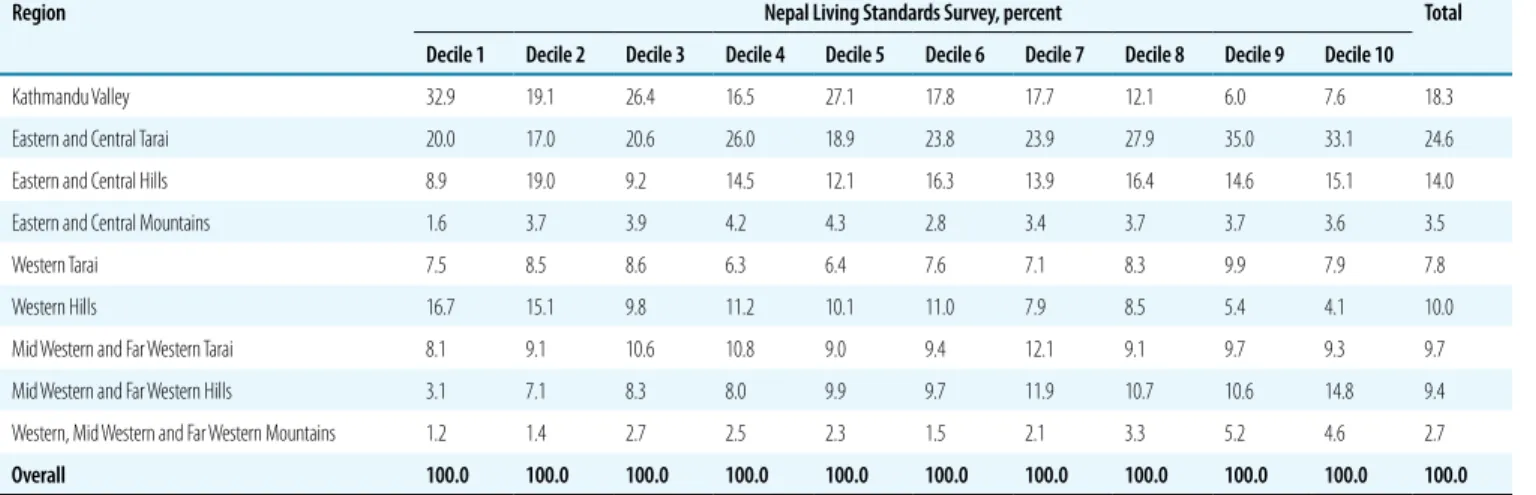
Annex 7: Percentage of Households by the Nine Eco-development Regions and Deciles ---108
Annex 8: Labour Productivity by Districts and Regions ---110
Annex 9: Nepal Standard Industrial Classification Codes ---114
Annex 10: Number of Firms by Nepal Standard Industrial Classification Codes and the Nine Eco-development Regions ---115
Annex 11: Numbers of People Employed in Different Industries and by Region ---116
Annex 12: Technical Note on the Total Factor Productivity Methodology ---117
Annex 13: Total Factor Productivity Index (Log) of Different Industrial Types by Regions and Over Time ---119
Annex 14: Average Total Factor Productivity by Industry and Eco-development Region Over Time ---121
Annex 15: Regional Composition of Ability Deciles ---124
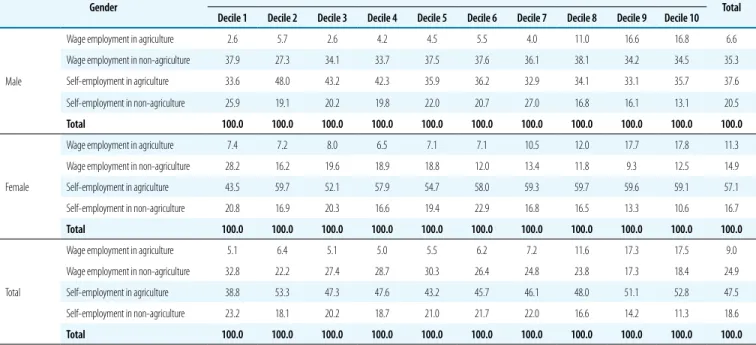
Annex 16: Employment by Sector ---125
FIGURES 2.1 HDI trends for SAARC countries, 2005-2011 ---12
2.2 Regional HDI values based on the old and new methodologies, 2011 ---12
2.3 HDI values for the nine eco-development regions, 2011 ---13
2.4 HDI values by major caste and ethnic groups, 2011 ---17
2.5 Comparative GDI values for ecological and development regions over time, 2001, 2006 and 2011 ---19
2.6 Comparative GEM values over time, 2001, 2006 and 2011 ---20
2.7 HPI scores across areas and regions, 2001 and 2011 ---22
2.8 HPI scores across the 15 eco-development regions, 2001 and 2011 ---25
3.1 Gaps between deciles, percentages---33
4.3 Histogram of the district labour productivity index ---41
4.4 Labour productivity of different sectors ---41
4.5 Regional and sector labour productivity ---42
4.6 Region and sector labour productivity relative to the national average ---42
4.7 Regional spatial distribution of labour productivity ---43
4.8 Labour productivity and the HDI by district ---43
4.9 Labour productivity and the HDI by region ---44
4.10 Labour productivity and poverty levels in 75 districts ---44
4.11 Average aggregate total factor productivity in nine eco-development regions ---47
4.12 Total factor productivity and the HDI in the nine eco-development regions ---47
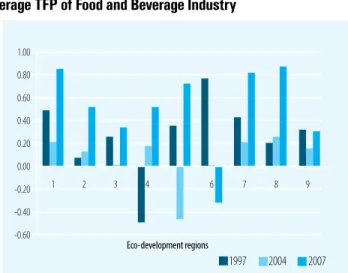
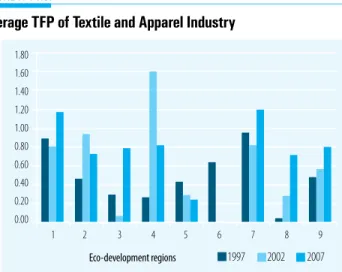
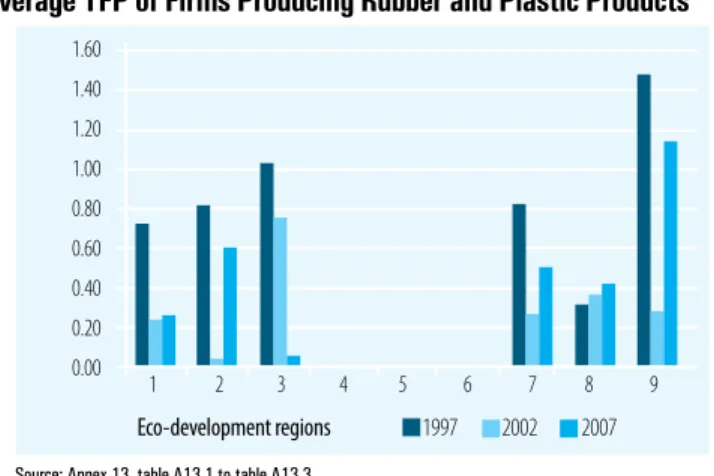
4.13 Dynamics of the average total factor productivity of different industries ---48
5.1 Distribution of ability in households based on caste and ethnicity, per decile, 1995-2011 ---60
5.2 Average individual productive ability of regions relative to the Kathmandu Valley ---62
MAPS 2.1 HDI values across the 15 eco-development regions, 2011 ---13
2.2 HDI values for the nine eco-development regions, 2011 ---14
2.3 HDI values across districts, 2011---15
2.4 HDI values across the 15 eco-development regions, 2001, 2006 and 2011---16
2.5 HPI values across the 15 eco-development regions, 2011 ---21
2.6 HPI values across nine eco-development regions, 2011 ---22
2.7 HPI values across districts, 2011 ---23
2.8 HPI values across 15 eco-development regions, Nepal 2001, 2006 and 2011 ---24
TABLES 2.1 Districts categorized by HDI values, 2011 ---15
2.2 Districts with the highest and lowest HDI scores, 2001 and 2011 ---16
2.3 Districts with the highest positional changes in HDI status---17
2.4 Poverty incidence by caste and ethnicity, 2011 ---18
2.5 Percentage shortfall of GDI over HDI scores by region, 2001, 2006 and 2011 ---19
2.6 Districts categorized by HPI values, 2011 ---20
2.7 Districts with the highest and lowest HPI values, 2001 and 2011 ---21
3.1 Access to facilities scores ---29
3.2 Access index of the nine eco-development regions ---30
3.3 Scoring drinking water sources in regions ---31
3.4 Deciles of the household well-being index ---32
3.5 A gradual increase in urban residents ---33
3.6 The number of female-headed households is growing ---34
3.7 Mean household well-being index values and ranks of the nine eco-development regions ---35
5.1 Male-female productive ability ---54
5.2 Gender composition of deciles, 1995 ---55
5.3 Gender composition of deciles, 2003 ---55
5.4 Gender composition of deciles, 2011 ---55
5.5 Distribution of rural and urban populations, 1995 ---56
5.6 Distribution of rural and urban populations, 2003 ---56
5.7 Distribution of rural and urban populations, 2011 ---56
5.8 Mean hours spent in various sectors of employment by rural and urban areas, and gender, 1995 ---57
5.9 Mean hours spent in various sectors of employment by rural and urban areas, and gender, 2003 ---58
5.10 Mean hours spent in various sectors of employment by rural and urban areas, and gender, 2011 ---58
N
epal Human Development Report 2014 comes at a time when the country is making efforts to move out of an extended political transition and has resolved to accelerate its graduation from a least developed to a developing country by 2022. The importance of inclusive growth and human development to sustain peace, achieved after a long conflict, has been deeply ingrained among all stakeholders. The agenda for the years to come is high-quality growth and equi-table development in its broadest sense.The criteria for graduating from the least developed country category include achievements in per capita gross national in-come (GNI), the Human Assets Index and the
Economic Vulnerability Index.1 Increasing the
growth rate from the current level of below 4 percent is indispensable, without compromis-ing the essential quality of inclusiveness. At the same time, Nepal needs to maintain re-cent gains on some of the sub-indicators for the human assets and economic vulnerability indexes, and address shortfalls on some others. With this background, the central theme for the present Nepal Human Devel-opment Report—the spatial dimensions of productive abilities—was developed jointly with the National Planning Commission and other relevant stakeholders. The report aims to assess productive abilities at different, in-terrelated levels. The measures of abilities developed in this report suggest how much capacity the Government has to accomplish high and inclusive growth in the coming years and indicate the extent to which current
capabilities are being translated into measur-able outputs.
The report presents a rigorous statistical analysis across space and time, using the avail-able national data. Since there is currently no single, universally accepted definition or mea-sure of productive ability, the report asserts that this can be reflected, directly or indirectly, by a number of indicators. The large statisti-cal database created in the process, it is hoped, may be used by the Government and other development stakeholders to target policies and rationalize budget allocations to sectors, regions, districts and socio-economic groups.
Structure of the report
The report is organized in six chapters.
Chap-ter 1 introduces it in the context of previous Nepal Human Development Reports and defines, for analytical purposes, nine eco-de-velopment regions, instead of the 15 conven-tional ones.
Chapter 2 presents the standard human development indexes at the district level, for the first time in a decade; at the regional level; and, data permitting, at the level of various social groups. The indexes include the well-known Human Development Index (HDI) and its variations including caste/ethnic and gender dimensions, as devised by the global Human Development Report. All of these emphasize looking beyond income as an indi-cator of development. Their values reflect the effects of past policies in strengthening human
Overview
Nepal’s 2014 Human Development Report assesses productive abilities at different interrelated levels by using the available
national data. It indicates the trends in spatial inequalities and outlines the prospects of unlocking the human potential and
achieving high-quality inclusive growth.
capital, which is expected to contribute posi-tively to any indicator of productive ability. The overall picture that emerges is that HDI values are improving, but inequalities among regions and social groups remain mostly intact, although there are signs that some of these may be narrowing. The analysis also points to spe-cific caste, ethnic and geographic dimensions of persisting inequalities.
Chapter 3 features an innovation in measuring potential productive ability. The HDI and related indexes are essentially based on individuals. While important in their own right, these measures can be complemented by plausible indicators of productive ability that treat regions and households as units. The chapter constructs a regional access to facilities index for each of the nine eco-de-velopment regions and analyses trends over the past two decades. The index is essentially a composite measure of the ease with which households can access certain facilities that are covered by Nepal Living Standards Sur-vey and are critical for well-being. From a policy perspective, the index may be used to guide resource allocations for infrastructure to make Nepal’s diverse regions more com-parable in the pursuit of inclusive growth and development.
The chapter also constructs a house-hold well-being index for all househouse-holds cov-ered by successive survey rounds. This index is based on all information in the surveys that reflects, directly or indirectly, the overall so-cio-economic well-being of a household. The index is analysed along a number of dimen-sions, including regional, rural and urban, male- and female-headed households, and so on. Additionally, it is classified according to caste and ethnicity. It helps make the basic ar-gument that an individual’s productive ability is significantly affected by the well-being of the household s/he comes from. Improving household well-being through appropriate policies, therefore, indirectly improves the nation’s productive ability.
The report shows that there has been no change in the ranking of regions by the re-gional and household indexes over time; lag-ging regions continue to lag. While inequali-ties among different social groups remain, these inequalities may be narrowing, however.
Chapter 4 estimates sectoral labour productivity as well as total factor productiv-ity of the manufacturing sector at the regional and industry levels, on the basis of available Census and survey information. These two well-known measures of actual productivity provide a broad picture of the level of and inequalities in productivity at regional levels, and indicate the context within which indi-vidual and household productive abilities need to be appreciated. Analysis of these mea-sures could guide policy choices, since they identify sectors and regions where productiv-ity is already high, and that in principle may serve as engines and epicentres of growth. The report also identifies exceptional regions with a mismatch between indicators of human de-velopment and productive ability, mainly in the Eastern and Central Tarai. Rectification of the mismatch is needed in order to achieve high and inclusive development.
Chapter 5 constructs a youth ability index at the individual level for the popula-tion group aged 15-39, based on all three Nepal Living Standards Surveys. It examines trends along many relevant dimensions, with an information set much larger than that used by the HDI and related indexes. The youth ability index includes the personal characteristics of individuals, such as health, education and possible indicators of psycho-logical well-being, albeit limited by data, and the status of the household s/he comes from. Household capital, proxied by the well-being index calculated in Chapter 3, is included as a determinant of the potential productivity of an individual. Statistical analysis reveals a high degree of inconsistency between the po-tential productive ability of youth, and the type and hours of work they seem to be
per-To achieve high and inclusive growth the mismatch between indicators of human development and productive ability has to be rectified.
forming. To reap the demographic dividend2
of a young population, this ought to be ad-dressed quickly.
Chapter 6 presents major conclusions and policy recommendations emanating from the analysis. It calls for pursuing poli-cies to accelerate the narrowing of regional inequalities in human development as well as productive abilities. It urges focusing on lagging regions, expanding the reach of inclu-sive policies, prioritizing urban management and rural-urban linkages, and preparing for opportunities presented by the demographic dividend.
Major findings
By focusing on spatial inequalities in human development and the productive abilities of people, this report presents a picture that is both sobering and encouraging. The status quo of gaps in regional human development and productive abilities persists, but
inequali-ties seem to be narrowing. This indicates the need to maintain, but with renewed vigour, the path of inclusive growth and develop-ment, encompassing all regions as well as socio-economic groups that have been left behind. The pace of economic growth needs to accelerate, and be accompanied by large-scale employment generation and enhanced productivity in sectors such as high-value ag-ricultural niches, industry and infrastructure development. These efforts should in part be oriented towards harnessing the tremendous vibrancy and energy of a growing population of young people.
Innovative statistical analysis combin-ing the spatial and ethnic dimensions of pro-ductive ability makes the critical point that ethnicity, on which the current political dis-course is primarily focused, has a spatial di-mension. The report suggests that a fusing of the two dimensions may be relevant in setting a federal development agenda focused on a multi-pronged approach to raising productive ability and accelerating human development.
The pace of economic growth needs to accelerate and be accompanied by large scale employment generation and enhanced productivity.
1 The former is based on two education and two health indicators; the latter on eight indicators of different sectors related to the structural aspects of the economy.
2 The demographic dividend generally refers to the process of accelerated economic growth that accompanies changes in the age structure of a country’s population as it moves from high to low birth and death rates, resulting in fewer young and older people relative to the working-age population.
Enhancing Productive
Abilities of
People and Regions
1.
Enhancing Productive Abilities
of People and Regions
The route to poverty alleviation and human development involves building up basic capabilities and enhancing the productive
abilities of people. Inclusivity is best anchored in fair and comparable distribution of productive abilities.
S
ince the publication of the first globalHuman Development Report in 1990, the concept of human development has provided the most compassionate yardstick to assess people’s progress. The idea that develop-ment has no meaning except with reference to the human being and the sum total of who s/he is, and what s/he is capable of, has been profoundly challenging to notions of develop-ment based solely on incomes and economic growth.
The distinctiveness of human devel-opment is the focus on people’s well-being, through the expansion of human capabili-ties and choices to live full, creative lives with freedom and dignity. Capabilities or potential abilities to achieve valuable functionings de-fine the life of an individual, or collectively a community or nation. This perception has opened new vistas in assessing development and exploring pathways for progress. The hu-man development perspective provides a basis for development priorities that include prin-ciples such as equality and sustainability, and the pursuit of better health, education, infor-mation, security, quality of life, governance, political and social freedoms, participation and inclusion, and so on for every citizen, not just the majority.
Successive Nepal Human Development Reports have assessed the status of human de-velopment at national, regional and district levels, while focusing on specific themes of contemporary relevance. The first report in 1998 was grounded in a political economy
perspective, and preceded from an analysis of basic development structures and processes, including aspects of natural and human re-sources, economy, polity and culture. It recom-mended a series of actions to reorient society, polity, the economy and public finances that were seen as imperative to human develop-ment. The 2001 report considered poverty re-duction and governance, with persistent pov-erty seen as a direct result of weak governance institutions and ineffective implementation of programmes and policies. The report recom-mended reforms in administrative and fiscal decentralization, and called for enhancing lo-cal governance, encouraging lolo-cal government and NGO partnerships, and promoting the empowerment of marginalized groups.
The 2004 Report examined poverty reduction from an empowerment perspec-tive, emphasizing equal opportunities for all. It advocated building empowerment on three pillars: people-responsive state institutions, removal of social barriers and discrimination, and stronger local organizational capacity and social capital. For the 2009 Report, on state transformation and human development, persistent inequality in human development was identified as both the cause and effect of exclusion. Different options were explored in restructuring the state and reforming the po-litical system to accommodate the interests of different groups. A 10-point agenda proposed federalism to foster social justice, inclusion and participation that would result in lasting peace and human development.
Capability, inclusive growth and a
productive economy
All of Nepal’s Human Development Reports have highlighted the persistence of inequality and poverty, and advocated policy and institu-tional initiatives to promote inclusion and em-powerment. These issues resonate strongly in Nepal. From a capability perspective, poverty is a basic “capability failure” in achieving “certain crucially important functionings up to a certain minimally adequate level” (Sen 1993, p. 4). The route to poverty alleviation involves building up basic capabilities through the addition and/or en-hancement of crucially important functionings.
There is no consensus on what basic capabilities are, or should be, however, and whether or not, given human diversity and as-sociated value judgments, such a list, if drawn, can be universally accepted. While discourse on this approach is relatively rich at the con-ceptual and philosophical levels, operational guidance remains limited. A critical constraint in producing an empirical measure is that household surveys are not typically designed to capture the required broader information set.
Similarly, the concepts of inclusive growth and inclusive development do not have universally accepted operational measures. If one were to emerge, it would have to comprise a sense of the distribution of well-being, reduc-tion in inequality and poverty, and the avail-ability and distribution of opportunities.
In general, inclusion, or the lack of it, fac-tors into the process through which growth or development happens. Inclusive growth is seen as reducing disadvantages, expanding opportunities and discouraging exclusion, and is discrim-inatory. Inclusive development subsumes non-income dimensions of well-being, and includes distribution not only across individuals, but also across groups differentiated by gender, ethnic-ity, regional location, and so on. The hallmarks of inclusive growth are wider participation and benefit sharing, and the breaking of discrimina-tory barriers to create a more level playing field.
tion and recognition, just and equal distribution, and redistribution of opportunities and achieve-ments are conditions fostering inclusive develop-ment.
Enhanced functionings and abilities of individuals and groups in general, and of the more disadvantaged and marginalized
popu-lations as well as regions1 in particular, are the
building blocks of a more inclusive, participato-ry society. For countries like Nepal, where pro-vision of productive employment opportunities is a major challenge, inclusive development also needs to be broadly based across economic sec-tors, and involve a large part of the country’s
la-bour force, especially youth aged 15-39 years.2
An indispensable requirement for targeted policy intervention is sufficiently disaggregated evidence on productive abilities reflected in the socio-economic status of households and in-dividuals, as well as the development status of regions. This requires an assessment of ground conditions related to these measures.
For poverty reduction, inclusive growth and development to be economically and politi-cally sustainable, Nepal cannot rely only upon foreign aid, remittances, or other redistributive and transfer measures. Inclusivity is best an-chored in fair and comparable distribution of productive capabilities where human beings, the “ultimate resource,” show their ingenuity and productivity. Inclusive growth achieved in this way is rooted in the productive economy, and therefore likely to be self-sustaining.
This direction is particularly important for Nepal, given the many limits on the po-tential for transfer mechanisms, including ad-ministrative and governance bottlenecks, and the significant number of economic activities remaining outside the market system. Further, Nepal is presently in the midst of a political transition. In spite of the differing ideological positions of political parties, the emerging con-sensus seems to be that while the role of the state will remain crucial in areas such as education, health, infrastructure development and social security, market-based approaches can be
ef-Inclusive growth rooted in the productive economy is likely to be
the long run. Where the scope of redistribution may be limited, the emphasis should be on affir-mative action as a mechanism for enhancing the productive potential of disadvantaged groups.
Report objectives
Since the adoption of democracy in 1990, Nepal has pursued several strategies to address multidimensional human development, inclu-sivity and growth. The present political transi-tion notwithstanding, the efforts of the Govern-ment, supported by development partners, have broadly been to accelerate aggregate growth through investments in social and physical in-frastructure, and create enabling institutional mechanisms. Efforts are also ongoing to devel-op the rule of law and the democratic character of institutions at all levels. However, structural problems related to control over and access to resources remain largely unaddressed.
This report attempts to assess produc-tive capability at the levels of regions, house-holds and individuals, as determined by de-velopment efforts of the past two decades or so. Based on available data, the report creates a comprehensive information set, at suitably disaggregated levels, that could guide policy interventions towards inclusive growth and development in the coming years. The set is preliminary because it takes into account only certain indicative aspects of the produc-tion structure of Nepal. It does not explicitly account for regional resource endowments, except as these are reflected in factor produc-tivity. In due course, richer data sets may be available to address the possible limitations of the measures used here.
One aspect of regional productive abili-ties is reflected in the status of labour and total factor productivity, discussed in chapter 4 of the report. The other aspect, regional develop-ment status, is indicative of access to social, economic and physical infrastructure, as de-tailed in chapter 3. Measures of the produc-tive abilities of households and individuals
developed in chapters 3 and 5 are closer to the concepts of “well-being” and “ability” status commonly used in development economics. Broadly speaking, well-being involves many dimensions: education and occupation of fam-ily members and the welfare of the household as a measure of goods and services accessibil-ity. Measures of well-being usually serve as an input to other analyses such as of inequality or poverty; tabulation of population characteris-tics by quintiles or deciles; or regressions that involve welfare as an explanatory or dependent variable, and aim at explaining, for example, household health status. In policy-oriented ap-plications, these measures are also utilized to make decisions regarding the allocation of re-sources and programmes to benefit the poor.
The regional framework
The report focuses on spatial inequalities in productive abilities primarily at the regional level. With the adoption of the development region concept after its Fourth Plan (1970-1975), Nepal has, for analytical purposes, been divided into three east-west or latitudi-nal ecological regions (Mountains, Hills and Tarai), and five development regions (East-ern, Central, West(East-ern, Mid Western and Far Western) oriented from north to south. A combination of the two yields 15 eco-opment regions. Districts, not village devel-opment committees, are the primary units for inclusion in the ecological and development regions, irrespective of the fact that a num-ber of Mountain districts include areas with ecological attributes typical of the Hill region.
The idea behind the eco-development regions was that they would be regarded as having specific resource and spatio-economic attributes, with implications for subregional planning, resource mobilization and policy formulation. The experience of the past sev-eral decades indicates that while the eco-de-velopment regions have continued to be used as the framework for subregional data
presen-Measures of well-being serve as input to analysis of inequality and poverty.
tation and analysis, the subregions themselves have been neither planning units nor units of policy analysis. The case of the Central Hills region elucidates the fallacy of this frame-work, as the indicators of the Kathmandu Valley simply overwhelm those for other dis-tricts. The concept of 15 eco-development regions has been redundant for all practical purposes of policy and programme formula-tion and assessment.
In this report, the 15 eco-development region framework is used for presenting hu-man development data for the sake of compar-ison with the previous reports. To facilitate a more realistic analysis of human development, as well as other productivity-related indicators, including the Human Development Index (HDI), a nine eco-development region frame-work is also utilized. This basically treats the three Kathmandu Valley districts as one unit, and clubs together the Mountains, Hills and Tarai of the Eastern and Central eco-develop-ment regions, and the Mid Western and Far Western eco-development regions.
The nine regions, with the number of districts in parentheses, are: the Eastern and Central Mountains (6), the Eastern and Cen-tral Hills (14), the Eastern and CenCen-tral Tarai (12), the Kathmandu Valley (3), the Western Hills (11), the Western Tarai (3), the West-ern, Mid Western and Far Western Mountains (10), the Mid Western and Far Western Hills (11), and the Mid Western and Far Western Tarai (5).
The nine-region framework was used to recognize the Eastern and Central Tarai, the Kathmandu Valley, and the Mid Western and Far Western Hills and Mountains as distinct regional entities by virtue of their location, hu-man development and productive potential, as well as their socio-ethnic characteristics, and their status in Nepal’s political economy. It also facilitates use of Nepal Living Standards Sur-vey data, the basis of much of the forthcoming analysis, and does not deviate too much from the 15-region framework. The nine-region
breakdown serves only as an analytical device to portray spatial inequalities in Nepal.
While it would have been more desir-able to include the Western Mountains as a separate region, this was not possible for the simple reason that each eco-development re-gion needs to have enough data-points for sur-vey information to be representative. With the Nepal Living Standards Survey data, the West-ern Mountains region has no data-points; it was therefore combined with the Mid Western and Far Western Mountain regions. Almost all districts in the Western, Mid Western and Far Western Mountain regions lie in the high Himalayas and the trans-Himalayan area. The Western Mountain districts of Manang and Mustang have a demographic and economic profile quite different from the Mid Western and Far Western Mountains by virtue of rela-tively small populations, higher levels of mi-gration, remittance income and the impact of tourism. Wherever possible, data for the Mid Western and Far Western Mountains have been provided separately to account for this difference.
Salient features of the analysis
Several salient features of the Report’s empiri-cal analyses deserve attention upfront. First, the HDI and total factor productivity esti-mates compare the actual status of economic and development outcomes across the nine re-gions. These are cross-sectional estimates, and can be used only for comparisons at specific time periods on which the data are based.
Second, the regional, household and individual indexes are derived from princi-pal component analysis and are embedded in the domain of “potential.” For example, the regional access to facilities index shows how easy or difficult access is/was for households. It does not indicate whether or not or how often households use the facilities. Its purpose is to examine whether or not gaps in the
develop-The nine-region framework is used only as an analytical device to portray spatial inequalities.
ment status of regions have narrowed or wid-ened in the past 20 years, and which dominant facilities define development status.
Third, the household well-being index is based on the premise that multiple
char-acteristics3 need to be factored into an
assess-ment of the potential strength or resilience of a household. These characteristics are derived both from public investment, such as in access to facilities, and a whole range of private invest-ments that the household undertakes over time. Examining trends over time and across groups gives a sense of how effective various endeavors by the Government have been in strengthening as well as equalizing household status.
High and comparable productive status is a prerequisite for eventual inclusive income or consumption growth. The household well-being index serves, in principle, two purposes: It reflects the impact of both government and household efforts in shaping the comparative well-being of households over time; and it is a key indicator of the possible contribution of the status of the household in expanding (or contracting) an individual member’s potential. Putting it simply, two individuals with identi-cal health, education and other personal char-acteristics often face different opportunity sets depending on the household they come from.
Fourth, most existing global measures of human development are designed under the binding constraint of having to use only those dimensions that have reliable data and are comparable across all countries. In a national context, it is possible to use a much larger in-formation set relevant to the measurement of
development at various levels: regional, house-hold and individual. Another issue linked to the constraint of international comparability is that even within the limited set of indica-tors, weights are usually assigned in a pre-determined manner. In this report, principal component analysis addresses these potential drawbacks by using every piece of information carefully collected by Nepal Living Standards Survey, and deriving optimal, not pre-deter-mined, weights for each variable entering the construction of indexes.
Fifth, the three rounds of Nepal Liv-ing Standards Survey provide the only avail-able data set for inter-temporal analysis. The surveys were not necessarily designed to fully address the questions asked in this report. Nev-ertheless, they provide a reasonable description of access to facilities by region and information on household indicators of well-being.
Finally, the index on the productive ability of individuals should not be viewed as a capability index, because the survey on which it was based was not designed to cap-ture the conceptual details of this approach. The index goes beyond the personal char-acteristics of an individual and incorporates household status as an important determi-nant of a person’s potential. Household status itself is a composite of a wide range of vari-ables. At best, it is an instrument for or an indicator of how a person’s opportunity set is determined. The logical connection between the access to facilities, household well-being and individual ability indexes is explained in chapter 3.
Nepal Living Standards Survey data set used for inter-temporal analysis provide a reasonable description of productive ability.
1 Given the extremely diverse topography of Nepal, with some remote and inaccessible areas, uniform development of various regions is critical
for eventual inclusive growth.
2 According to Nepal’s Youth Policy, people aged 16-40 are classified as youth. For this Report, we have used greater than 15 and less than or
equal to 40 year olds as the working age group.
Progress in
Human
Development
Progress in Human Development
The human development index values for all ecological and development regions have improved over time. Comparative
im-provements are also seen in gender development index and gender empowerment measures across regions. Overall, the human
poverty situation has improved. However, the disparities among geographical regions and ethnic groups remain entrenched
though there are indications that the gaps may be narrowing.
2.
H
uman development in Nepal, atvari-ous disaggregated spatial and social group levels, has been reported in suc-cessive Nepal Human Development Reports since 1998. Slight methodological changes notwithstanding, Human Development Index (HDI) values are more or less comparable over time. They reveal both inequalities in human development across geographical regions and social groups, and the extent and direction of progress. The status of human development can then be appreciated in the context of economic, social and political policies pursued by the State.
This chapter presents the HDI and its well-known companion indexes. Chapters 3 and 5 offer comparative perspectives by ex-ploring how various aspects of human devel-opment relate to the productive potential of regions and people.
Measuring human development
Human development is fundamentally con-cerned with expanding people’s choices, which has multiple dimensions and can be quite com-plex. This problem was simplified by the global Human Development Report’s introduction of the HDI as a simple composite index. Similar indexes include the Gender-related Develop-ment Index (GDI), the Gender EmpowerDevelop-ment Measure (GEM) and the Human Poverty Index (HPI). These easily understood measures indicate the state of people’s lives in various dimensions.
The HDI reflects average achievements in three respects:
• A long and healthy life, measured by life
ex-pectancy at birth;
• Knowledge, measured by adult literacy and
mean years of schooling; and
• A decent standard of living, measured by GNI
per capita in purchasing power parity (PPP$). For this report, the HDI has been calculated for:
• The whole country;
• Urban and rural areas;
• Three ecological regions;
• Five development regions;
• Fifteen eco-development regions (resulting
from the three ecological regions and five development regions);
• Nine eco-development regions (as defined
in chapter 1);
• Districts; and
• Eleven caste and ethnic groups, comparable
with previous reports, with additional values for selected groups.
HDI values by district are calculated using the latest available data. This comprises 2011 Census data for health and education in-dicators, and, for the first time in the income calculation, new national accounts estimates of the Central Bureau of Statistics (2011) for per capita GNI in PPP$. Data from the 2011 Na-tional Living Standards Survey have been used to compute income for caste and ethnic groups. For full details on data sources, see annex 1.
The concept and computation of the HDI and related indexes is presented in annex 2. Caste/ ethnic classification is presented in annex 3.
Comparing South Asian nations on the HDI
The HDI score for Nepal in 2011 is 0.458, the lowest ranking among the countries of the South Asian Association for Regional Coopera-tion (SAARC), aside from Afghanistan (figure 2.1). Since 2007-2008, Bangladesh has moved ahead of Nepal. Despite Nepal ranking second in terms of life expectancy at birth and improve-ments in education indicators, it still has a low
FIGURE 2.1
HDI trends for SAARC countries, 2005-2011
Source: UNDP 2009, 2011.
Nepal
2005 2006 2007/08 2009 2010 2011
Pakistan Afghanistan Bhutan
India Sri Lanka Bangladesh
0.3 0.35 0.4 0.45 0.5 0.55 0.6 0.65 0.7 0.75 0.8 FIGURE 2.2
Regional HDI values based on the old and new methodologies, 2011
Source: Annex 4, table A4.1.
Geometric mean (new methodology) Arithmetic mean (old methodology) 0.400 0.450 0.500 0.550 0.600 0.650 0.630 0.541 0.490 0.464 0.517 0.579 0.569 0.5420.558 0.553 0.503 0.493 0.435 0.447 0.499 0.510 0.490 0.440 0.468 0.520 0.521 0.496
Nepal Urban Rur
al
Moun
tains Hills Tarai
East ern dev elopmen t region Cen tral dev elopmen t
region Western
dev elopmen t r egion Mid W est ern dev elopmen t r egion Far W est ern dev elopmen t r egion
RC countries on the HDI, followed by India in the second place, Bhutan in the third and Paki-stan in the fourth. Poor education and health status are the major factors for India’s relatively low score overall.
Regional HDI values for 2011
The 2010 global Human Development Report changed the way of calculating the HDI, from using an arithmetic to a geometric mean. This method yields a lower HDI value compared to similar values reported in 2006 nationally and across all regions. Nepal’s national HDI value, based on the geometric mean, is 0.490 for 2011, compared to 0.541 for 2011, using the arithme-tic mean. Values obtained by the two methods for the country, urban and rural areas and eco-logical and development regions are provided for comparison in figure 2.2.
However, irrespective of the methodol-ogy, and in spite of changed HDI values, the overall HDI pattern remains similar across all regions, with no changes in rank.
Using the more robust method of the geometric mean for 2011 HDI calculations, among the ecological regions, the Hills has the highest HDI value at 0.520, compared to the Tarai at 0.468 and the Mountains at 0.440. Within the development regions, the Central region, at 0.510, ranks at the top, followed by the Western, Eastern, Mid Western and Far Western regions (annex 4, figure A4.1).
The lowest HDI value is for the Moun-tains, at 0.440. This is primarily due to low scores for life expectancy in the region’s five districts, Dolpa, Jumla, Kalikot, Bajura and Humla. This region includes two districts with the lowest values for education, Humla and Mugu, and three districts with the lowest val-ues for income, Bajhang, Bajura and Kalikot.
Among the development regions, the Far Western region at 0.435 and the Mid Western region at 0.447 have the lowest HDI values, re-flecting very low scores in all three dimensions.
higher per capita income, mainly in Kathman-du, Lalitpur, Bhaktapur and Manang districts. Ramechhap and Gorkha districts score high in life expectancy (annex 4, table A4.1).
Among the 15 eco-development regions, the Central Hills has the highest HDI score at 0.571, and the Far Western Mountains the low-est at 0.386. In the Tarai, the Eastern Tarai has the highest value at 0.485; the Central Tarai the lowest at 0.443. Among the Hill regions, the Far Western Hills has the lowest HDI score, at 0.409. For the Mountains, Western Mountains fares better at 0.529 by virtue of higher incomes in Manang and Mustang. Far Western Moun-tains lags behind at 0.386, largely due to low edu-cational level and per capita income (map 2.1).
2011 HDI values for the nine
eco-development regions
The nine-eco-development-region framework provides a discerning picture of inequalities in regional HDI values for 2011 (figure 2.3 and map 2.2). The Kathmandu Valley region has the highest HDI score at 0.622, stemming
Eastern and Central Mountains Eastern and Central Hills (without Kathmandu Valley) Eastern and Central Tarai Kathmandu Valley Western Hills Western Tarai Western, Mid Western and
Far Western Mountains Mid Western and Far Western Hills Mid Western and Far Western Tarai Nepal
FIGURE 2.3
HDI values for the nine eco-development regions, 2011
0.300 0.350 0.400 0.450 0.500 0.550 0.600 0.650 0.475 0.490 0.463 0.622 0.511 0.480 0.398 0.423 0.472 0.490
largely from high scores for educational at-tainment and level of per capita income. Kath-mandu, Lalitpur and Bhaktapur are at the top of the four highest ranking HDI districts in Nepal. The Western Hills at 0.511 followed by the Eastern and Central Hills (without the
MAP 2.1
HDI values across the 15 eco-development regions, 2011
Source: Annex 4, table A4.1
0.392 0.511 0.430 0.571 0.498 0.496 0.443 0.485 0.476 0.458 0.529 0.480 0.466 Legend HDI Values 0.386 - 0.409 0.410 - 0.443 0.444 - 0.485 0.486 - 0.529 0.530 - 0.571 0 50 100 Kilometers Far Western Mountains
0.386
Far Western Hills
0.409
Mid Western Mountains
Mid Western Hills
Mid Western Tarai
Far Wester Tarai Western Mountains
Western Hills Western Tarai Central Mountains Central Hills Central Tarai Eastern Mountains Eastern Hills Eastern Tarai
Kathmandu Valley) at 0.490 have the second and third highest HDI scores. The HDI value for the Western Mountains at 0.529 exceeds that of the Mid Western Mountains at 0.392 and the Far Western Mountains at 0.386. When the Western, Mid Western and Far Western Mountains are lumped together, their overall HDI value is 0.398.
Only the Kathmandu Valley and West-ern Hills have higher HDI values than the na-tional average of 0.490. The former’s score is 1.6 times higher than that of the Western, Mid Western and Far Western Mountains, under-scoring huge gaps and inequalities in human development across the nine regions.
The Eastern and Central Tarai, com-prising 11 Tarai districts from Parsa to Jhapa, has a score of 0.463, making it modestly bet-ter off than the Wesbet-tern, Mid Wesbet-tern and Far Western Mountains, and the Mid Western and Far Western Hills.
HDI values by district for 2011
At the district level, Kathmandu, Lalitpur, Kaski, Bhaktapur and Manang have the high-est HDI values for 2011, whereas Bajura, Ba-jhang, Kalikot, Humla and Achham have the lowest ones (see map 2.3).
Overall, in 2011, there are 10 districts — eight in the Mid Western and Far Western Mountains and Hills, and two in the Eastern Tarai—that have very low HDI values of less than 0.4. The next 16 districts—including nine in the Mid Western and Far Western Hills and Mountains, and four in the Eastern Tarai—have HDI scores between 0.4 and 0.449. Thirty dis-tricts, mostly in the Hills, have scores between 0.45 and 0.499. Another 13 districts, mainly in the Eastern and Central Hills, have scores be-tween 0.5 and 0.549. The six districts with the highest HDI values are in the Kathmandu Val-ley, together with Kaski, Manang and Chitwan.
Mid West and Far Western Hills and Mountains and large parts of Central and Eastern Tarai are behind in human development.
MAP 2.2
HDI values for the nine eco-development regions, 2011
Source: Annex 4, table A4.1.
0.511 0.490 0.423 0.398 0.463 0.475 0.480 0.472 0.622 Legend HDI Values Less than 0.45 0.451 - 0.475 0.476 - 0.500 0.501 - 0.525 > 0.525 0 50 100 Kilometers Western, Mid Western and Far
Western Mountains
Mid Western and Far Western Hills
Western Hills Mid Western and
Far Western Tarai
Kathmandu Valley Western Tarai
Eastern and Central Mountains
Eastern and Central Hills Eastern and Central Tarai
A clear pattern emerges where the Mid Western and Far Western Hills and Mountains and parts of the Central and Eastern Tarai lag behind in human development (table 2.1).
Rural-urban HDI gaps
The 2011 urban-rural gap in HDI is large, at 19.7 percent based on the geometric mean compared to 11.2 percent using the arithmetic
mean. This essentially reflects persistent dis-crepancies in income and education between urban and rural areas.
The HDI over time
Computing the HDI on the basis of the arith-metic mean can be used to track trends in ecological and development regions over time. This shows steady improvements in values
HDI values Districts with HDI scores in ascending order Number of districts
< .400 Bajura, Bajhang, Kalikot, Humla, Achham, Rautahat, Mahottari, Jajarkot, Rolpa, Mugu 10 .400 –.449 Dolpa, Sarlahi, Doti, Siraha, Jumla, Pyuthan, Baitadi, Dailekh, Rukum, Dhanusha, Kapilbastu, Darchula, Saptari, Sindhuli, Salyan, Dadeldhura 16 .450 – .499 Sindhupalchowk, Bara, Dolakha, Kailali, Rasuwa, Dhading, Parsa, Gulmi, Nuwakot, Bardiya, Okhaldhunga, Ramechhap, Kanchanpur,
Uday-pur, Baanke, Surkhet, Baglung, BhojUday-pur, Gorkha, Arghakhanchi, Dang, Sankhuwasabha, Myagdi, Nawalparasi, Khotang, Taplejung, Sunsari, Makwanpur, Rupandehi, Paanchthar
30
.500 – .549 Palpa, Solukhumbu, Tanahu, Lamjung, Mustang, Parbat, Morang, Dhankuta, Jhapa, Kavrepalanchowk, Illam, Terhathum, Syangja 13 > .550 Chitwan, Manang, Bhaktapur, Kaski, Lalitpur, Kathmandu 6 Source: Annex 4, table A4.1.
TABLE 2.1
Districts categorized by HDI values, 2011
MAP 2.3
HDI values across districts, 2011
Source: Annex 4, table A4.1.
Dolpa 0.401 Humla 0.376 Mugu 0.397 Dang 0.485 Kailali 0.460 Gorkha 0.481 Doti 0.407 Jumla 0.409 Bajhang 0.365 Mustang 0.508 Rukum 0.431 Ilam 0.526 Taplejung 0.494 Kaski 0.576 Bajura 0.364 Rolpa 0.395 Myagdi 0.490 Surkhet 0.476 Banke 0.475 Manang 0.568 Salyan 0.441 Bara 0.457 Jajarkot 0.393 Dolakha 0.459 Bardiya 0.466 Jhapa 0.518 Darchula 0.436 Palpa 0.500 Parsa 0.464 Morang 0.513 Chitawan 0.551 Kalikot 0.374 Baitadi 0.416 Achham 0.378 Dailekh 0.422 Saptari 0.437 Lamjung 0.507 Siraha 0.408 Tanahun 0.506 Kapilbastu 0.432 Sindhuli 0.440 Solukhumbu 0.502 Dhading 0.461 Baglung 0.478 Udayapur 0.475 Sangkhuwasabha 0.488 Rasuwa 0.461 Bhojpur 0.479 Makawanpur 0.497 Khotang 0.494 Gulmi 0.464 Sarlahi 0.402 Nawalparasi 0.493 Sindhupalchok 0.455 Sunsari 0.496 Pyuthan 0.413 Kanchanpur 0.475 Nuwakot 0.466 Syangja 0.527 Dadeldhura 0.442 Ramechhap 0.468 Rupandehi 0.498 Panchthar 0.498 Dhanusha 0.431 Rautahat 0.386 Mahottari 0.388 Dhankuta 0.517 0.520 Parbat 0.510 Okhaldhunga 0.468 Arghakhanchi 0.482 Terhathum 0.527 Legend HDI Values 0.364 - 0.400 0.401 - 0.449 0.455 - 0.499 0.500 - 0.549 0.551 - 0.632 0 50 100 Kilometers Kavrepalanchok Kathmandu Lalitpur 0.632 0.601 Bhaktapur 0.573
over the last decade, across all ecological and development regions as well as districts.
Among the ecological regions, the Hills continue to lead with an HDI score of 0.569, followed by the Tarai at 0.521, a pat-tern seen in 2001 as well as 2006. The pace of HDI improvement has been faster in the Mountains, from 0.436 in 2006 to 0.496 in 2011. In spite of its relatively low HDI score, the Mid Western development region has made some gains, from 0.452 in 2006 to
0.503 in 2011, although considerable catch-ing up remains.
Among the 15 eco-development regions, the Central Hills, including the Kathmandu Valley, has the highest HDI value at 0.612, followed by the Western Mountains at 0.572 and the Western Hills at 0.567. The Mid Western Mountains re-gion has the lowest HDI rank at 0.445, a pattern that has remained constant over the years (map 2.4).
Highest Lowest
2001 2011 2001 2011
Kathmandu (0.652) Kathmandu (0.632) Mugu (0.304) Bajura (0.364) Bhaktapur (0.595) Lalitpur (0.601) Bajura (0.310) Bajhang (0.365) Kaski (0.593) Kaski (0.576) Kalikot (0.322) Kalikot (0.374) Lalitpur (0.588) Bhaktapur (0.573) Bajhang (0.331) Humla (0.376) TABLE 2.2
Districts with the highest and lowest HDI scores, 2001 and 2011
MAP 2.4
HDI values across the15 eco-development regions, 2001, 2006 and 2011
Source: UNDP Nepal, 2004 and 2009, annex 4, table A4.1.
** 2006 data is for 13 domains following the Nepal Demographic Health Survey Dataset. The combined value for Western Mountains has been used for Western, Mid Western and Far Western Mountains also.
0.347 0.435 0.445 0.489 0.549 0.567 0.417 0.448 0.492 0.5 0.543 0.553 0.547 0.602 0.612 0.477 0.519 0.55 0.451 0.478 0.502 0.355 0.435 0.45 0.44 0.481 0.529 0.491 0.519 0.536 0.403 0.443 0.474 0.425 0.454 0.518 0.488 0.435 0.572 0.494 0.468 0.532 0.45 0.503 0.518 Legend HDI 2006 ** HDI 2001 HDI 2011 0 50 100 Kilometers
Far Western Mountains
Far Western Hills Far Western Tarai
Mid Western Mountains
Mid Western Hills
Mid Western Tarai
Western Mountains Western Hills Western Tarai Central Mountains Central Hills Central Tarai Eastern Mountains Eastern Hills Eastern Tarai
District level comparisons over time can be made by computing the HDI based on the arithmetic mean (table 2.2). The four highest HDI districts in 2001 are also the highest in 2011, with some changes in ranks. Rupandehi, fifth in 2001, was replaced by Manang in 2011. Kathmandu and Kaski have retained the first and third places, while Bhaktapur, which used to be second, is now fourth and Lalitpur has moved from fourth to second. Three of the five lowest HDI dis-tricts, Bajura, Bajhang and Kalikot, are the same in 2001 and 2011. Humla and Achham replace Mugu and Jajarkot in 2011 among the districts with the lowest scores. The huge progress made by Mugu in education has helped improve its HDI ranking.
Between 2001 and 2011, the most significant improvements in HDI ranks are for Dang, up 28 positions; Khotang, up 20; Rasuwa, up 17; and Solukhumbu and Taplejung, up 12 positions each. This has been primarily a result of considerable prog-ress in income. For Rasuwa, a jump in the mean years of schooling has contributed to the improvement. Examples of considerable slippage include Sindhuli, down 18 positions; Rupandehi, down 16; Udaypur, down 15; and Rautahat and Baglung down 14 (table 2.3). Districts maintaining the same posi-tions include Kathmandu, Kaski, Syangja, Parbat, Sankhuwasabha, Bhojpur, Kailali and Kalikot.
Similar to earlier trends, the urban HDI value in 2011, at 0.630, remains higher than the rural HDI score, at 0.517. But there is noticeable improvement in the rural HDI
since 2006. The urban HDI value, by contrast, remained constant in 2011 compared to 2006. This underlines the issue of sustainability in HDI improvements. Remarkably, the differ-ence in life expectancy between rural and ur-ban areas has narrowed considerably.
HDI values by caste and ethnicity
For 2011, HDI geometric mean values by caste and ethnicity are based on both Census and Nepal Living Standards Survey informa-tion. The population weights of various castes and ethnic groups have been derived from the 2011 Census; per capita income data by caste and ethnic groups are calculated from the 2011 survey (figure 2.4).
Inequalities in human development by caste and ethnicity have been noted since the first Nepal Human Development Report in 1998. These remain pronounced, despite some evidence that they may be reducing over time.
Among the four major caste and ethnic clusters—the Brahmans/Chhetris, the Janajatis, the Dalits and the Muslims—the Brahmans/ Chhetris rank at the top with an HDI value of
District Position 2001 District Position 2011
Dang ↑ 28 Sinduli ↓ 18 Khotang ↑ 20 Rupandehi ↓ 16 Rasuwa ↑ 17 Udaypur ↓ 15 Solukhumbu ↑ 12 Rautahat ↓ 14 Taplejung ↑ 12 Baglung ↓ 14
Source: UNDP Nepal 2004, annex 4, table A4.1.
TABLE 2.3
Districts with the highest positional changes in HDI status
FIGURE 2.4
HDI values by major caste and ethnic groups, 2011
Source: Annex 4, table A4.5.
All Brahman/Chhetri
Hill Brahman Hill Chhetri Madhesi Brahman/Chhetri
Madhesi Other Castes All Dalits
Hill Dalit Madhesi Dalit
Newar All Janajatis excluding Newar
Hill Janajati Tarai Janajati
Muslim/Musalman All Hill/Mountain Groups All Tarai/Madhesi Groups Others 0.538 0.557 0.507 0.536 0.460 0.434 0.446 0.400 0.565 0.482 0.509 0.473 0.422 0.511 0.454 0.586