Dynamic Power Management:
Adjusting Data Center Capacity in Real-Time
operation & capital efficiency
equipment (server, storage & networking equipment)
data center design & construction (power distribution & transformation, cooling-systems, configu-ration, and energy sources, etc.).
The project also identified member organizations that have retrofitted existing data centers and/or built new ones where some or all of these practices and technologies are being incorporated into their designs, construction and operations.
About The Silicon Valley Leadership Group (SVLG)
The SVLG comprises principal officers and senior managers of member companies who work with local, regional, state, and federal government officials to address major public policy issues affecting the economic health and quality of life in Silicon Valley. The Leadership Group’s vision is to ensure the economic health and a high quality of life in Silicon Valley for its entire community by advocating for adequate affordable housing, comprehensive regional transportation, reliable energy, a quality K-12 and higher education sys-tem, a prepared workforce, a sustainable environment, affordable and available health care, and business and tax policies that keep California and Silicon Valley competitive.
Silicon Valley Leadership Group 224 Airport Parkway, Suite 620 San Jose, CA 95110
408-501-7862 svlg.net
| 1
The application utilization for larger server farms in today’s data centers is typically highly volatile due to many factors. Time of day usage patterns, promotions and advertisements, and unexpected events all cause spikes in demand, both planned and unplanned. As a result, data center operators have to deal with a high level of uncertainty when planning capacity. They mitigate the risk of a service outage by over-provisioning equipment and keeping their entire pool of servers “always on”. The result is an average utilization below 20% with occasional peaks of 85-90%.
Based on a case study performed at last year’s SVLG Chill-Off, such low average utilization re-sults in estimated waste of over 50% in server power consumption.
This case study will use Dynamic Power Manage-ment to correlate real application load with actual server capacity, adjusting this capacity in real-time to support real-life, highly volatile usage patterns. The result will confirm our estimated savings while demonstrating ways to move a data center from “always on” to a new, “always avail-able” model without impacting customer service levels.
Project Case
Cytak, a leading sales and use tax SaaS provider, submitted a Request for Information (RFI) to Power Assure to provide recommendations and
perform a case study in preparation for its future LEED certified data center setup. The questions presented to Power Assure were:
What capacity increase can we expect from a
♦
hardware refresh?
What savings can we achieve from converting to
♦
an always-available model using Dynamic Power Management?
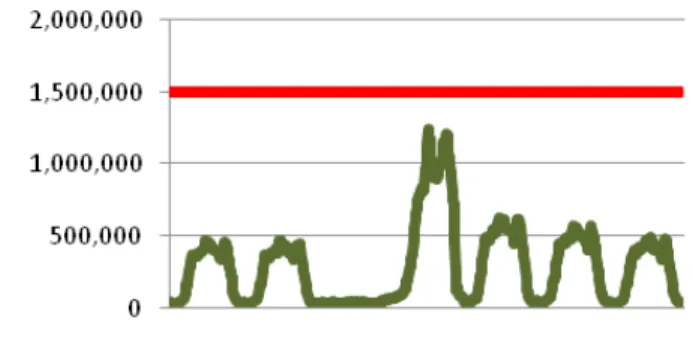
Cytak provided us with some test data for the case study. Application loading from 11/25/2008 until 12/1/2008 – a unique retail weekend – was used to perform the tests for this case study. The application load is very low during the 3rd day (Thanksgiving) and much higher than normal during Black Friday, a peak shopping day. The average load is 19.83% with a peak of 83% on a total capacity of 1,500,000 transactions. The load represents average number of transactions during a 15 minute interval.
Dynamic Power Management:
Adjusting Data Center Capacity in
Real-Time
dual core AMD 2xxxHE CPUs. Power Assure cer-tified the idle power consumption for these servers at 269W and fully loaded consumption at 347W, in conjunction with UL
Based on a per 208V/20A circuit charge of $600, the annual cost for 200 racks (20 servers per rack) should be $2,880,000. The assumption is that cir-cuits cannot be loaded more than 80% or 16A. This setup raised an immediate red flag as under full load the power consumption of the rack would exceed the 16A limit on each circuit by close to 1A
if balanced properly. Although this only happens at near full load, Cytak considered it acceptable as it is not close enough to the absolute limit of 20A Cytak requested for off-the-shelf, low cost server comparison.
Hardware Refresh
Power Assure selected an off-the-shelf Supermicro server for the hardware refresh comparison. The server uses two quad-core L5518 low-power-con-suming Nehalem processors. This server consumes 132W idle and 217W loaded which is approxi-mately double the efficiency of the original dual core server. The power consumption allows 32 servers per rack on two circuits for a total capacity increase of 366%.
Power Assure further tested a custom-made Dell server with dual quad core L5420 processors. The server has a similar performance but power consumption was significantly lower. This server consumes 83W idle and 157W under full load. This allows 42 servers per rack to result in a total capac-ity increase of 470%.
Based on these results, Power Assure recommended Cytak including power measurements into their Figure 2: Power consumption, always-on model.
2009 CAsE sTuDy | 3
procurement cycle to minimize power consumption for a given performance target. Efficiency certifica-tions can be provided by Power Assure and Under-writers Laboratories as an independent verification.
Dynamic Power Management
Power Assure set up a demonstration environment with 40 servers to simulate the load and savings op-portunities with its Dynamic Power Management technology. Based on the load provided by Cytak, Power Assure made adjustments for their simulation environment. This resulted in a total of over 2100 set points for a total of 31 hours. The first task was
to find out the power consumption of the always-on model with all servers running and load influencing idle/loaded power consumption.
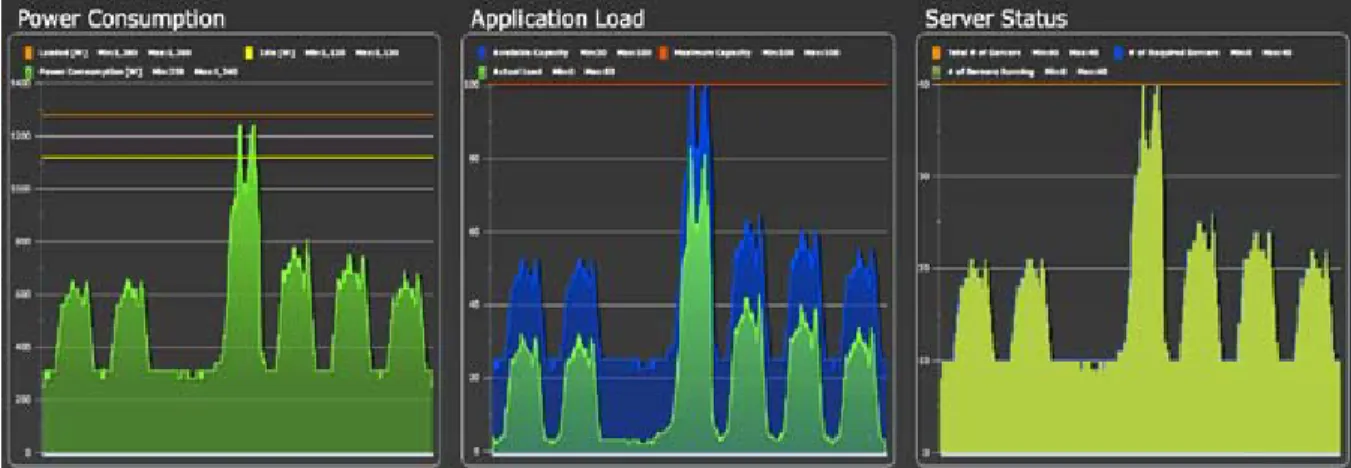
Among three charts for “Always on” (Figure 1), the chart in the left shows power consumption, the middle chart shows the loadand the right chart depicts the number of servers running. The blue background in the middle chart represents available capacity based on the number of running servers.
As all servers are running, the available capacity is 100% all the time.
The power consumption stays nicely between the idle and loaded boundaries and goes up and down based on the load.
The total power consumption for the 31 hour run in always-on mode was 39.63 kWh.
With the “Always Available” model, the number of servers that run at any given time is calculated based on the actual load (transactions/sec) plus a safety buffer. The remaining servers are shut down and turned off until they are needed. Power Assure uses a 1 minute interval in its dynamic power
manage-ment technology to verify load and calculate the amount of servers needed to support it using Power Assure’s patent pending calculation engine. The buf-fer was set to 20% to have enough capacity available to support the spikes on Black Friday.
Among the three charts are for “Always available” (Figure 2), the middle chart shows application load as before but the available capacity now depends on the number of running servers. The buffer was adjusted so that the capacity represented in blue is Figure 3: Power consumption, always available model.
of servers running, which became variable. The power consumption shown in the left has a much higher fluctuation and stays most of the time below the yellow idle line.
The total power consumption for the 31 hour run in always available was 17.12 kWh.
This represents savings of 56.79% over the always-on model while supporting unusual low power consumption as well as rapid spikes.
Project Details
Power Assure used 40 servers, connected to two smart power strips from Raritan. The strips provided power at the outlet level and allow remote turn on/ off of each outlet through SNMP. Both power strips were connected to a Starline Busway and the line was monitored using a PowerLogic PM810 to col-lect V, A, W, PF and kWh information. The setup used 110V circuits.
Application load was put on the servers through websites that run OpenSUSE 11 with Apache/PHP web services. Load was generated from the website by intensive calculations performed based on the hits received. The Always-On power consump-tion chart shows the power consumpconsump-tion increase/ decrease as load goes up and down. Numbers were validated against the initial reference measurements and fall nicely between idle and loaded limits. This made sure that the expected load was actually sup-ported by the servers.
Power Assure ran multiple tests in Always-Available mode using different buffer settings.
About Power Assure
Power Assure develops and delivers data center management services that help customers to reduce energy use and carbon emissions in commer-cial, corporate, and government data centers. The company’s software platform intelligently manages data center capacity in real time, while maintaining required service levels at optimum efficiency and lowest energy cost.
About Cytak
Cytak provides automatic distribution of sales and use tax rates, sales tax calculation services and veri-fication tools to analyze tax liabiities. It provides tax integration for online stores, ERP and accounting packages, including but not limited to: MFG/PRO (QAD), Microsoft Dynamics, Quickbooks.
2009 CAsE sTuDy | 5