Research Article
SIMULTANEOUS AND ACCURATE DETERMINATION OF VITAMINS B
1, B
6, B
12AND ALPHA
LIPOIC ACID IN MULTIVITAMIN CAPSULE BY REVERSE
–
PHASE HIGH PERFORMANCE LIQUID
CHROMATOGRAPHIC METHOD
S.POONGOTHAI,
1,*, R.ILAVARASAN
2, C.M.KARRUNAKARAN
3Research Scholar, Department of Biotechnology, Bharath University, Chennai600 073, India, Assistant Director, Captain Srinivasa
Murthi Drug Research Institute for Ayurvedha and Siddha, Chennai600 106, India, Professor and Head, Department of Biotechnology,
Bharath University, Selaiyur, Chennai600 073, India. Email: [email protected]
Received: 08 July 2010, Revised and Accepted: 12 August 2010
ABSTRACT
A simple, precise, rapid and selective reverse phase high performance liquid chromatographic (RP‐HPLC) method has been developed and validated for the simultaneous determination of Benfotiamine (B1) 100 mg, Pyridoxine hydrochloride (B6) 100 mg, Mecobalamin (B12) 1000 mcg and Alpha–
lipoic acid 100 mg in multivitamin capsules. The method uses X‐Terra reverse phase (RP‐18, 250 x 4.6 mm, 5 µm) column and gradient elution. The aqueous mobile phase contained 0.05 M phosphate buffer adjusted to pH 2.5 and acetonitrile. Separation and quantification was achieved by changing the proportion of the system linearly with a time‐schedule programme. Detection was carried out in the range of 200 to 600 nm using photodiode array detector and set at 320 nm and further analysis was carried out using a UV detector. This method has been validated and found to be applicable in routine analysis for multivitamin capsules. The precision is exemplified by relative standard deviations of 1.1% for benfotiamine, 0.9% for pyridoxine hydrochloride, 0.7% for mecobalamin and 1.2% for Alpha‐lipoic acid. Good linearity was observed between the concentration of the analytes and peak area with correlation coefficients (R2) of 0.9997, 0.9990, 0.9995, and 0.9998 respectively. Mean recoveries obtained during spiking experiments were in the range of 99.8‐100.2.
Keywords: RP‐HPLC, Vitamin B1, B6, B12 and Alpha‐lipoic acid, UV detection, Validation.
INTRODUCTION
Vitamins are an essential group of food ingredients which have to be supplied in sufficient amounts with diet, vitamins are broad group of organic compounds that are minor, but essential constituents of food required for normal growth, self‐maintenance and functioning of human and animal bodies. Mainly B complex vitamins play different specific and vital functions in metabolism and their lack or excess produces specific diseases. The B abitaminosis are usually attributed to nutritional deficiency, competition between bacteria, distur‐ bances of the intestinal flora and excessive exposure to sunrays. Multivitamin capsules regularly used in therapeutic management, in improper dietary feeding and for strengthening purpose. This has stimulated research on accurate and efficient analytical methods for the determination of vitamins which is problematic because of their instability and the complexity of the matrices in which they are usually analysed1‐3.
The standard4 and official analytical methods5, which are tedious,
sometimes non‐specific and time consuming, involve pre‐treatment of the sample through complex chemical, physical, or biological reactions to eliminate the interferences commonly found, followed by individual methods for each different vitamin. These methods include spectrophotometric, polarographic, fluorimetric, enzymatic, and microbiological procedures.
For the determination of the compounds in single and multi‐ component mixtures the number of papers is more restricted. They include, among others, the determination of B1 and B6 in
pharmaceutical preparation by ratio spectra derivative spectro‐ photometry and HPLC6, electrothermal atomic absorption
spectrometric methods7, and capillary electrophoresis8‐10. Among
them the techniques most widely used are chromatographic methods and in particular, HPLC which provides rapid, sensitive and accurate methods for vitamin determination and have the advantages of solvent economy, easy coupling with other techniques, and that small amounts of sample required for analysis. Individual vitamins can be chromatographed isocratically as well as certain combinations of two or three vitamins; the simultaneous chromatography of more complicated mixtures may require a gradient elution program. Determinations can be carried out, among others by normal‐phase11, ion pairing12, chromatography, liquid‐
phase chromatography with narrow bore column13, HPLC after
solid‐phase extraction14‐15, counter current16, reverse phase17‐20
being the most common method. Most methods are successful in single component preparations. Other chromatographic systems separate B1, B6, and B12 when they exist in the same range21 but
hindered when the amount of B1 and B6 exceeds by a hundred or
even thousand times the amount of B12 present in the complex. Most
of the published methods involve the use of several detection methods that includes electrochemical22 or UV‐Visible absorbance
with a single or variable wavelength or photodiode array23. The
proposed method is very simple, rapid, and validated according to ICH guidelines.
In the present work, a simultaneous determination of B‐complex vitamins (B1, B6, and B12) and Alpha‐lipoic acid in multivitamin
capsule is proposed using a simple gradient program by setting the wavelength at 320 nm. Also the chromatographic system developed clearly separates the four analytes from their degradation products and this makes the presented method advantageous with respect to the existing literature.
MATERIALS AND METHODS
Instrument
A Waters Alliance series 2690 HPLC separation module equipped with two reciprocating pumps, a Waters series auto‐sampler with an effective volume 100 µl and a Waters series 996 photo diode array detector with a dual beam of variable wavelength system was used for scanning the sample. A Waters Alliance series 2690 HPLC equipped with two reciprocating pumps, a Waters series auto‐ sampler with an effective volume 100 µl and a Waters series 2487 spectrophotometric detector with a dual beam variable wavelength system was used for regular analysis of samples. The chromatographic peaks were recorded and elaborated automatically by employing computerized Waters program ‘Millennium 32’.
Reagents and materials
All the chemicals and solvents were HPLC grade and were employed as supplied by the manufacturers without further purification was used in all procedures. Highly purified water obtained through a Milli‐Q water purification system (Millipore‐Q Elix 3 model, USA), acetonitrile was ‘gradient grade for liquid chromatography’ purchased from Ranbaxy Chemical Company and monobasic potassium phosphate was HPLC grade purchased from Merck
134 Company. Highly purified working standards Benfotiamine (B1 with
purity 97.8%)‐Sami Labs, Pyridoxine Hydrochloride (B6 with purity
98.8%)‐Madras Pharmaceuticals, Mecobalamin (B12 with purity
92.6%)‐Biocon Ltd, and Alpha‐lipoic acid (purity 99.6%)‐Biocon Ltd, The analyzed samples (Benfage Fort Capsules) were placebo capsules containing 100, 100, 1 and 100 mg of B1, B6, B12 and Alpha‐
lipoic acid per capsule respectively.
Preparation of mobile phase
The gradient elution system started with a aqueous 0.05 M monobasic potassium phosphate buffer adjusted to pH 2.5 with dilute ortho phosphoric acid solution (Solvent A), for 5 minutes. Then it was changed linearly for another 15 minutes to a binary
mobile phase of Solvent A: Solvent B acetonitrile (30:70 v/v), afterwards the initial system was returned linearly for five minutes. The mobile phase was degassed by filtering through a Milli‐Q 0.45 µm pore membrane filter.
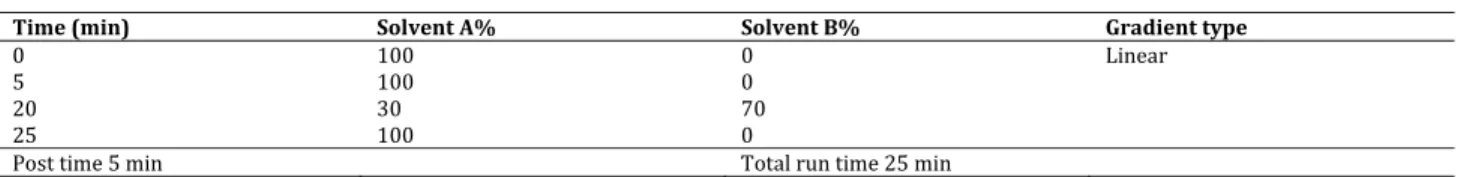
These conditions were chosen in terms of peak shape, column efficiency, chromatographic analysis time, selectivity and resolution. Several gradient programmes were tried to separate all the four analytes. The gradient started with high % of buffer content to elute out the very polar pyridoxine hydrochloride, followed by a gradual increase of organic modifier to elute other low polar components. After several attempts the following gradient elution program for proposed method is illustrated in Table 1.
Table 1: Gradient elution programme for the simultaneous determination of vitamins B1, B6, B12 and Alphalipoic acid
Time (min) Solvent A% Solvent B% Gradient type
0 100 0 Linear 5 100 0 20 30 70 25 100 0 Post time 5 min Total run time 25 min Chromatographic conditions
A Reverse phase X‐Terra column RP‐18 was a 250X4.6 mm id., 5 µm particle size and end capped to minimize unreacted silanol effects. After sample preparation immediately transferred in an amber vial and kept at stable temperature, 20°C. The wavelength was set at 320 nm to separate all the four analytes in a single injection. The flow rate was 1.5 ml/min and the volume injected was 20 µl.
PROCEDURE
Preparation of standard solutions
(Diluents: Mixture of pH 2.5 phosphate buffer and aetonitrile in the ratio of 50:50 (v/v) was prepared and used as diluent). The same proportion of all the vitamins as those in pharmaceutical formulation investigated, stock and standard solutions of all the compounds were prepared every day freshly in diluent respectively, by accurately weighing and dissolving all vitamins. A separate stock solution of vitamin B12 was prepared because of the
difference between the level of this vitamin and the others in the pharmaceutical formulation.
Vitamin B12 standard stock solution
About 10 mg of Mecobalamin (B12) working standard was weighed
accurately and transferred into a 50 ml amber volumetric flask, dissolved and diluted up to the mark with diluent.
Mixed standard solution
About 100 mg each of Benfotiamine (B1), Pyridoxine
hydrochloride (B6) and Alpha‐lipoic acid working standard was
weighed accurately and transferred into 100 ml amber colored volumetric flask. A portion of diluent and 5.0 ml of Mecobalamin (B12) stock solution was added and sonicated for 5 minutes. The
volume was made upto 100 ml with diluent and the solution was filtered through 0.45 µ membrane filter.
Sample preparation
Not less than 20 capsules were weighed accurately to determine the average fill weight. The capsule contents were emptied from the shell and mixed well. The shell weight was taken to deduce the average weight of each capsule. A portion of powder equivalent to average fill weight of one capsule was quantitatively transferred into 100 ml amber colored volumetric flask. About 80 ml of diluent was added and sonicated for 15 minutes and the solution was diluted to volume with diluent, mixed well and left to precipitate. The sample solution was then filtered through 0.45 µm membrane filter.
RESULTS AND DISCUSSION
Method development
During method development it became obvious that different work up procedures have to be used for determination of four components due to differences in solubility and stability. So diluent 0.05 M monobasic potassium phosphate buffer adjusted to pH 2.5 and acetonitrile in the ratio 50:50 was selected for dissolving all the four components. A solution of each single vitamin was injected separately into the chromatograph in order to determine the degree of resolution of its components.
The selectivity of a chromatographic separation is described by the combined affinities that the mobile phase and stationary phase exert on the sample components. A reliable chromatographic assay also requires acceptable resolution, reasonable retention times and good peak symmetry. As a consequence in the preliminary studies the optimum chromatographic conditions were investigated in isocratic and gradient elution systems. Similarly different proportions of acetonitrile in the mobile phase exerted a striking change in the K’ values of mecobalamin whereas the peak behaviour of Pyridoxine HCl, Benfotiamine and Alpha‐lipoic acid remain unaffected. The profile of a gradient elution system affects the retention of solutes in a similar way to the proportions of the solvent with greater elution strength in a binary mobile phase under isocratic conditions. Under isocratic conditions, the bandwidths regularly increase as the retention time increases for all sample compounds. In contrast an advantage of gradient elution is that the bandwidths can be approximately constant both for early and later elution analytes. Therefore a binary gradient elution system was developed with a beneficial effect on the sensitivity of mecobalamin, which exists 1000‐fold less in the B‐complex and a single wavelength was fixed to detect all the four components.
A standard mixture of vitamins was then analyzed as a mixture and chromatographic conditions were optimized to maximize peak resolution. Elution of the vitamins from the column was in order of decreasing polarity of the mobile phase used: as the proportion of acetonitrile increased the retention times for the studied vitamins decreased and some of them eluted with solvent front. The greater the proportion of proportions of phosphate buffer, the better peak shapes and resolution of the studied vitamins.
The separation pattern of the vitamins B1 showed at tR–10.8 min, B6
showed at–2.3 min, B12 showed at–12.2 min and Alpha‐lipoic acid
at–17.0 min. The retention time of the B‐complex vitamin was reproducible over a period of month, which makes the method most suitable for routine analysis. The peak asymmetry (T) and theoretical plate counts of all the four components were very close to the ideal value 1.2 and not less than 2000 respectively. The
135 resolution factors Rs, between the chromatographic peaks, were
calculated from the equation Rs = 2(t2‐t1)/(W1+W2), where t2, t1 are
the retention time of the two components and W1, W2 are the peak
width at the base of the two respective peaks, obtained by
extrapolation of the relatively straight sides to the baseline. A representative chromatogram together with other observed system suitability chromatographic parameters are illustrated in Fig.1 and Table 2.
Fig. 1: Typical standard chromatogram for all the four components
Table 2: High performance liquid chromatographic system suitability parameters of the drug separation using the gradient elution system
Active ingredients System suitability parameters
Retention time tR (min) Tailing factor Theoretical plate count Resolution factor Rf
Benfotiamine 10.79 0.8 35270 47.8
Pyridoxine HCl 2.27 1.1 9998 1.0
Mecobalamin 12.19 1.2 105347 6.7
Alpha‐lipoic acid 17.04 1.1 221827 32.3
Mecobalamin exists in small concentration compared to the other vitamins and absorbs poorly above 230 nm; it was not visualized. This particular problem was overcome by working at 320 nm where all the four components showed their maximum absorbance. In order to test the applicability of this procedure to a commercial vitamin formulation, ‘Benfage Forte’ was chormatographed and it was shown in Fig. 2. Integration of separated peak area was done
with the integrator or the computer programme and each vitamin was determined by using the peak area‐concentration relationship obtained in the standardization step. The sample peaks were identified by comparing both the relative retention times and the UV‐Vis spectrum of each one with those of the standard reference vitamins. The protocol affords reproducible quantification of the different vitamins with error less than 10%, which is the standard level in any pharmaceutical quality control.
Fig. 2: Typical sample chromatogram for the separation of four components from capsule
Method validation
Validation of the analytical method is the process that establishes by laboratory studies in which the performance characteristics of the method meet the requirements for the intended analytical application. Methods need to be validated or revalidated before their introduction into routine life. The validity of a specific method should be demonstrated in laboratory experiments using samples or standards that are similar to the unknown samples analyzed in the routine. The preparation and execution should follow a validation protocol. This method has been validated with respect to precision, linear range, accuracy, specificity and robustness.
Precision
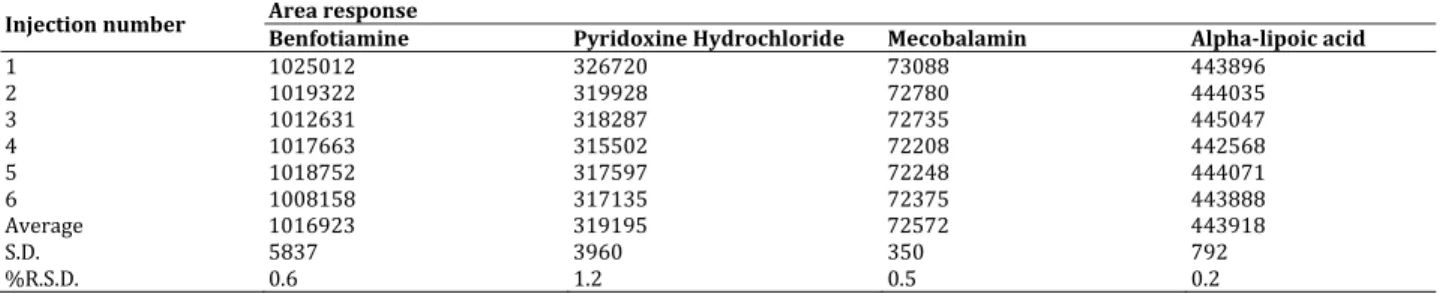
System precision
Six replicate standard solutions of Benfotiamine, Pyridoxine Hydrochloride, Mecobalamin and Alpha‐lipoic acid were injected
into the HPLC system. The area response along with % relative standard deviation (RSD) is tabulated in Table 3a and the % RSD observed on the replicate injection indicates the acceptable reproducibility and thereby the precision of the system.
Method precision
Method precision was determined by measuring repeatability and ruggedness (intermediate precision (between‐day precision or time‐ different intermediate precision)) for each vitamin during 3 days at the same concentration levels. The variation coefficients varied from 0.7 to 1.2%.
Repeatability
Complete analysis was performed in replicate on all samples to allow the calculation of average deviations as a measurement of chromatographic reproducibility. There was one good agreement with the fact that vitamin amounts added by the manufacturers
136 were usually slightly higher than the label claim, e.g., accounting
for a decomposition of vitamins (e.g., Mecobalamin) during tablet storage. Considering an inhomogeneity of the vitamin content of unknown magnitude due to capsule formulation, the precision of the methods is even greater. A good agreement between the concentration values of the reference samples and the amount of vitamins found after analysis has been obtained with the proposed method and also the relative standard
deviations obtained in the analysis of vitamins was summarized in Table 3.
Ruggedness
The ruggedness of the method was demonstrated by the analysis of the samples by two different analysts using two different sets of instruments. RSD of the two sets of data indicated the ruggedness of the method which was shown in Table 4.
Table 3 a.: System precision
Injection number AreaBenfotiamine response Pyridoxine Hydrochloride Mecobalamin Alphalipoic acid
1 1025012 326720 73088 443896 2 1019322 319928 72780 444035 3 1012631 318287 72735 445047 4 1017663 315502 72208 442568 5 1018752 317597 72248 444071 6 1008158 317135 72375 443888 Average 1016923 319195 72572 443918 S.D. 5837 3960 350 792 %R.S.D. 0.6 1.2 0.5 0.2
Table 3 b.: Quantification of active components in multivitamin capsule
Vitamin Vitamin content (mg) SD RSD (%) Recovery (%)*
Benfotiamine 100 1.2 1.3 99.1 Pyridoxine HCl 100 0.9 0.9 98.0 Mecobalamin 1 1.5 1.1 136.1 Alpha‐lipoic acid 100 0.8 0.8 103.9 *Complete analysis was performed in replicate.
Table 4: Ruggedness of the method
Vitamin Vitamin content (mg) SD RSD (%) Recovery (%)*
Benfotiamine 100 0.9 0.9 98.2 Pyridoxine HCl 100 1.1 1.1 98.4 Mecobalamin 1 0.9 0.7 137.1 Alpha‐lipoic acid 100 1.2 1.2 103.7 * Complete analysis was performed in replicate Robustness The robustness of an analytical method is a measure of its capacity to remain unaffected by small but deliberate variations in method parameters and provides an indication of its reliability during normal usage. The variations may be variation in flow rates by ± 2nm, variation in pH by ± 0.2 units. The observed results were lie within the limit.
Linear range
Linearity was obtained in the range of standard concentration of each vitamin was shown in Table 5. A series of eleven solutions at
low and high concentration levels (from 50 to 150% of the nominal concentration levels) were prepared, each solution was injected three times and the regression was calculated by the method of least‐squares. Peak areas were calculated and the results interpolated on the calibration graph for each vitamin. It could be shown that the correlation is linear over a wide range covering all common capsule weights and vitamin contents.
Thus, possible volume errors resulting from different amounts of capsule material added to the homogenization vessel are negligible.
Table 5: Linearity of the chromatographic system
Vitamin Linear range (µg ml1) R2 Intercept Slope
Benfotiamine 489.9‐1469.6 0.9997 ‐9114 1039 Pyridoxine HCl 499.4‐1498.1 0.9990 13919 274 Mecobalamin 4.6‐13.9 0.9995 957 7679 Alpha‐lipoic acid 497.7‐1469.6 0.9998 ‐5431 432 Accuracy
The accuracy of the described procedure was assessed by adding known amounts of standard vitamins equal to one dosage form, to a powdered placebo capsules prior to analysis in the presence of maize starch, PVP, talc, magnesium stearate, eudragit E, aluminium hydroxide and sucrose. The recovery data was determined by comparing the areas obtained with that of standard solution
analyzed according to the method. The results of the quantitation of Benfotiamine (B1), Pyridoxine hydrochloride (B6), Mecobalamin
(B12) and Alpha‐lipoic acid, 100, 100, 1, 100 mg/capsule
respectively, in multivitamin placebo capsules were shown in the Table 6. The accuracy was carried out at 80%, 100%, and 120% of specification limit. These were in good agreement with the added amount and the recovery of the compounds from each dosage form was quantitative.
137
Table 6: Recovery study for the determination of placebo multivitamin capsules by adding 100 mg/capsule for vitamins B1, B6, Alpha
lipoic acid and 0.1 mg/capsule for B12 80%, 100% and 120% accuracy level.
S.No Benfotiamine Pyridoxine HCl Mecobalamin Alphalipoic Acid
Found mg/cap Recovery % Found mg/cap Recovery % Found mg/cap Recovery % Found mg/cap Recovery % Accuracy Level 80% 1 81.09 100.6 79.67 99.5 0.84 100.0 80.64 99.7 2 80.45 100.8 79.20 98.4 0.83 101.2 84.04 101.3 3 78.72 99.9 80.49 98.7 0.81 98.8 79.50 99.0 Mean 100.4 98.9 100.0 100.0 S.D. 0.5 0.6 1.2 1.2 % RSD 0.5 0.6 1.2 1.2 Accuracy Level 100% 1 96.22 99.1 97.07 98.8 0.97 99.0 102.23 100.2 2 96.21 98.8 101.76 101.4 0.98 101.0 104.31 100.0 3 97.38 99.4 100.37 100.9 0.99 99.0 100.38 99.2 Mean 99.1 100.4 99.7 99.8 S.D. 0.3 1.4 1.2 0.5 % RSD 0.3 1.4 1.2 0.5 Accuracy Level 120% 1 114.44 99.5 119.55 100.1 1.19 100.8 123.42 101.1 2 117.67 99.8 120.98 101.3 1.20 98.4 121.67 100.6 3 119.36 100.7 120.34 100.6 1.21 101.7 120.67 100.8 Mean 100.0 100.7 100.3 100.8 S.D. 0.6 0.6 1.7 0.3 % RSD 0.6 0.6 1.7 0.3 Specificity The specificity of the present method was described by peak purity testing in which it compares the spectra within a peak to the peak apex spectrum to determine if the peak consists of one or more spectrally distinct component. It calculates a spectral contrast angle (purity angle) and a threshold angle (purity threshold) for each spectral comparison between the reference spectrum and the other
peak spectra. Purity angle should be less than the purity threshold for each component and there was no purity flag indicates that the excipients present in the dosage forms did not interfere with the analysis (no noticeable interference from the excipients was observed in the chromatograms) and a representative chromatogram together with other observed purity parameters are illustrated in Figs. 3 and 4 and Table 7.
Fig. 3: Typical placebo chromatogram for recovery study
Table 7: Observed peak purity parameters of each component in multivitamin capsules
Vitamin Purity angle Purity threshold Purity flag *
Benfotiamine 0.079 1.037 No Pyridoxine HCl 0.285 2.332 No Mecobalamin 0.241 1.184 No Alpha‐lipoic acid 0.078 1.056 No * No purity flag indicates that there is no interference with the main peak by the excipients and hence peak purity passes for all the four components (Limit: Purity angle should be less than the purity threshold)
138
Fig. 4: Typical chromatogram for the purity determination of all the four components
CONCLUSION
In the preceding method for determination of vitamin B1, B6, B12 and
Alpha‐lipoic acid levels in capsule, use of an XTerra column RP‐18 and a gradient elution mode was applied. This method is successful for vitamin B1, B6, B12 and Alpha‐lipoic acid formulations even in the
ratio between B12 and the others 1:100 or 1:1000. Isocratic
conditions could not be used mainly because the chromatographic peaks are not well resolved. The method is simple, specific and rapid with a high degree of accuracy and precision and applied successfully to the routine analysis of B1, B6, B12 and Alpha‐ lipoic
acid in B‐complex capsules. The simplicity of the procedure should make it highly desirable for quality control of multi‐vitamin products in the pharmaceutical and health food industries.
REFERENCES
1. William Martindale. James E.F. Reynolds, editor. Martindale: The Extra Pharmacopoeia. 31st ed. London: Royal Pharmaceutical Society; 1997.
2. Eitenmiller RR, Lin Ye, Landen WO. Vitamin Analysis for the Health and Food Sciences. Boca Raton: CRC Press; 1999. 3. American Medical Association (AMA) Drug Evaluations. 5th ed.
AMA Division of Drugs in cooperation with the American Society for Clinical Pharmacology and Therapeutics; Chicago: 1983.
4. Strohecker R, Henning HM. Vitamin Assay Tested Methods. Verlag Chemie. Limburg. 1965.
5. The United States Pharmacopoeia, 24th Revision, U.S.Pharmacopoeial Convention, Inc., Rockville, MD: 2004. 6. Markopoulou CK, Kagkadis KA, Koundourellis JE. An
optimized method for the simultaneous determination of vitamins B1, B6, and B12 in multivitamin tablets by high
performance liquid chromatography. J. Pharm. Biomed. Anal 2002; 30: 1403‐1410.
7. Official Methods of Analysis (OMA). 13th ed. Association of Official Analytical Chemists; Washington DC: 1980.
8. Dinelli G, Bonetti A. Micellar electro kinetic capillary chromatography analysis of water‐soluble vitamins and multi‐ vitamin integrators. Electroph 1994; 15: 1147‐1150.
9. Lambert D, Adjalla C, Felden F, Benhayoun S, Nicholas JP, Gueant JL. Identification of vitamin B12 and analogues by high‐
performance capillary electrophoresis and comparison with high‐performance liquid chromatography. J. Chromatogr 1992; 608: 311‐315.
10. Fotsing L, Fillet M, Bechet I, Ph Hubert, Crommen JJ. Determination of six water‐soluble vitamins in a pharmaceutical formulation by capillary electrophoresis. Pharm. Biomed. Anal 1997; 15: 1113‐1123.
11. De Leenheer AP, Lambert WE, Nelis HJ. Modern chromatographic analysis of vitamins‐chromatographic science series. New York: Marcel Dekker; 1992.
12. Woollard DC. New ion‐pair reagent for the high‐performance liquid chromatographic separation of B‐group vitamins in pharmaceuticals. J. Chromatogr 1984; 301: 470‐476.
13. Blanco D, Escotet VJ, Fidalgo LE, Gutierrez MD. Simultaneous determination of vitamins D3, E and K1 and retinyl palmitate in
cattle plasma by liquid chromatography with a narrow‐bore column. J. Pharm. Biomed. Anal 1994; 660: 49‐55.
14. Chatzimichalakis PF, Samanidou VF, Verpoorte R, Papadoyannis IN. Development of a validated HPLC method for the determination of B‐complex vitamins in pharmaceuticals and biological fluids after solid phase extraction. J. Sep. Sci 2004; 27: 1181‐1188.
15. Iwase H. Ultramicrodetermination of cyanocobalamin in elemental diet by solid‐phase extraction and high‐performance liquid chromatography with visible detection. J. Chromatogr 1992; 590: 359‐363.
16. Shinomiya K, Yoshida K, Kabasawa Y. Countercurrent chromatographic separation of water‐soluble vitamins by cross‐axis coil planet centrifuge using an ion‐pair reagent with polar two‐phase solvent system. J. Liq. Chrom. Rel. Technol 2001; 24: 2615‐2623.
139 17. Moreno P, Salvado V. Determination of eight water‐ and fat‐
soluble vitamins in multi‐vitamin pharmaceutical formulations by high‐performance liquid chromatography. J. Chromatogr. A 2000; 870: 207‐215.
18. Hoeller U, Brodhag C, Knoebel A, Hofmann P, Spitzer V. Automated determination of selected water‐soluble vitamins in tablets using a bench‐top robotic system coupled to reversed‐ phase (RP‐18) HPLC with UV detection. J. Pharm. Biomed. Anal 2003; 31: 151‐158.
19. Wimalasiri P, Wills RBH. Simultaneous analysis of thiamin and riboflavin in foods by high‐performance liquid chromatography. J. Chromatogr 1985; 318: 412‐416.
20. Dinc E, Kokdil G, Onur FA. Comparison of matrix resolution method, ratio spectra derivative spectrophotometry and HPLC
method for the determination of thiamine HCl and pyridoxine HCl in pharmaceuticals. J. Pharm. Biomed. Anal 2000; 22: 915‐ 923.
21. Orr M.L. Pantothenic acid, Vitamin B6 and Vitamin B12 in Foods.
Home Economics‐US Department of Agricultural Bulletin; Research Report No. 36, Washington DC: 1969.
22. Wang E, Hou. Determination of water‐soluble vitamins using
high‐performance liquid chromatography and
electrochemical or absorbance detection. J. Chromatogr 1988; 447: 256‐262. 23. Chu K, Tin K. Analysis of commercial multi‐vitamin preparation by HPLC with diode array detector. Anal. Lett 1998; 31: 2707‐ 2715.