L
(2018)
Twitter permeability to financial events: an experiment towards a
model for sensing irregularities.
Multimedia Tools and Applications. ISSN
1380-7501
Downloaded from:
http://e-space.mmu.ac.uk/621082/
Version:
Published Version
Publisher:
Springer Verlag
DOI:
https://doi.org/10.1007/s11042-018-6388-4
Usage rights:
Creative Commons: Attribution 4.0
Please cite the published version
https://doi.org/10.1007/s11042-018-6388-4
Twitter permeability to financial events: an experiment
towards a model for sensing irregularities
Ana Fern´andez Vilas1 ·Rebeca P. D´ıaz Redondo1· Keeley Crockett2·Majdi Owda2·Lewis Evans2
Received: 1 December 2017 / Revised: 22 May 2018 / Accepted: 5 July 2018 © The Author(s) 2018
Abstract There is a general consensus of the good sensing and novelty characteristics of Twitter as an information media for the complex financial market. This paper investi-gates the permeability of Twittersphere, the total universe of Twitter users and their habits, towards relevant events in the financial market. Analysis shows that a general purpose social media is permeable to financial-specific events and establishes Twitter as a relevant feeder for taking decisions regarding the financial market and event fraudulent activities in that market. However, the provenance of contributions, their different levels of credibility and quality and even the purpose or intention behind them should to be considered and carefully contemplated if Twitter is used as a single source for decision taking. With the overall aim of this research, to deploy an architecture for real-time monitoring of irregularities in the financial market, this paper conducts a series of experiments on the level of permeability and the permeable features of Twitter in the event of one of these irregularities. To be pre-cise, Twitter data is collected concerning an event comprising of a specific financial action on the 27th January 2017: the announcement about the merge of two companies Tesco PLC and Booker Group PLC, listed in the main market of the London Stock Exchange
Ana Fern´andez Vilas [email protected] Rebeca P. D´ıaz Redondo [email protected] Keeley Crockett [email protected] Majdi Owda [email protected] Lewis Evans [email protected]
1 I&C Laboratory AtlantTIC Research Centre, University of Vigo, Vigo, 36310, Spain
2 School of Computing, Mathematics & Digital Technology, Manchester Metropolitan University, Manchester, M1 5GD, UK
(LSE), to create the UK’s Leading Food Business. The experiment attempts to answer two research questions which aim to characterize the features of Twitter permeability to the financial market. The experimental results confirm that a far-impacting financial event, such as the merger considered, caused apparent disturbances in all the features considered, that is, information volume, content and sentiment as well as geographical provenance. Analy-sis shows that although Twitter is not a specific financial forum, it is permeable to financial events. Therefore it should be considered within the architecture for real-time monitoring of irregularities in the financial market.
Keywords Twitter data analysis·Stock market·Irregularity behaviour· London stock exchange
1 Introduction
Progressive usages of technology in the stock markets have led to a continuous growth in their business. Businesses and individual investors alike can take decisions and invest within minutes if not in seconds [24]. Helping both businesses and individual investors harvest information from diverse sources such as the company itself, through their website or Regu-latory News Service (RNS), news agencies, brokers, stock market and individual investors, is a difficult and time consuming task. At the beginning of the emergence of social media, stock discussion forums pioneered an alternative source of information for investors, spe-cially retailers, supplementing the traditional news media. A plethora of academic works study the capability of these highly-specialized social channels to predict returns and to detect abnormal behaviours in the stock market [3,9,15,47]. From the investor’s perspec-tive, success highly depends on the quality and the rapidness of the information to support the decision-making. As online social media invaded the habits of people, also companies, brokers and other key roles in the financial market began to share more and more factual information and informed opinion in social media. The task of a financial analysts becomes progressively more challenging if we consider that not only have they to take decisions in seconds, but also deal with an increasing number of data sources comprising of a continu-ous range of different features and quality. Although social media may be a vehicle to fight against asymmetric information in the financial market [5], the volume, velocity and variety of its data make investing a heroic task, especially for individual investors.
Given today co-existence of social media and traditional news media (newspaper or online news media), the authors in [25] compare the performance of social media and news media in predicting returns in the Australian market. It is clear that social media outperforms traditional media on the capability for readers to interact or further spread information. Although the study shows a significant effect of sentiments on one online discussion forum focused on the Australian financial market, it found that the effect of new media was not significant. The most interesting finding was that sentiments on online investor forums do not seem to mirror the ones from news media.There is in fact, an ongoing debate about to what extent social media analytics would be the new predictor for the future returns of stock-exchange traded financial assets. We may even wonder if social media can lead the direction of the financial market at some point in the future as some authors suggested [59]. Although organizations have always used various corporate disclosure channels to com-municate directly and indirectly with investors, they are now relying on social media to provide up-to-date information to investors. As the heart of publicly accessible Social Media, Twitter has become a vital source for open source social intelligence about news,
natural disasters, terrorist attacks, public health, politics, etc. Also, Twitter is one of the most currently used platforms to share financial information from companies, brokers, news agencies or individual investors. Some recent works in the literature study this changes in reporting financial news [32,56,57]. As Twitter usage in this context is definitively increas-ing; it is important to stress that, according to [50], stock microblogs exhibit three distinct characteristics about stock message boards: (1) Twitter’s public timeline may capture the natural market conversation more accurately and reflect up to date developments; (2) Twit-ter reflects a more ticker-like live conversation, which allows micro-bloggers to be exposed to the most recent information of all stocks and does not require users to actively enter the forum for a particular stock; and (3) micro-bloggers have a strong incentive to publish valuable information to maintain reputation (increase mentions, the rate of retweets, and their followership), meanwhile financial bloggers can be indifferent to their reputation in the forum. Providing sensing, harvesting and analysing methods and tools of such informa-tion could be very useful for many stakeholders such as businesses and individuals making decisions to invest, stock market analysts and law enforcement agencies.
This paper analyses the permeability of Twittersphere, the total universe of Twitter users and their habits, to a relevant event for the financial market. Our hypothesis is that Twitter (although not a specific financial forum) is permeable to financial events and this permeabil-ity can be analysed by monitoring some specific features related to companies. Although several works in the literature have studied the correlation between Twitter and financial movements (to exploit its predictive power), our objective does not address regularities of the market in a longitudinal study that should take into consideration a long time series. On the contrary, we look for assessing the level of permeability of Twitter to financial events. For that, we study a remarkable event in January 2017: the announcement about the merge of Tesco PLC (hereinafter Tesco) and Booker Group PLC (hereinafter Booker) to create the UK’s Leading Food Business on the 27th January 2017. Both companies, Tesco and Booker are listed in the main market of LSE (London Stock Exchange). The findings in the varia-tion of Twitter volume and content show that the use of general purpose social media data is permeable to financial-specific events. The work presented is the first step in considering Twitter as a relevant feeder for taking decisions regarding the financial market and detecting irregularities in that market. An initial analysis of this experiment in [21] reported impor-tant insights when considering Twitter volume. This paper advances in the analysis of the Twitter permeability at that event by considering also the content of posts.
This paper is structured as follows. Section2introduces the related work the usage of digital information sources to assist decision-taking in the financial market, and Twitter in particular (Section2.1). From this review of related works, Section2.2also highlights the contribution in this paper. In Section3, we describe Twitter efforts to accommodate financial information in a general-purpose microblogging platform and we propose a model of the position of Twitter in the financial universe as well as the path flows of information. Also, we introduce the experiment and two specific research questions around our hypothesis. The experiment methodology (Section4) takes advantage of the extraction characteristics of Twitter APIs to construct a specific dataset for the merger, which is described in Section4.1
along with features related to the rapidness and synchronisation of Twitter with the LSE regarding the announcement of the financial event and the stock share prices (Section4.2). Then, a series of investigations are conducted over the extracted dataset to address the research questions and the impact is analysed according to its disturbance in terms of Twit-ter volume (Section5); in terms of hashtag dynamics and topic modelling (Section6and Section7); in terms of sentiment towards the actions (Section8); and in terms of geograph-ical distribution of the posting (Section9). Finally, Section10discusses our findings and
their limitations, meanwhile Section11summarises the main conclusions and introduces our ongoing work in the study of permeability of Twitter to financial events.
2 Related work
The modernisation and digitalisation of the financial market has been accompanied with the enormous increasing of information available for traders and investors, which can make extremely difficult for one person or a small group to conduct an analysis of a financial asset. In the application of computational intelligence to the financial market, mining textual content (financial news, financial reports , and even information in micro-blogs) is consid-ered a relevant source of information for predicting future market behaviour [10]. To do so, researches have proposed the extraction of relevant features from the textual content. From the very beginning, sentiment was considered one of these relevant features to improve the accuracy of financial time series forecasting [54]. More recently, [27] proposes consider-ing professional opinions in social media and financial news as supplementary sentiment sources, along with firm characteristics, so that, a methodology for joint effects of sentiment is proposed.
Cavalcante et al. [10] introduced a comprehensive review on the usage of computational intelligence in the financial market. The authors also suggest a systematic proposal for the building of intelligent trading systems. To sum up, most of the research in this field address the predictive power of social media problem and the differences appear in information sources, their extracted features, and also the predictive methods and the values to be pre-dicted. [7] have shown that trading volumes of stocks traded in NASDAQ-100 are correlated with their query volumes (i.e., the number of users requests submitted to search engines on the Internet). Gunduz and Cataltepe [22] proposed a forecasting method which com-bines the analysis of news articles from Turkish finance websites, the extraction of feature vectors and stock prices to predict future market movements. The experiment used a naive Bayes algorithm to construct a prediction model which integrate the feature vectors and stock prices. Also, [35] used text mining of financial news-headlines to predict movements in the FOREX market; the extracted features include both semantics and sentiment in the content. Deep learning has been also applied to model both short-term and long-term influ-ences of events on stock price movements in [17]. Finally, The combination of public news with the browsing activity of the users of Yahoo! Finance to forecast intra-day and daily price changes of a set of 100 highly capitalised US stocks was explored in [43]. The work showed that, when taken alone, sentiment analysis or browsing activity have very small or no predictive power and uncovered a “wisdom-of-the-crowd” effect that allows to exploit users’ activity to identify and weigh properly the relevant and surprising news.
2.1 Twitter as a source for decision making
If the impact of information from online data sources into the financial market is broadly recognised by researchers and professionals, this is also the case for Twitter specifically. It is fair to say that it was Twitter that popularised the term hashtag as well as its # symbol to index keywords or topics so that people can easily follow those they are inter-ested in. In 2012, Twitter unveiled a new clicking and tracking feature for stock symbols known as Cashtags. Cashtags are stock market symbols that can be included in tweets and, when preceded with a dollar sign (for example $VOD in regards to Vodafone), become clickable.
All the roles on the financial market (investors, specialised news agencies, etc.) are using Twitter to continually monitor the pulse of the market and make decisions. The literature pays particular attention to several ways in which the different market agents and partici-pants may use Twitter analytics. Taking the plethora of works related to opinion mining on Twitter, one of the most researched areas is examining consumer behaviour for financial pur-poses. Although real-time decisions in the stock market are the most obvious manifestation of investment, long-term investments are more related with consumer analysis, so discov-ering the driving actors for sales and earnings is an active area of research [1]. Twitter is a valuable source of information even for the financial sector where contributors mainly fall into 5 categories [18]: (1) Journalists; (2) Companies and their representatives; (3) Govern-ment agencies; (4) Activist investors; and (5) citizen journalists (individuals). Also, the type of financial information is different, comprising not only of breaking news but rumours and speculations. According to [18], this new financial media comes with new challenges as the huge volume of available data, the high number of repetition of the same information and, notably, a continuum of quality of the tweets, demands mechanisms measure credibility. Also [12] suggests the importance of social media in the financial market, in particular Twit-ter, by analysing the popularity of Bloomberg tweets. Again, the authors agree on the fact that Twitter complements traditional news with speculations as well as off-the-cuff report-ing, but also provides evidence that popularity within finance is not necessarily the same as popularity within other areas in Twitter, so that ‘novelty’ seems to be a very impacting fea-ture of the popularity of financial tweets. Also, the importance of the very first source of the news itself, the negative disclosures in this case, has been analysed in [19]. Their experiment found evidence that negative financial news influences investors’ willingness to invest when the news comes from the Investor Relations Twitter account, but not when it comes from the CEO’s Twitter account. Taking apart the concerns about information veracity and credibil-ity, freshness characteristics of Twitter also may have an important role in the field of High Frequency Trading (HFT), when traders make an investment position that is held only for very brief periods of time, even just seconds. At HFT, investors track social media to count for public behaviour and opinion to take their investor decisions. Thus, the relationship between Twitter sentiment and financial market instruments like volatility, trading volume, etc. and reports is investigated in [44] with promising results in DJIA and NASDAQ-100.
Hentschel and Alonso [23] reported an exploratory analysis of public tweets in English, extracted via Twitter Firehose, which contain at least one Cashtag from NASDAQ (National Association of Securities Dealers Automated Quotation) or NYSE (New York Stock Exchange). The analysis concludes that the use of Cashtag is higher in the technologic sec-tor, which seems to be related to the technological profile of most of the Twitter users. In addition, the top 10 Twitter accounts according to the usage of Cashtags are companies or news agencies which in the majority of cases correspond to automatic or semi-automatic Twitter accounts. This analysis also highlighted the existence of relevant information behind the co-occurrence of Cashtags and the co-occurrence of Cashtags and Hashtags together.
Secondly, the analysis of the relationships between Twitter behaviour and stock share price is also a prime example of the increasing flow of information between financial and Twitter universes. For instance, [42] investigated a 15-month period of Twitter data including sentiment, concerning 30 stock companies registered on the Dow Jones Industrial Average (DJIA) index. This work gave some insights about sentiment and abnormal returns during the peaks of Twitter volume. Specifically, the authors show that not only is there a strong interaction between Twitter and the financial market in some moments identified as “known” relevant events (i.e. quarterly announcements), but similar results were observed in peaks not corresponding to any expected news about the stock market. Also, [29] used
Twitter to identify and predict stock co-movement according to firm-specific social media metrics and [49] studied tweets related to US market as indicator of some (potentially new) information in the stock market rather than on evaluating the problem of causality on stock prices.The results in [49] show that nearly a third of the tweets in the study are associated with abnormal price movements so that the authors suggest that Twitter is not a replace-ment for traditional sources in financial market. In fact, Twitter lacks the concrete trading recommendations that are common in other financial information sources.
Other research works have examined the possible connections between Twitter informa-tion and financial market performance, that is the predictive value of informainforma-tion gathered form social media to take decision about trading. Ruiz et al. [46] investigated the correla-tion between the activity on Twitter and financial time series, with the goal of verifying if published tweets can influence stock price movements or volume by using cross-correlation with time lags. Results showed that the trade volume of a stock was correlated with the num-ber of connected components in the graph of that stock and with the numnum-ber of tweets in the graph. However, the authors found that the price of a stock are weakly correlated with the analysed features. In [8] tick-by-tick transaction data was analysed for 20 Italian stocks on a period of approximately four months. Remarkably, [11] analysed lengthy dataset consisting of 1723 stocks for a period of more than two year, resulting in a dataset with approximately six million tweets which were tweeted by approximately 0.5 million unique users. In this study, authors found out that expert users impact financial market more than others and that sectors such as Technology and Customers show a better correlation than others with the financial movements.
Although most of these works are based on the Twitter data volume, there are also studies that apply sentiment analysis techniques in order to distinguish the polarity of content and its impact on the financial market. Bollen et al. [6] showed that public mood analysed through Twitter feeds is well correlated with Dow Jones Industrial Average (DJIA). Zhang [58] found out a high negative correlation between mood states like hope, fear and worry in tweets with the Dow Jones Average Index. Therefore, text based sentiment was considered useful to make trading decisions [2] or predict useful stock market variable, [13,28,36,41]. Recently, [16] investigated the correlation of sentiments of public with stock increase and decreases using Pearson correlation coefficient for stock. Also [40] applied sentiment anal-ysis and supervised machine learning to Twitter to analyze the correlation between stock market movements of a company and sentiments in tweets, finding out a strong correlation between rise/fall in stock prices of a company and public opinions or emotions about that company expressed on twitter. As it is widely accepted, one of the main issues in natural language processing in Twitter is the short length of the posts that might limit unsuper-vised learning. However, [37] proposed an approach for creating stock market lexicons from the specialised stock market microblog StockTwits. Then, unsupervised machine learning is applied to produce Twitter investor sentiment indicators. The results shows a moderate correlation with two traditional survey indicators: Investors Intelligence (II) and American Association of Individual Investors (AAII). Same authors proposed in [38] a methodology based on Kalman Filer to forecast stock market variables: returns, volatility and trading volume of diverse indices and portfolios.
2.2 Contribution
Consequently, there is a general consensus of the good sensing and novelty characteristics of Twitter as a source of information for the complex financial market. However, the prove-nance of contributions, their different levels credibility and quality and even the purpose or
intention behind them makes Twitter not reliable enough as the single source for decision taking. This paper reports a Twitter study framed by a collaboration project among the Uni-versity of Vigo and the Manchester Metropolitan UniUni-versity to deploy an architecture for real-time monitoring of irregularities in the stock market. That architecture will apply data mining and fusion technologies from a pool of social media feeds related to the stock mar-kets. In order to design the architecture, the permeability of the different feeders should be analysed, that means, to what extent a specific financial information feeder is permeable to fraudulent and common irregularities in the financial market. The aim of this paper is to analyse that permeability for the case of the microblogging platform Twitter. The Intelligent System Group at the Manchester Metropolitan University has worked in the detection of irregularities form Financial Discussion Forums [39]. Meanwhile, the Information & Com-puting Lab of the University of Vigo has a relevant know-how in applying Twitter analytics to a variety of real life problems [45,48].
Meanwhile the vast majority of the studies focus on the predictive power of social media regarding the movements of the financial market, the work in this paper focus on anomaly detection. Also [4] addresses the problem of analysis specifically how investors on Twitter behave around the meeting dates of FOMC (Federal Open Market Committee) USA Federal Reserve System. They found that the polarity score of tweets that are published at least 24 hours before the FOMC meeting are relevant to predict returns. So, this paper looks at social media’s reaction to a significant and recurring macroeconomic event, instead of analysing events for individual equities. In our work, we are interested in research the reaction to significant financial events that barely can be analysed with longitudinal studies, which explore the regularities of the market along a long period.
3 Research questions and the experiment
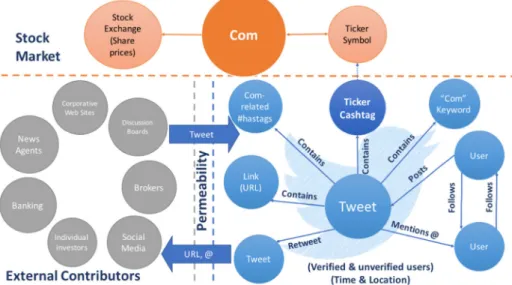
But, Twitter is neither the only nor the biggest source of information about financial markets and, in this respect, Figure 1 shows a reference model for the Twitter position regarding this universe of information and its relationships within the stock market. At any moment (time) and from anywhere (location), a variety of contributors in the financial sector (verified and unverified Twitter accounts) may post (tweet or retweet) pieces of information referring to a company by using either (1) the unique symbol $cashtag, (2) #hashtags related with the company for a specific purpose or related to a specific event and /or (3) simply the company name in its different forms (official, abbreviation, colloquial, etc.). At the same time that main agents in the financial market post into Twitter, the Twitter content maintains refer-ences to the financial universe outside via mentions, URLs, etc. Given apart the flows which characterise the permeability of the layer in between Twitter and the financial market, the information naturally spreads throughout the Twittersphere by the common re-tweeting and following mechanism in the platform. Even if the piece of news (post) comes from a human spread rumour or some cyber-attack which ends up being false information, [26] sustains about “the power of networked social and financial systems to connect autonomously and to produce a present without human oversight or governance”. In our opinion, further actions and research are needed to achieve a safer financial ecosystem for traders and investors.
In this section, we describe the experimental methodology which will be used to answer our main hypotheses: Twitter (although not a specific financial forum) is permeable to financial events and this permeability can be analysed by monitoring some specific features related to companies. To address this high-level research question, we selected a random but relevant even, according to its impact on the financials spheres but also on the general public,
at the beginning of year 2017. The most important feature for the selection of the event is the latter, that is, an event which being intrinsically financial, is of common interest for the general audience so that permeability can be measured beyond the spheres of financial experts in Twitter.
The event under study, is the merge of Tesco and Booker on the 27th January 2017, announced by the RNS (Regulatory News Service) of LSE (London Stock Exchange) at 7:00 a.m. GMT (Greenwich Mean Time). This action is modelled according to the reference model in Fig. 1, that is, we model Tesco on Twitter with the conceptual triplet (cashtag, hashtags, keyword), that is ($TSCO, #[Tesco], “Tesco”). This model represents the finan-cial perspective of Tesco on Twitter ($TSCO), specific comments about some Tesco issue on Twitter (#[Tesco]: #hashtag in some tweet with the keyword “Tesco”), and general refer-ences to Tesco on Twitter (“Tesco”). As mentioned, our objective is a monitoring platform that continuously harvests signs scattered all over social media platforms to identify irreg-ularities, such a platform will be supported by a data fusion model which extract relevant features and weight the contributions from different online information sources. Although in such an approach not only Tesco but Booker would be continuously monitored, the experi-ment faces the isolated behaviour of Tesco (one of the parts in the action) due to significance reasons, as the part with more presence in social media and due to design reasons, as the company being the focus of real-time irregularity monitoring.
Regarding permeability to financial events, we may hypothesise that the permeability and the impact is not alike in the three perspectives which constitute the triplet. The cashtag is invariably linked to financial news of a company but hashtags have a completely different dynamic. The hashtags related to a specific company will emerge and disappear dynamically according to the company decisions, marketing campaigns, consumer behaviour, etc. Tesco being a well-known company in the UK, the impact of financial events in hashtags might be limited and just visible in case of general-public financial events. Presumably, financial events should have a bigger impact on cashtag tweets (according to volume and context) than on hashtags (just altering their dynamics) or on topics of Tweets content. Nevertheless, this presumably different behaviour should be inspected.
Given our hypothesis:“Twitter (although not a specific financial forum) is permeable
to financial events and this permeability can be analysed by monitoring (1) the name of
companies as a keyword (“Tesco” in this case), (2) the Cashtag of the company ($TSCO)
and (3) the hashtags related to that company.”
The experiment will attempt to answer the following research questions (RQ) related with the permeability of Twitter to financial events:
– RQ1: Is there any difference in permeability, in terms of volume and dynamics, among $cashtag-content (specifically $ marked financial tweets) and #hashtag-content (gen-eral tweets with #hashtag marks) and financial content (gen(gen-eral tweets with financial terms)
– RQ2: Is that permeability (in terms of volume and dynamics) accompanied by additional variations in some other features in the content (location, sentiment)? On the basis of the proposed RQs, and even though we are reporting a single case study, we would like to highlight that our triplet approach can be applied to the general moni-toring of financial event on Twitter disregarding the market and the sector if we consider announcement services and stock prices in other regulated financial markets.
4 Twitter data mining & the dataset
There are three different ways to obtain Twitter data: Search API, Streaming API and Fire-hose. The Twitter Search API provides the endpoints to recover tweets that were published in the previous two weeks, with the possibility of filtering according to several criteria. On the other hand, Twitter Streaming API returns 1% of the tweets that match some search parameters in real time. Finally, Twitter Firehose provide access to the 100% of the tweets, but it is not a free-access API. Twitter APIs are constructed around four main “objects”:
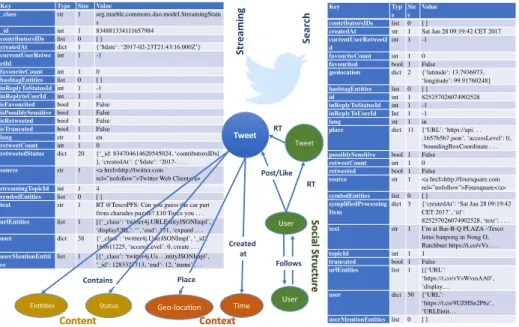
Tweets,Users,Entities(hashtags, URLs, mentions and media in a tweet) andPlaces. From theses object and taking time as the Twitter’s backbone, we consider a Twitter model which contemplates 3 orthogonal perspectives: The content, the social structure and their spatio-temporal context (see Fig.2).
The anatomy of these objects is described in the Twitter Developer documentation. With regard to this work, as the experiment does not focus on the dynamic spreading of infor-mation on Twitter (via retweeting, mention or like mechanisms), we select the following features (existing in both APIs under different field names) for the analysis, all of them accessible from a Tweet object:
– Content perspective: the status update (Tweet:text) and the entities in the tweet (Tweet:entities), specificallyhashtags(including cashtags) andurls. – Context perspective: the post time of the status update (Tweet:created at)
and, if available, also the place by feature Tweet:coordinates and feature
Tweet:place:bounding box).
– Social Perspective: User (Tweet:user, specifically the field verified).
There are some differences between the Searching API and the Streaming API illustrated in Fig.2. One difference being the time direction - the most relevant one to our experiment. The Search API goes back in time, whilst the streaming API goes forward. Moreover, there are other differences related to mainly the format and the rate limit rules. As it is shown in Fig.2, the search and Streaming API does not return data in exactly the same format but the differences in format are irrelevant for data analysis where preprocessing can define a
Key Typ
e Siz e
Value
contributorsIDs list 0 [ ]
createdAt str 1 Sat Jan 28 09:19:42 CET 2017 currentUserRetweetI
d
int 1 -1
favouriteCount int 1 0 favourited bool 1 False geolocation dict 2 hashtagEntities list 0 [ ]
id int 1 825257026074902528 inReplyToStatusId int 1 -1
inReplyToUserId Int 1 -1
lang str 1 in
place dict 11
possiblySensitive bool 1 False retweetCount int 1 0 retweeted bool 1 False
source str 1 <a href=http://foursquare.com symbolEntities list 0 [ ]
symplifiedProcessing
Item
dict 3 createdAt
text str 1 -B-Q PLAZA Tesco lotus banpong in Nong O, Ratchburi https://t.co/vVs . . . topicId int 1 1
truncated bool 1 False urlEntities list 1
user dict 50
userMentionEntities list 0 [ ] Key Type Size Value
_class str 1 org.marble.commons.dao.model.StreamingStatu s
_id int 1 834881334111657984 contributorsIDs list 0 [ ]
createdAt dict 1
-02-currentUserRetwe etId
int 1 -1
favouriteCount int 1 0 hashtagEntities list 0 [ ] inReplyToStatusIdint 1 -1 inReplytoUserId int 1 -1 isFavourited bool 1 False isPossiblySensitive bool 1 False isRetweeted bool 1 False isTruncated bool 1 False
lang str 1 en
retweetCount int 1 0 retweetedStatus dict 20
- . . . source str 1 <a href=http://twitter.com
streamingTopicId int 1 4 symbolEntities list 0 [ ]
text str 1 RT @TescoPFS: Can you guess the car part from charades puzzle? £10 Tesco you . . . urlEntities list 1 user dict 38 userMentionEntiti es list 1 ntityJSONImpl Search Streaming Tweet Enes Place Geo-locaon Time Status Created at Content Context User Tweet RT Social Structure Follows RT User Post/Like Contains
Fig. 2 Twitter APIs and a model of the Twittersphere
uniform intermediary format. Regarding their extracting capacity, forums contain plenty of discussion about this issue which has not ever made enough clear from Twitter officially.
According to the proposed model (Fig.1) the experiment will analyse the permeability of Twitter to financial events by the inspection of the triplet ($TSCO, #[tesco], ‘tesco’), defined as:
– $TSCO, the set of tweets where the ticker symbol $TSCO is an entity;
– #[tesco], the set of tweets with at least one hashtag and containing the keyword ‘tesco’; and ‘tesco’,
– the set of tweets containing the keyword ‘tesco’, no matter whether they contain a hashtag or not.
4.1 The dataset
The extraction strategy firstly used the Twitter Search API to recover the information back-wards before the announcement on 27th of January 7:00 a.m. GMT and the streaming API was used to recover information forwards until 27th February (one month later). This data streaming collection, just after the announcement, was used to visualise the impact of the announ-cement and the time the behaviour of tweets concerning Tesco resumes a regular pattern again. The results of the combination of the search and streaming results is shown in Fig.3. Once the behaviour becomes regular, we used the Search API again to obtain a regular dataset to compare with the Search API results recovered just after the merge action was announced. Clearly, the Twitter Search API is not appropriate for continuous analytical monitoring and as a data source to allow real-time decision making. It is not intended and does not fully support the repeated constant searches that would be required to deliver 100% coverage. However, the experiment in this paper is limited to one individual company, 2 keywords and timelines in the scale of weeks. Therefore, the Search API provides a better
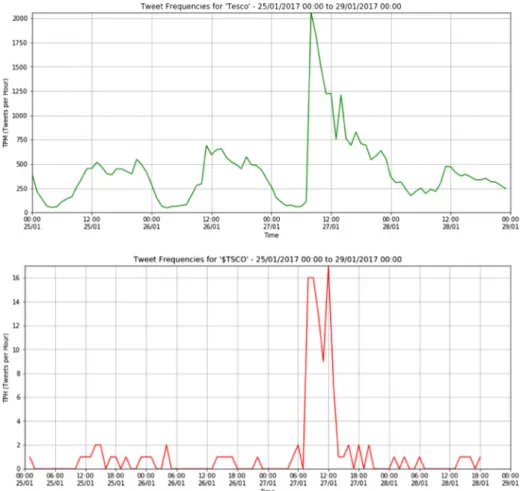
Fig. 3 Total Twitter volume for the keyword ‘tesco’ (left) and for the cashtag $TSCO (right) by merging (without duplicates) data returned from queries to Search API (backwards) and Steaming API (backwards)
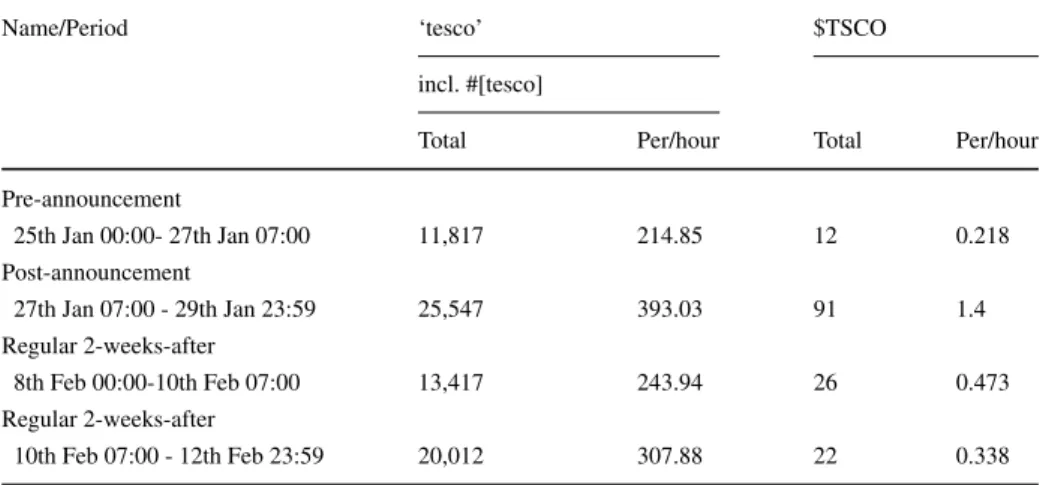
coverage than the Streaming API (1% according to the Twitter official information), if the superior filtering characteristics of the Search API are used. Nevertheless, as the Search API has a limit on the number of tweets recovered, to get the whole data during the period under study (see Table1), we repeatedly asked Twitter for the most recent results backwards by windowing the searches according to the publication date and merging results according to the post Id. In this way, we guarantee a fair comparison according to the volume of data since, in any manner, we should compare the Search API with Streaming API results. According to that, and to give response to the research questions, we use the Search API queries to cover the time periods defined in Table 1. Mainly, the 4 periods in this table capture the Twitter volume retrieved by the Search API during the very same days of the week, Wednesday to Sunday, around the announcement on Friday 27th of the merge
(pre-announcement and post-(pre-announcement periods) and when behaviour becomes regular at the corresponding week days. Two types of Search API queries were considered, (1) query with the term ‘tesco’ for the Tweet:entities and the Tweet:text entities, to capture post related with Tesco and post also containing a hashtag related with Tesco ( a total of 70,793 tweets) and (2) query with the term ‘$TSCO’ for Tweet:entities (a total of 151 tweets). It is fair to mention that ‘tesco’ volume is several orders of magnitude higher than ‘$TSCO’ given the high visibility of the company Tesco in social media as a vehicle for marketing and consumer engagement.
Table 1 Time Periods (GEM Time) in the experiment (extracted with Twitter Search API)
Name/Period ‘tesco’ $TSCO
incl. #[tesco]
Total Per/hour Total Per/hour
Pre-announcement 25th Jan 00:00- 27th Jan 07:00 11,817 214.85 12 0.218 Post-announcement 27th Jan 07:00 - 29th Jan 23:59 25,547 393.03 91 1.4 Regular 2-weeks-after 8th Feb 00:00-10th Feb 07:00 13,417 243.94 26 0.473 Regular 2-weeks-after 10th Feb 07:00 - 12th Feb 23:59 20,012 307.88 22 0.338
Fig. 4 First Tweet referring to the action in the ‘tesco’ and $TSCO dataset
4.2 Rapidness & synchronization in the dataset
Although our analysis focuses on the permeability of Twitter to financial events, our objec-tive, and part of our future work, is the use of Twitter as a sensor of irregularities in the stock market so rapidness and synchronisation of Twitter as a channel to the stock market: rapidness in its response to the RNSs of LSE (London Stock Exchange) and
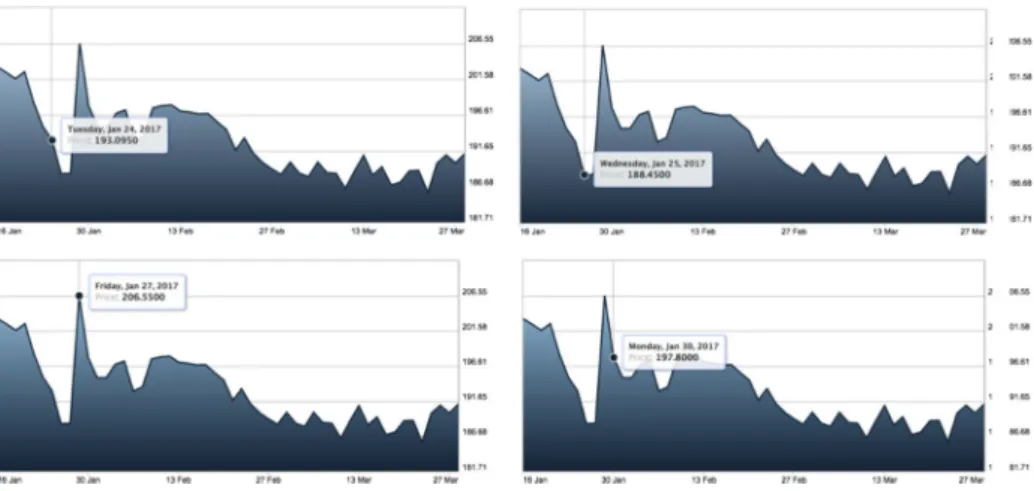
Fig. 6 Main observational points in the Evolution of the Tesco PLC share price (16th January to 27th March 2017)
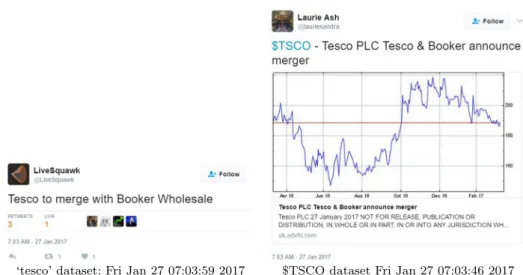
synchronisation with the share prices also in LSE are relevant. Regarding the rapidness, the experiment definitively shows the good characteristics of Twitter. The first tweet referring to the RNS was at 7:03 a.m. on 27th, just 3 minutes before the RNS announcement about the Tesco and Booker merge (Fig.4). Beyond the very first tweet, it is remarkable the rapid-ness of the peak response to the announcement in both datasets, so that the 27th Twitter time series (‘tesco’ and $TSCO) can be considered abnormal time series when a regular Friday is taken as a reference. We highlight that the peak starts from 7:00 to 8:00 both in the #TSCO and $TSCO dataset (see Fig.5).
Regarding the synchronisation with the share prices at LSE (Fig.6and Table2), it is fair to mention that although the share prices were abnormally low the day before the announce-ment, we haven’t found any reference to the financial vocabulary considered for the action during this period. Moreover, we cannot extract a sound finding given to the concatena-tion of two events with financial impact in Tesco PLC: the legal acconcatena-tions against Tesco PLC overstatement (see Section7) and the merge of Tesco and Booker. In terms of rapidness and synchronisation, we appreciate that the Twitter permeable layer exhibits rapidness in response to the financial market but we barely appreciate a clear synchronisation with the stock share prices.
Table 2 Values of share prices and Twitter volume
Period Price closing time ‘tesco’ $TSCO Total
24th 16:30 to 25th 16:30 188.45 7,697 6 7,703
25th 16:30 to 26th 16:30 188.5 8,356 4 8,360
26th 16:30 to 27th 16:30 206.55 15,295 38 15,333
28th 16:30 to 29th 16:30 — 10,077 8 10,085
5 Impact on twitter volume
In this section, we detail the impact of the event by analysing the variation in the number of tweets (volume) so that a quantitative measure of Twitter permeability to a financial event can be observed. During this part of the analysis some irregularities were discovered which related to an inconsistency in the named scheme of tickers in Twitter. In particular, to our knowledge, Twitter has not promoted the specific distinction among financial markets so that the uniqueness of ticker symbols inside a market disappear in the Twittersphere. That is the case of $TSCO cashtag which corresponds to Tesco PLC in the LSE and toTractor Supply Companyin the NASDAQ, the second stock exchange in USA. So, the returned results to a $TSCO query included tweets related to Tesco PCL and also to Tractor Supply Company. If the cashtags is the entity to aggregate information around a specific company and, consequently, to allow the spreading of such information, some kind of market prefix should be used, especially in the times when companies are increasingly global.
Figure7shows the temporal series in tweets per hour (TPH) scale. Although it is quite obvious that the number of TPH in the ‘tesco’ dataset is up several orders of magnitude higher than those of the $TSCO dataset, the peak behaviour is more acute in the $TSCO
Table 3 Peak behaviour on the 27th January for ‘tesco’ and $TSCO
one. As it is shown in Table3, considers the hourly volume of the ‘tesco’ dataset on the 27th January. There are no outliers during the day, with the peak value of 2,057 tweets occurring in the sample from 8:00 to 9:00. Nevertheless, there are 3 outliers in the $TSCO dataset: samples 8:00-9:00, 9:00-10:00, corresponding to the time just after the announcement and 12:00-13:00, being consistent with previous studies about social timing in [34], which showed peak activity during lunch time in different cities around the world.
Apart from the peak comparison, we inspect the disturbance on other dataset features before and after the event, also comparing these dates with the regular behaviour 2 weeks later. In Table4, we compare the behaviour of the main features of ‘tesco’ data (in green) and $TSCO’ data (in blue).
Firstly, we can observe the increase of Tweets per hour during the post-announcement, compared to the regular period, is more acute in the $TSCO data (1.40 vs 0.34) than in the ‘tesco’ data (393,03 vs 307.86).Secondly, the percentage of tweets which contain a URL are significantly higher in the $TSCO data (from 75% to 82.61% in the different periods) with
Table 4 Variability of features in ‘tesco’ and $TSCO data before and after the announcement in terms of regular behaviour
respect to the ‘tesco’ one (from 29.51% to 48.41%), which is a result of the professional and financial orientation of the $TSCO data as a channel to spread facts and news rather than opinions and sentiments. Finally, the retweeting activity is higher in the announcement periods (pre- and post- with 43.85% and 31.59%) compared to the regular periods (38.69% and 28.36%) for the ‘tesco’ data. The increase of retweeting is, by nature, linked to the need or desire of spreading a piece of content but, the reason behind may be different as, in fact, it is in our case study: retweeting the ‘tesco’ keyword is mainly related with a Tesco campaign involving retweeting (see section VI for the details) meanwhile retweeting in $TSCO data is mainly linked to spreading the information about the merge (post-announcement) and about other financial news related with Tesco PLC. The information about this retweeting activity is expanded upon in the following sections of this paper. Finally, we observe the invariability on the number of verified users either along all the periods and along the ‘tesco’ and $TSCO data.
Both the peak behaviour (Table 3) and the feature comparison (Table 4) provide an answer to RQ1, that is, the event impact on $cashtag-content is greater than on #hashtag-content or on general content.
6 Impact on hashtags dynamics
Given the volume of Tweets, the spreading of the event throughput the Twittersphere should presumably have two effects: the change on the hashtag dynamics and the change on the main topics in tweets. More than this effect, what we would like to measure is to what extent this disturbance can be perceived differently in ‘tesco’ and $TSCO data. Presumably, and contrarily to the volume analysis, the content impact is expected to be more marked or noticeable in the ‘tesco’ data. So that, financial topics, which are the core of cash-tagged tweets, would conquer the whole Tesco content as a result of the good permeability to this financial event in Twitter, should be studied.
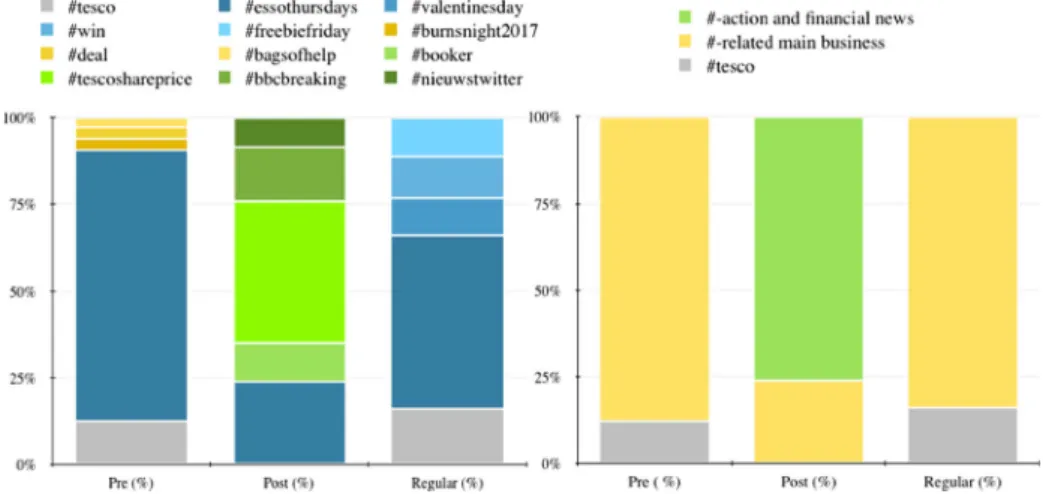
Focusing on the analysis on hashtags as a measure of ephemeral or nor so ephemeral interest, Table5shows the disturbance of the event in hashtag dynamics in the ‘tesco’ data, which is considered data related with the company without any specific financial bias. In terms of the 5 most frequent hashtags during the periods considered in the experiment, we clearly perceive that, only during the period Post-Announcement, financial hashtags emerge: #teschoshareprice and #booker. We consider #booker a hashtag related with the action given its co-occurrence with the keyword ‘tesco’, the reverse may be not true. Also, we discover a persistent hashtag during all the periods: #essothursdays, related with the equally named promotion campaign which allows Twitter and Facebook users to obtain 100 Tesco voucher provided that they follow the Twitter account @GB Esso and retweet the competition tweet. Regarding hashtag disturbance at a more general level, the bottom part of Table5shows the percentage of occurrence of the main hashtag of the company (#tesco), hashtags related with main business of the company (#-main business), and hashtags related with merge and financial aspects (#-action and financial). Also, Figure8shows hashtags in terms of semantic families. The left chart shows the main topics reported in the ‘tesco’ data and the right chart distinguishes the three main categories within these topics: “Tesco” in grey, “Main Business” in yellow and “Action and Financial news” in green). It is clear that, from the point of view of the hashtags dynamics, the merge reporting achieves a high position in the ‘tesco’ dataset after the announcement. During the pre-announcement period, hashtags (apart for the generic one#tescoin grey) are related to marketing campaigns (yellow in the
Table 5 Disturbance on Hashtag Dynamics for the ‘tesco’ dataset
aggregated chart on the right). It is only during the post-announcement period that financial-related hashtags emerge:#tescosharepricebeing 40.80% and #booker being the 11.16% of the top hashtags. Also, it is remarkable that the emergence of the hashtags related to the breaking news(#bbcbreakingand #nieuwstwitter) and that even #tesco disappears in the top-5 hashtags during the post-announcement period (Table5). All of financial-related and breaking news hashtags completely disappear in the period we consider as regular in terms of Tesco experiment (see also Table5).
Lastly, regarding the analysis of hashtags in the $TSCO dataset, it is not strange than during the regular period none of the tweets in the dataset contains a hashtag, so no extra specific information to follow and spread information is provided, apart from the pseudo-hashtag $TSCO. However, during the post-announcement period 15,38% of the tweets in the $TSCO dataset contains at least one hashtag. Nevertheless, the number of tweets dur-ing this period is 91 of which 16 include at least one hashtag. Although we prefer not to analyse the hashtag dynamics with this small number, we can appreciate a disturbance with regards to the regular period. This result talks about the malfunction of #hashtags in the $TSCO dataset. If #hashtags are the Twitter tool to aggregate semantically-related content and spread it, this feature is almost absent in the $TSCO dataset. We cannot perceive a hash-tag disturbance related to the action, because in the financial island of Twitter the $cashhash-tag
Fig. 8 Disturbance on Hashtag Dynamics for the ‘tesco’ dataset (left) and aggregation of the hashtags in semantic families
is the main Twitter tool to aggregate and spread content. What we can only appreciate with respect to the regular behaviour is the increase on the number of hashtags which accompany the pseudo-cashtag $TSCO.
According to these results we can establish the fulfilment of RQ1, in that Twitter per-meability to the merge can be perceived not only on $cashtag-content, which has a clear financial orientation, but also in the #hashtag dynamics.
7 Impact on the vocabulary & topics
When analysing the impact of the action on the Twitter content, the complete response to RQ1(can a financial load be also perceived in the #hashtag dynamics as in the general con-tent?) should be studied also from the point of view of the main topics people post about Tesco. For that, we should extract these topics from the tweets content in ‘tesco’ data and compare them with the ones in the specifically financial $TSCO data. Unfortunately, the number of tweets in the $TSCO dataset is relatively low. According to this, we decided to automatically split the ‘tesco’ and $TSCO data according to an automatic financial anno-tation by using a simple vocabulary related with general financial terms and specific terms related with the action.
The first RNS related to the event was published 27th January 2017 as RNS num-ber: 2907V under the title “TESCO & BOOKER ANNOUNCE MERGER”. The body of the announcement contains the following preface “The boards of Tesco PLC (“Tesco”), the UK’s leading food retailer, and Booker Group plc (“Booker”), the UK’s leading food wholesaler, are pleased to announce that they have reached an agreement on the terms of a recommended share and cash merger (the “Merger”) to create the UK’s leading food busi-ness.” To measure the financial burden of the topics in tweets content and the disturbance of this burden before and after the announcement, we apply a priori knowledge by selecting a simple vocabulary by inspecting the common terms in the content of the $TSCO dataset and the content of the RNS. Two categories of terms were created:
– Generic financial terms: Board of Directors, Executive Manager, CEO, Chairman, Director, Share, shareholder, revenue, return, capital, investment, dividend, Mix & Match.
– Specific action terms: Merge, take over, announcement, RNS, Merger, Tesco, Booker, Combined Group, Stewart Gilliland (extracted for the RNS announcement and the main actors in the action. The announcement is 85 pages long).
Regarding the representativeness of our vocabulary, the frequency of terms in the ‘tesco’ data was 7.11% and is much lower than the frequency in the $TSCO data which is 47.68%. We remark that these percentages referred to the total corpus (content of all the tweets in the dataset), not the total number of tweets in the datasets. Regarding the number of tweets containing at least one term in the vocabulary, we observe the following results in ‘tesco’ dataset: 2.07% (245 of 11817) before the announcement and 9.52% (2437 of 25547) after the announcement. This difference is obviously not so big in the $TSCO dataset: 25.00% (3 of 12) before the announcement and 27.47% (25 of 91) after the announcement (the increasing can be explained because of the inclusion of terms specifically related with the action). These differences in percentages is what these datasets should presumably exhibit according to the clear financial orientation of $TSCO as a pseudo-hashtag for the financial facts related with Tesco PLC. So that, our simple vocabulary allows us to measure the financial load of a set of tweets.
According to the vocabulary, we split the ‘tesco’ dataset (pre- and post- announcement) into a set of tweets containing at least one term in the vocabulary, hereinafter referred as
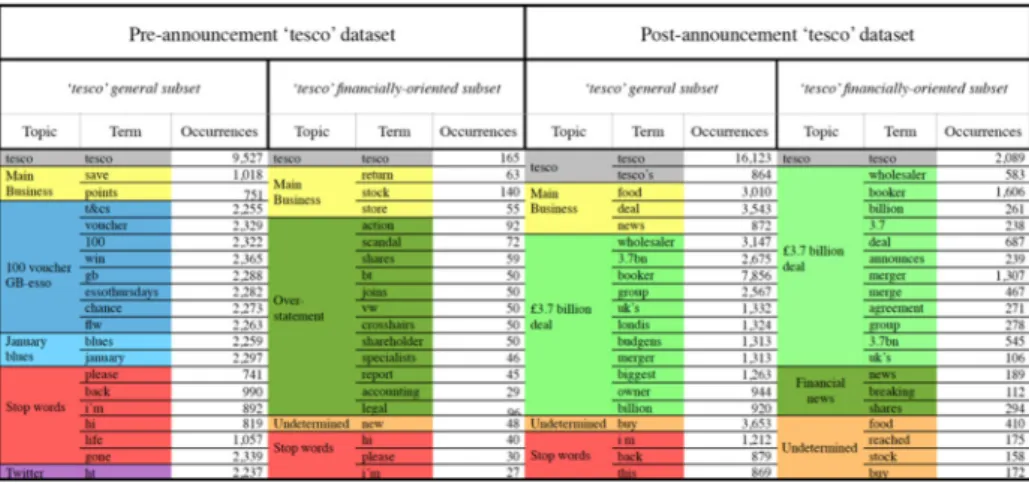
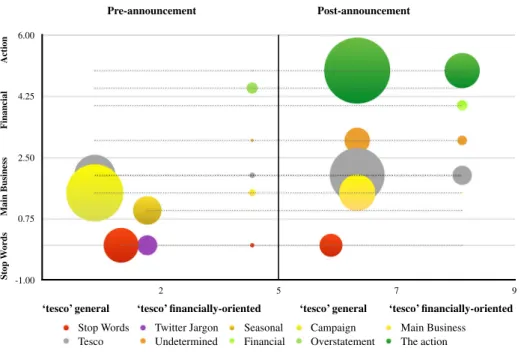
‘tesco’ financially-oriented subset; and the set of tweets not containing any term in our vocabulary, hereinafter referred as‘tesco’ general subset. Then, for uncovering the main topics, we adopted a simple bag-of-words model [55]. Under this approach tweet words in the status content are only considered according to their relative frequency and not accord-ing to their order within the document. In the bag-of-word result, we consider the proper cleaning precautions (i) by lowercasing and removing stop words; and (2) by specifically considering Twitter jargon (i.e. HT, QOTP). Finally, terms are contextualised according to the tweet semantics and categorised into topics. As a result, we obtain the contextualised & categorised occurrence of terms in Table6, and the evolution of the size of the considered categories on the ‘tesco’ corpus in Fig.9.
More specifically, Table6contains the contextualisation of the 20-most frequent terms inside the complete content of the tweet according to an n-gram strategy and manual anno-tation. We can obviate the term ‘tesco’ in its different forms (tesco, tesco’s in grey) from the analysis, since the dataset has been obtained from different ‘tesco’ search queries to Twit-ter. Regarding the general annotated subset of the ‘tesco’ dataset, before 27th 7:00 a.m. all most frequent terms are either stop words (including Twitter jargon) and terms related with the main Tesco PLC business. Even though, we can distinguish a set of terms related with a specific Tesco campaign (the one previously mentioned in the appearance of #essothursdays in blue) and also a topic ‘January blues’ which can be considered seasonal in the UK, even in the context of a dataset specific for the company Tesco PLC. Just after the announce-ment, the scene totally changed and neither the campaign nor the seasonal topic appear but they are replaced by terms related to the Tesco PLC merge with Booker. Therefore, topic discovering exhibits the same kind of disturbance than hashtags, that is, the impact of the merge can be perceived in the ‘tesco’ general subsetafter the announcement. After this analysis, we can establish the fulfilment of the completeRQ1: Given that $cashtag-content has a clear financial orientation, this financial burden can also be perceived in the #hashtag dynamics and in the general content. So that, Twitter is highly permeable to the financial event considered in this experiment.
Regarding thefinancially-oriented subsetof ‘tesco’, the most frequent terms are obvi-ously related with Tesco PLC financial perspective before and after the announcement but,
Sto p W or d s M a in B u siness F in a nci a l Action -1.00 0.75 2.50 4.25 6.00 2 5 7 9
Stop Words Twitter Jargon Seasonal Campaign Main Business Tesco Undetermined Financial Overstatement The action
Pre-announcement Post-announcement
Fig. 9 Evolution of Main topics in the ‘tesco’ corpus
once again, the scene changes totally from one day to another. With the financial lens the filtering vocabulary provides, a topic emerges referring to another relevant financial event related with Tesco PLC. On Jan 24th, a Tesco spokesman announced that the firm was facing a claim for damages about profit overstatement. This topic is, therefore, relevant enough to emerge in the financial subset but is disguised by the contents related with the main business in the general subset. What we have is a financial event, in the same company, which does not surpass the imaginary threshold of permeability to the general Twittersphere. This can be clearly perceived in the Fig.9where bubbles are coloured according to the main topics (green scale for financial and yellow scale for main business, grey for Tesco in the middle of these two worlds) and sized according to the number of term occurrences. A big green bub-ble appears in the general post-announcement subset but, in the financially-oriented subset, the green bubble related to the overstatement is replaced by the green bubble related to the merge.
8 Impact on polarity
Unlike topic modelling, sentiment analysis is about applying natural language processing (NLP) to mine the subjective impression beyond the actual facts and to measure the indi-vidual sentiment or reactions toward certain products, people or ideas by revealing the contextual polarity of the information. The python libraryTextBlob, [31] was used to dis-cern how positive or negative the sentiment in the tweet is. It is worth stating at the outset that we do the analysis with the same polarity classifier in two quite different datasets, the more general ‘tesco’ data, which contains plenty of sentiments, and the financial $TSCO dataset under the lens of the cashtag, more oriented to facts or as much opinions than senti-ment behind human beings. Also, we used a polarity classifier previously trained on general
Tweets and not specifically trained for financial content and its peculiar jargon. With all these precautions in mind, and taking into account that we are facing a single event, we provide an interpretation of the sentiment analysis (Table7) supported by the knowledge acquired throughout the previous sections.
Regarding the ‘tesco’ dataset, the analysis during the regular period in the experiment exhibits a 33.19% positive, 44.54% neutral and 22.27% negative sentiment load. Contrarily, just before the announcement the same dataset increases its positive sentiment to 55.2% which seems to be a result of the GB Esso promotional campaign to obtain 100 Tesco Voucher. Although this promotional campaign continues much time after the announcement, the sentiment in the ‘tesco’ dataset turned into more neutral, 67.1%, due to the penetration of the news about the Tesco & Booker merge to the general Twitter audience. Given that this information is for the general public more factual than sentimental, neutrality increases just before the announcement. The analysis of the $TSCO dataset is the reverse way, tweets under the $TSCO umbrella are usually factual or neutral, or at least neutral for a general polarity classifier, but when an impacting financial event occurs neutrality vanishes and a bi-polarity emerges in response to the merge. Some example tweets and their corresponding polarity are provided for illustrative purposes only in Table8. To conclude, and with the precautions mentioned, we can establish the fulfilment ofRQ2so we can perceive change in sentiment related to the financial event through time.
9 Geographical impact of the action
Although Twitter is one of the most used data sources in data mining, the geo-location component of Twitter is not comparable to other data sources which we can refer to as Location-based social networks. In fact, according to [33], the geo-located tweets returned by the Streaming API cover up to 90% of the geo-located tweets extracted from Firehose API. However, this study also reveals that the number of geo-located tweets is low, being only a 1.45% of the tweets obtained from Firehose API and 3.17% of the tweets obtained from Streaming API. The total percentage of Tweets geo-located in the ‘tesco’ dataset is consistent with this previous study (Morstatter, Pfeffer, Liu, & Carley, 2013), with a per-centage of 4.3% for all the periods in the experiment. Although the number of tweets in the $TSCO dataset may be not representative enough, we should remark that the percent-age of geo-located tweets in the $TSCO dataset is 0%, 1 tweet out of a total of 199. Also,
Table 7 Sentiment Analysis results for the ‘tesco’ and $TSCO dataset
Pre-announcement (25-27 Jan 06:59 am) Announcement (27 07:00am-29 Jan) TUESDAY-WEDNESDAY-THURSDAY FRIDAY-SATURDAY-SUNDAY
‘tesco’ $TSCO ‘tesco’ $TSCO
Tweets % Tweets % Tweets % Tweets %
Positive 181 55.20% 1 12.50% 599 24.60% 30 33.00%
Neutral 90 27.40% 7 87.50% 1636 67.10% 43 47.30%
Negative 57 17.40% 0 0.00% 202 8.30% 18 19.80%
Table 8 Example of tweets in ‘tesco’ and $TSCO’ dataset and their corresponding polarities
Polarity Tesco dataset $TSCO
Positive Tesco merging with Londis ?? f****n love Londis
Good chat with Steve Fox,Booker/Tesco merger is great news for independents, bet-ter access to banking/payment services/ Negative Tesco PLC acquires Booker Group for
3.7B creating the “UK’s leading food business” uniting the power of the UK’s la
The Booker merger means that Londis and Budgens now under the Tesco umbrella.
Neutral Tesco buying Booker Group - dis-astrous for convenience stores who buy stock from Booker Cash&Carry at prices competitive to supe
Tesco & Booker merger (aka takeover): potentially terrible news for independent #retailers & small grocery chains. Stake-holders beware!
there is not variability of those percentages throughout the periods considered (pre- post-and regular). Beyond the percentage of geo-located tweets that the Twitter APIs return, the variation of the geographical distribution of the tweets due to the financial event deserves to be analysed. Figure10shows this distribution and illustrates that there is not much variation if we compare post-announcement with the regular period the same days of the week (10th Feb 07:00 - 12th Feb 23:59 as defined in Table1.
A deeper inspection of the tweets per country in Table9confirms that most of tweets come from the countries where Tesco PLC deploy its main business either under Tesco trademark or thorough subsidiary local companies. Apart from UK and Republic of Ireland, the main retail locations of Tesco PLC all over the world are Czech Republic, Hungary, Poland, Slovakia, Turkey, Malaysia and Thailand. According to the results in Table9, before the announce-ment, the bigger contribution to Twitter volume corresponds to the UK market which is consistent with the historical roots of the company where its retailing business is fully inte-grated in the society. Nevertheless, after the announcement, this percentage decreases in favour of other locations over the world, which is a sign of the global impact of the merge so that twitter users outside UK are not so linked to Tesco PLC marketing campaigns during regular period but they are reactive to a relevant event related with a company with presence in their countries. Nigeria is highlighted in Table9as a country with a definitely high posi-tion according to the number of tweets during the post-announcement despite the fact that Tesco does not having presence in this country. 42 of the 43 tweets in Nigeria has the same
Fig. 10 Geographical distribution of tweets in ‘tesco’ dataset after the announcement and during a regular period
Table 9 Geographical distribution of tweets in ‘tesco’ dataset
content but they are tweeted from 42 different users, not being retweets, so that it may be a violation of the spam terms in Twitter rules. With all the above information, we can estab-lish the fulfilment of theRQ2, so that the event impact on Twitter depends on the location and, moreover, the event distorts the geographical distribution of tweets.
10 Discussion & limitations
Coming back to the fundamental research question addressed in this paper, we sustain and successfully confirmed that “Twitter (although not a specific financial forum) is permeable to financial events and this permeability can be analysed by monitoring (1) the name of companies as a keyword, (2) the Cashtag of the company and (3) the hashtags related to that company.” The results of the experiment on the announcement about the merge of Tesco PLC and Booker Group PLC on the 27th January 2017 show that theTwittesphereis permeable to the financial market dynamics thanks to the tweets of a variety of different contributors. The merge impacted on all the Tesco-related content in Twitter in terms of volume, having a higher impact on $cashtag-content but is altering the tweets’ topics in comparison to regular behaviour (altering #hashtag dynamics and tweets’ content). Also, with the precautions of a single experiment, we also observed changes in polarity and in the geographical distribution of the contributes through time. Finally, the good freshness characteristics of Twitter as news media is confirmed by the rapidness of response to the RNS announcement.
Therefore, the experiment was successful in confirming that a far-impacting financial event causes disturbance in all the features considered in relation with Twitter perme-ability: information volume, content and sentiment as well as geographical provenance. Nevertheless, the experiment had a little success in identifying some rumour or sign of the announcement prior to the event. Even considering that the experiment was not deployed over the whole Firehose Twitter data, uncovering rumours before the announcement turns definitively into a hard task, if the spreading of rumours in real life is not mimicked inside Twitter, that means, if the rumour is not in Twitter at all. At this respect, and according to [30], social media data can only be generalised to human behaviour when social media provides a representative description of human activity. Twitter is a social media which, at least, exhibits some demographic bias. Moreover, Twitter may be providing a skewed rep-resentation of content. Although well-known rumour detection algorithms [51,53] can be applied to Twitter, an alternative approach can be the fusion of financial information from different data sources in a way that we can mitigate the inevitable bias in a single source, and, at the same time, combine their weaknesses and strengthens in a proper representation of the real financial activity.
As mentioned, the experiment in this paper addresses a well known financial market event as a first step to adapt the methodology to low impacting events. Presumably, finan-cial events with fully coverage in the media (sofinan-cial media, news, tv) would have a major impact on the whole Twittersphere, meanwhile financial events in sectors not so attractive to
the general public as retailing or, not so covered by non financial media, would have lower impact on Twittersphere but remain impacting inside Twitter financial sphere. The perme-ability and patterns of change in hashtag and cashtag should be adjusted according to theses conditions. The real deployment of a continuous real-time monitoring system for irregular-ities coming from financial actions will be based on mining social media and establishing patterns for the time series of cashtag and hashtags and topics (bag-of-words) so we can apply and ARIMA (Autoregressive moving average model) to avoid noise and distinguish the stationary behaviour form the tending one. The continuous adjustments of the patterns, the bag of words and outlier detection techniques will be easily scalable to the huge quantity of data by a map-reduce implementation and a cloud deployment.
11 Conclusions
This paper inspects the permeability of Twitter to financial events in order to provide evi-dence which allows Twitter to be used as a social sensor for the financial and stock market. To do that, this permeability should be checked and measured. This a single experiment for a single financial that had been fully covered by traditional media as well as social media. Bearing this in mind, we can conclude that the event in the financial market invaded the Twittersphere on the 27th January 2017, just after the RNS announcement at 7:00, and that the behaviour of the triplet ($TSCO, #[tesco], “tesco”) was altered in comparison with the regular behaviour around the company involved in the financial event. At the same time, the experiment shows that other financial events that affected the company (overstatement) during the very same period were only permeable to the more financial oriented tweets and users. As many other social networks, homophily [14] exists in the context of Twitter, that is, the tendency to interact with similar individuals in respect to several dimensions such as age, location, and occupation, etc. The experiment in this paper shows that the high impact of the merge action crosses the fragile boundary between users with specific financial inter-ests (highly connected to each other) to the general audience in Twitter. However, this work has not studied the profile of the users in general audience that are captured by the Tesco merge, or, to put in another way, to which kind of homophilic words the information flows out from the experts in the stock market.
As mentioned before, this Twitter study is framed by a a joint project that pursue the construction of a Data Fusion Model and an Ecosystem to monitor the financial market, which is increasingly demanded given the irruption of FinTech technologies and the subse-quent increase of non expert traders, automatic trading systems, cryptocurrencies, HFT, etc. The lack of integration between financial stock market data, social media comments, finan-cial discussion board posts and broker agencies means that the benefits of data fusion are not being realised to their full potential. Our proposed ecosystem [20], inspired by the data fusion model introduced by JDL (Joint Directors of Laboratories [52]), pursue the fusing of disparate data sources relating to financial stocks; data with a diverse set of features from different data sources will supplement each other in order to obtain a Smart Data Layer, which will assist in scenarios of irregularity detection.
Acknowledgments This work was funded by Spanish Ministry of Education Culture and Sports, National Plan for Scientific and Technical Research and Innovation (Sub-Programme for Mobility) under the research stay grant PRIX16/00368. We thank the Manchester Metropolitan University (School of Computing Math-ematics and Digital Technology) for its support during the research stay. This work is also partially funded by the Spanish Ministry of Economy and Competitiveness under the National Science Program (TEC2014-54335-C4-3-R, TEC2017-84197-C4-2-R).