Challenges for Performance Analysis in
High-Performance Reconfigurable Computing
Seth Koehler, John Curreri, and Alan D. George
NSF Center for High-Performance Reconfigurable Computing (CHREC)
HCS Research Lab, ECE Department, University of Florida
Email:
{
koehler, curreri, george
}
@chrec.org
Abstract
Reconfigurable computing (RC) applications em-ploying both microprocessors and reconfigurable hard-ware (e.g., FPGAs) have the potential for large speedup when compared with traditional parallel applications. However, this potential is marred by the additional com-plexity of these dual-paradigm systems, making it diffi-cult to achieve the desired performance. For parallel software applications (e.g., in MPI), performance anal-ysis tools are well researched and widely available, aid-ing designers in understandaid-ing the dynamic behavior of their applications. Unfortunately, for RC applica-tions, such concepts and tools are lacking, despite be-ing of great importance due to the increased complexity of these applications. In this paper, we explore chal-lenges faced in attaining automated techniques for in-strumentation and low-overhead runtime measurement of diverse resources in RC systems. We present ideas for the integration of these techniques into existing perfor-mance analysis tools for conventional parallel systems with the goal of creating a unified analysis tool for RC applications. Results from a case study are provided us-ing a prototype of this new tool.
1. Introduction
As parallel computing systems (e.g., multicore CPUs, clusters, etc.), multiprocessor systems-on-chip (MPSoC), and reconfigurable computing (RC) systems continue to mature, the amount of processing power available to applications continues to increase. RC ap-plications employ both microprocessors and reconfig-urable hardware such as FPGAs to handle computation-ally intensive problems. These RC applications have the potential to achieve orders-of-magnitude performance gains, using less power and hardware resources than conventional software applications [1], [2]. However,
the behavior of an RC application can be particularly difficult to track and understand due to additional levels of parallelism and complex interactions between hetero-geneous resources inherent in such systems [2]. High-performance RC applications are by definition a super-set of traditional parallel computing applications, con-taining all the problems and complexity of these appli-cations and more due to their use of both micropro-cessors and FPGAs. To handle this complexity, per-formance analysis1 tools will be indispensable in ap-plication analysis and optimization, even more so than in parallel computing applications where such tools are already commonly used and highly valued.
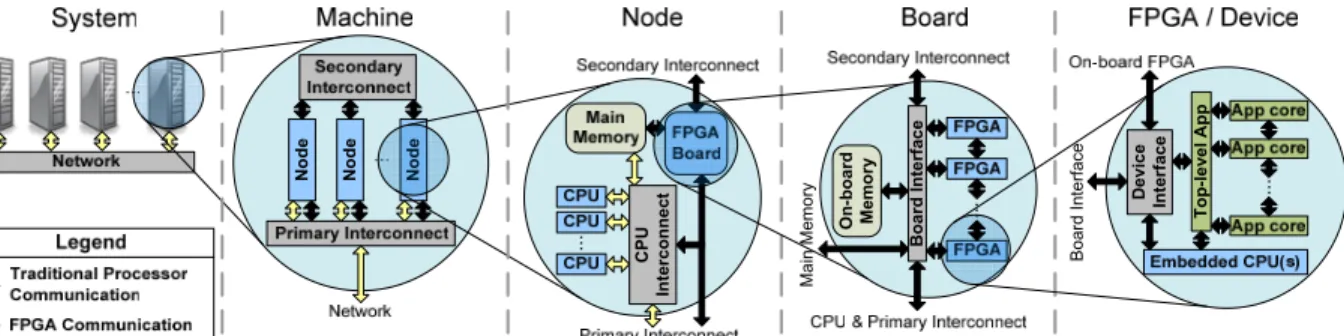
Unfortunately, traditional performance analysis tools are only equipped to monitor application behav-ior from the CPU’s perspective. Systems such as the Cray XD1 [3] or those employing Opteron-socket-compatible FPGA boards (e.g., XtremeData [4] or DRC [5]) are advancing the FPGA from slave to peer with CPUs, enabling the FPGA to independently interact with resources including main memory, other CPUs, and other FPGAs. Due to the increasingly significant role FPGAs play in RC applications, conventional tools have an increasingly incomplete view of application performance, yielding the need for hardware-aware per-formance analysis tools that can provide a complete view of RC application performance. To illustrate this need, Figure 1 shows the hierarchy of parallelism and myriad of interactions inside an RC computer, differ-entiating between communications that can be moni-tored (light arrows) and others that cannot (dark arrows) by traditional performance analysis tools. With FPGA communication paths to CPUs, other FPGAs, and vari-ous levels of memory, the amount of unmonitored com-munication is significant, hindering the designer’s abil-ity to understand and improve application performance. 1Throughout this paper, performance analysis refers to
experimen-tal performance analysis (i.e., studying application behavior on an actual system at runtime).
N o d e N o d e N o d e O n -b o a rd M e m o ry .. . M a in M e m o ry De v ic e In te rf a c e .. . B o a rd I n te rf a c e .. . B o a rd I n te rf a ce C P U In te rc o n n e c t T o p -l e v e l A p p
Figure 1: Potential communication bottlenecks (represented by arrows) in an RC application In this paper, we explore the challenges faced in
attaining low-overhead, automatable techniques for in-strumentation and runtime measurement of RC applica-tions. We also present concepts for the integration of these techniques into an existing parallel performance analysis tool, Parallel Performance Wizard (PPW), with the goal of creating a unified performance analysis tool for RC applications. Section 2 discusses background and prior work related to performance analysis in soft-ware and RC. Section 3 then explores the challenges and techniques for performance analysis of RC applica-tions. Next, Section 4 provides a case study to demon-strate the overhead, benefits, and importance of perfor-mance analysis in RC applications using a prototype of our hardware measurement module. Finally, Section 5 concludes and gives directions for future work.
2. Background & related research
The goal of performance analysis is to understand a program’s runtime behavior on a given system in order to locate and alleviate performance bottlenecks. For parallel-computing applications, Maloney’s TAU framework [6] and Chung et al.’s recent study of per-formance analysis tools on the Blue Gene/L [7] pro-vide a good introduction to the various challenges, tech-niques, and tools in performance analysis. Performance analysis can generally be decomposed into five stages (shown in Figure 2): instrument, measure, analyze, present, and optimize. Instrumentation is the process of gaining access to application (or system) data to be measured and stored at runtime. Measurementis then the act of recording and storing data while the appli-cation is executed on the target system. The resulting measured data is nextpresentedvia visualizations and analyzed by the application designer to locate poten-tial performance bottlenecks. Optionally, some analysis may be automated, allowing visualizations to be aug-mented with the locations of potential bottlenecks. The designer then optimizes the application, attempting to remove performance bottlenecks discovered in the
pre-vious stages. These steps may then be repeated until desired performance is achieved or no further perfor-mance gains seem likely.
Original Application Instrument Execute Measure Analyze (Automatically) Present Optimize
Measured Data File
Execution Environment Visualizations Instrumented Application Potential Bottlenecks Analyze (Manually) Modified Application Optimized Application
Figure 2: Stages of performance analysis Performance analysis should not be confused with analytical models or simulation, which provide esti-mates of application performance that must eventually be verified against actual performance. Performance analysis is essential to capture actual application be-havior on a given target system for the purposes of op-timization. Similarly, although debug techniques can be useful to performance analysis, this overlap is lim-ited by fundamental differences in their purpose. For example, debug techniques such as breakpointing and FPGA readback must stop the FPGA application in or-der to retrieve data [8]. Unfortunately, this technique effectively isolates the FPGA from the rest of the sys-tem, which typically cannot be paused. While isolation is encouraged in debugging, it is extremely problem-atic in performance analysis since component interac-tion in the system is a key factor. Tools such as Altera’s SignalTap [9] and Xilinx’s ChipScope [10] do allow an FPGA to run at or near full speed in a system (minimiz-ing changes to application behavior), but are designed to monitor exact values at each cycle over a given pe-riod to ensure correctness, much like a logic analyzer. In contrast, performance analysis assumes correctness
and is instead concerned with timeliness of application progress, often allowing data to be summarized or ig-nored. By reducing the data recorded, fewer storage and communication resources are necessary to monitor an application, minimizing the distortion of the origi-nal application’s behavior. In addition, Sigorigi-nalTap and ChipScope require separate connectors (e.g., JTAG) to acquire data, which are not readily accommodated or available for many systems.
While some preliminary work exists in RC perfor-mance analysis, this field is significantly less mature than its software counterpart. DeVille et al.’s paper in-vestigates the use of distributed and centralized perfor-mance analysis probes in an FPGA, but is limited in scope to efficient measurement within a single FPGA [11]. Schulz et al.’s OWL framework paper proposes use of FPGAs for system-level performance analysis, monitoring system components such as cache lines, buses, etc. However, their work is directed at monitor-ing software behavior from hardware, rather than mon-itoring hardware itself [12].
3. Challenges for RC performance analysis
Significant challenges exist in each of the five stages of performance analysis. Instrumentation and measurement form the foundation of performance anal-ysis that is built upon by analanal-ysis, presentation, and op-timization. Thus, our focus in this paper will be instru-mentation and measurement. We also briefly present challenges in presentation as well as concepts toward a unified performance analysis tool. As automating anal-ysis and optimization are still open research areas (and often performed manually), these topics are beyond the scope of this paper. Within instrumentation and mea-surement, the key goals of performance analysis tools are the following (adapted from [6]):1. Perturb the original application’s behavior as little as possible (minimize impact).
2. Record sufficient detail & structure to accurately re-construct application behavior (maximize fidelity). 3. Allow flexibility to monitor diverse applications and
systems (maximize adaptability and portability). 4. Require as little effort and trouble for the designer
as possible (minimize inconvenience).
Goals 1 and 2 are opposed to one another, as are Goals 3 and 4. Thus, the challenges faced generally stem from attempting to reach a compromise.
3.1. Challenges for hardware instrumentation
Instrumenting a hardware design involves gaining entry points to signals (i.e., wires) in the application.
A logic analyzer exemplifies this process with logic probes connected to external pins that are in turn con-nected to values of interest in the application. By taking advantage of the reconfigurability of an FPGA, we can use the built-in routing resources to temporarily access application data, gaining the necessary entry points for measurement. Instrumentation involves choosingwhat data to instrument, choosingthe level(s) of instrumen-tation(e.g., source, binary, etc.), and finallymodifying the applicationat the chosen level to gain access to the selected data. These issues are discussed in the follow-ing subsections.
3.1.1. What to instrument
Instrumenting an application begins with a selec-tive process that determines what data to record and what to ignore. The data chosen should reflect appli-cation behavior as closely as possible while simultane-ously minimizing perturbation of that behavior (Goals 1 and 2). While application knowledge is useful in mak-ing these selections, it is desirable to automate this time-consuming process when possible (Goal 4). In addition, automation is essential if hardware was generated from a high-level language (HLL), as the designer will not be aware of the implementation details. Software perfor-mance analysis has demonstrated that such automation is possible by using knowledge of what constitutes a common performance bottleneck to guide instrumenta-tion. Thus, one key challenge in FPGA instrumentation is determining common performance bottlenecks in a typical FPGA design.
Applications consist of communication and com-putation, both of which must be monitored to un-derstand application behavior. Software performance analysis typically monitors specific constructs that in-voke communication explicitly or implicitly through synchronization primitives such as barriers, and locks. Computation is typically monitored by timing function calls or other control structures such as loops, which in hardware is similar to the control of subcompo-nents, such as through a state machine, pipeline, or loop counter. Thus, these hardware communication and control constructs provide a starting point for studying common performance bottlenecks in an FPGA.
In an FPGA, communication includes off-board (e.g., to another FPGA, CPU, main memory, etc.), on-board (e.g., to on-on-board DDR memory or other FP-GAs connected to the FPGA on-board), or on-chip (be-tween components inside the FPGA device) commu-nication. Communication off-board and on-board is widely known to be problematic in FPGA-based system designs, but on-chip communication can be a significant
bottleneck as well, especially if some form of routing network or data distribution is implemented in the de-sign (a common technique used in applications contain-ing multiple cores to exploit parallelism). Instrument-ing on-chip communication between components such as frequency of communication or bytes transferred can help the designer to better understand how the compo-nent is used. However, due to the large amount of par-allelism possible in an FPGA, monitoring all on-chip communication can incur significant overhead.
Control can become a bottleneck when too many cycles are used for setup, completion, or bookkeeping tasks. However, the primary reason for instrumenting control is to gain insight into the application’s behavior, helping the designer to locate other bottlenecks. As an example, if a state machine contains a state that waits for data from an FFT core, recording the number of cy-cles spent in this wait-state can determine whether the FFT core is a bottleneck in the application. This infor-mation is comparable to a software performance analy-sis tool monitoring the amount of time an FFT subrou-tine required.
It is important to note that instrumentation should be restricted to clocked elements in hardware. Synthesis and place-and-route tools already optimize delays asso-ciated with unclocked (combinatorial) signals; these de-lays can be analyzed via timing analysis, simulation, or debugging tools. However, even in designs that are pri-marily combinatorial, there is inevitably some clocked portion of the design that handles control or communi-cation (and often multiple levels of communicommuni-cation and control), demonstrating the wide applicability of these areas across designs (Goal 3).
Thus, communication and control are reasonable points to instrument initially. However, application knowledge can often give further insight into what should be instrumented. Certain control and commu-nication may be unnecessary to monitor in a specific application; performance may be better understood by monitoring a specific input value to a component. This application knowledge is extremely difficult to auto-mate, and thus determining what to instrument remains a significant challenge in RC performance analysis.
3.1.2. Levels of instrumentation
Before reaching the challenge of modifying an ap-plication for analysis, the level at which instrumenta-tion will occur must be selected. The hardware porinstrumenta-tion of an RC application can be instrumented at any level between source code (HDL) and bit file (binary loaded directly onto the FPGA). While it is also possible to use system-level instrumentation (e.g., OWL [12] discussed
in Section 2), this approach lacks portability due to the requirement of dedicated hardware to monitor system components such as cache lines, buses, etc. In addition, data unrelated to the application is also captured, such as the behavior of the operating system and other run-ning applications, making system-level instrumentation less suitable for performance analysis of aspecific ap-plication; thus, system-level instrumentation is not con-sidered further here.
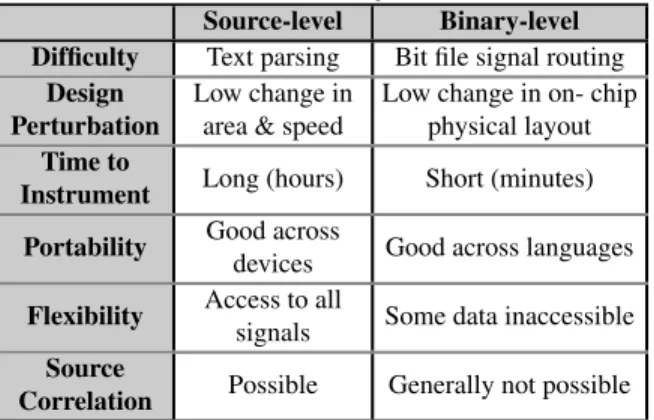
Graham et al. provides an excellent look at the var-ious levels and tradeoffs of application-level instrumen-tation inside an FPGA [13]. They indicate that while in-strumenting at intermediate levels between source code and binary offers some advantages (e.g., modifying clean abstract syntax trees as opposed to source code or binaries), these advantages are not significant enough to counterbalance the poor documentation and difficulty of accessing these levels (some levels occur only in mem-ory during synthesis). Thus, the levels of instrumen-tation are in practice polarized into source-level and binary-level instrumentation.
Source instrumentation is attractive since it is eas-ier to implement, fairly portable across devices, flexible with respect to which signals can be monitored, and of-ten minimizes the change in area and speed of the in-strumented design due to optimization of the design af-ter instrumentation. Source instrumentation also offers the possibility of source correlation, allowing behavior to be linked back to source code, although the mean-ing and implementation of this correlation is less clear in a language modeling hardware than in one modeling execution of instructions on a CPU.
By contrast, binary-level instrumentation is attrac-tive because it requires less time to instrument a design (e.g., minutes instead of hours as it occurs after place-and-route), is portable across languages for a specific device, and perturbs the design layout less, again since it is mostly added after the design has been optimized and implemented. Unfortunately, binary instrumenta-tion loses some flexibility since synthesis and imple-mentation may have significantly transformed or elimi-nated some data during optimization or made some data inaccessible via the FPGA routing fabric. Links be-tween behavior and source are also lost. Applying in-strumentation at both levels is also possible, allowing the designer to select the appropriate compromise for each instrumented datum. Table 1 provides a summary of this comparison.
3.1.3. Modifying the application
Once an instrumentation level has been selected, the application must be modified to allow access to
Table 1: Source vs. binary instrumentation
Source-level Binary-level Difficulty Text parsing Bit file signal routing
Design Perturbation
Low change in area & speed
Low change in on- chip physical layout
Time to
Instrument Long (hours) Short (minutes) Portability Good across
devices Good across languages
Flexibility Access to all
signals Some data inaccessible
Source
Correlation Possible Generally not possible
whatever data has been chosen for instrumentation. While both source and binary instrumentation can draw heavily from similar techniques in both software and FPGA debugging, automatically inserting instrumenta-tion based upon the decision to instrument control and communication (discussed in Section 3.1.1) still poses a challenge for FPGA instrumentation. While software performance analysis often scans source code for spe-cific API calls that are harbingers of communication (e.g., an MPI Send call in an MPI program), FPGA communication and control are more difficult to detect. Source-level instrumentation for hardware can em-ploy a preprocessor to scan application code and in-sert lines to extract the desired data at runtime (e.g., in VHDL, the component interface can be modified to al-low access to performance data). The challenge here lies in the expressiveness of the given language; the pre-processor must be able to cope with the various ways in which a designer may structure or express the behavior of their application. For example, the use of an enumer-ated type in VHDL along with a clocked case statement using it would usually suggest a state machine. How-ever, the same structure could be represented with con-stants and a complicated if-then-else structure.
Binary-level instrumentation suffers similar diffi-culties. Now control and communication must be tected from a fully optimized and implemented de-sign. While escaping the problem of the source lan-guage’s expressiveness, the hierarchy and structure be-hind much of the application has been flattened and re-formed during synthesis and implementation. Given a set of physical lookup tables (LUTs) in the FPGA to monitor, binary-level instrumentation can be performed by synthesizing and implementing the original design as usual, save the need to reserve space and connection points for the measurement device. After synthesis and implementation, tools such as Xilinx’s JBits SDK [14] can be used to place the measurement framework in the device and route signals to it from the application.
3.2. Challenges for hardware measurement
Measurement is concerned with how to record and store data selected during instrumentation. An integral challenge of this process is to record enough data to un-derstand application behavior while at the same time minimizing perturbation caused by recording (Goals 1 and 2). Due to limited resources and a lack of resource virtualization on an FPGA, resource sharing between the application and measurement framework presents a unique challenge for RC performance analysis.
3.2.1. Recording and storing performance data
To balance fidelity and overhead, software per-formance analysis employs techniques such as trac-ing (recordtrac-ing the event time and associated data) and profiling (recording summary statistics and trends, not when specific events occurred). These methods can be triggered to record information under specific condi-tions (event-based) or periodically (sampling). The ef-ficacy of one technique over another is dependent upon what behavior needs to be observed in the application.
Tracing is the methodology of recording data and the current time (based on a device clock), allowing du-ration and relative ordering of events to be analyzed. To maintain event ordering between devices, clock offset and drift must be periodically monitored on all CPUs and FPGAs; methods such as those in [15] estimate round-trip delay, enabling clock drift to be corrected postmortem. While closely related to hardware debug-ging, tracing in performance analysis must be sustain-able for an indefinite period of time in order to capture application behavior (debug techniques often record un-til memory is exhausted). To reduce the amount of data recorded, event-based tracing records data only un-der specified conditions, whereas sample-based tracing records data periodically. Based on the event condi-tions or sampling frequency, a different compromise is reached between fidelity and perturbation.
Profiling differs from tracing in that no specific event timing is stored. Rather, summary statistics of the data are maintained, usually with simple counters that are extremely fast and fairly small. Profiling sacrifices some of the fidelity of tracing for less perturbation of the design. Profile counters can provide statistics such as totals, maximums, minimums, averages, and even variance and standard deviation, although at the cost of additional hardware (and possible performance degra-dation). Like tracing, profile counters can be updated based upon an event or periodically (sampling).
One significant difference between software and hardware performance analysis with respect to profiling and tracing is parallelism. While software measurement
requires additional instructions to profile or trace the application that generally degrade performance, profile counters and trace buffers can work independently of the application and each other in hardware. Thus, hard-ware performance analysis can incur no performance degradation if sufficient resources are available and the maximum design frequency is unaffected. In addition, it is possible to monitor extremely fine-grain events, even those occurring every cycle. Another significant difference involves resource availability. While pro-filing typically requires far less memory than tracing, profile counters that must be accessed simultaneously will likely be placed in logic cells on an FPGA rather than block RAM. Unfortunately, logic cells are scarce in comparison to block RAM, the latter of which is suit-able for tracing. For example, 512 36-bit profile coun-ters require 16.7% of logic cells in a Xilinx Virtex-4 LX100 device, and yet could be stored in a single block RAM (representing only 0.4% of block RAM on the same device) [16]. Unfortunately, block RAM can be limiting as well when tracing (e.g., the LX100 contains only 540KB of block RAM) [16]. In contrast, soft-ware performance analysis has hundreds of megabytes of memory or more to store profile and trace data.
In hardware, the tradeoffs between tracing and pro-filing provide a significant challenge to automating the selection of the measurement type to use for a specific signal in an FPGA. While the designer may recognize data that would be problematic for tracing or poorly rep-resented by profile counters, this knowledge is rarely explicit in the application code or bit file. Worse, once a selection has been made, the measurement framework necessary to monitor this selection may not fit in the remaining logic or memory on the FPGA, or the mea-surement framework may cause significant degradation of the maximum frequency at which the application can run. Thus, finding a balance between perturbation and fidelity may require significant knowledge of both the application and tradeoffs in measurement strategies.
3.2.2. Managing shared resources
One of the greatest challenges in RC performance analysis is the management of shared resources that were once exclusively controlled by the application. Al-though the sharing of on-chip resources is important, this sharing is handled by the synthesis and implemen-tation tool, and thus is of less concern. Off-chip com-munication sharing is more difficult due to the limited number of communication paths. While recording data would ideally require no off-chip communication, lim-ited FPGA memory necessitates periodic transfers of performance data to a larger storage medium at runtime.
Software performance analysis tools can share memory, communication, and processor time with the application through operating system and hardware vir-tualization (processes, virtual memory, sockets, etc.). FPGAs have none of this infrastructure, requiring per-formance analysis to handle these complexities man-ually. To share the FPGA interconnect, performance analysis frameworks must ensure performance and ap-plication data can be distinguished so that each is deliv-ered to the correct location, usually by allocating mem-ory and address space for performance data to use ex-clusively. Arbitration between the application and per-formance analysis hardware is also necessary to ensure that only one can access the interconnect at a time.
One added complexity is that the communication architecture may only allow the CPU to initiate a data transfer from the FPGA to main memory. This scenario can be handled by instrumenting the application soft-ware to periodically poll the performance analysis hard-ware for data, either directly between other application tasks or via a separate process or thread. If supported, interrupts can be used to have the CPU initiate a trans-fer, although interrupts are often scarce and thus may need to be shared if used by the application. When pro-cesses, threads, or interrupts are used, the application and performance monitoring software must use locks to guarantee they do not access the FPGA simultaneously. It is important to note that while measurement de-termines the need for communication sharing, instru-mentation is affected as well, since it must now be aware of these communication schemes and seamlessly integrate with them. Communication schemes such as memory maps or network packets are used with a vari-ety of interconnects. Combined with diverse APIs for FPGAs, virtualizing communication is a major chal-lenge for RC performance analysis.
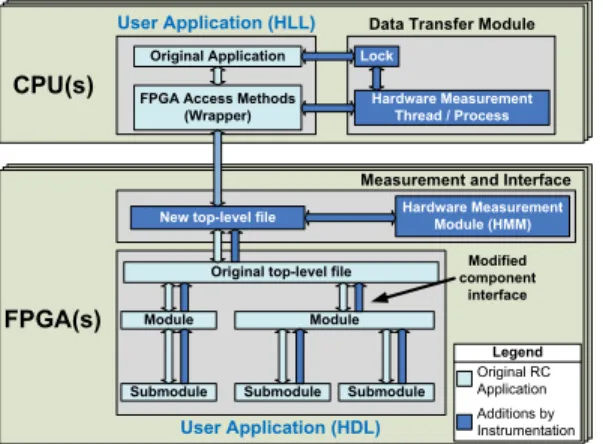
Figure 3 illustrates the possible changes to an RC application during instrumentation in order to support measurement. In hardware, component interfaces are modified to allow performance data to be accessed, and a new top-level file is added to control communication access between the original application and the perfor-mance analysis module. In addition, the communica-tion path between the CPU and FPGA is now shared and controlled by the new top-level file. In software, a data transfer module is added to support CPU-initiated performance transfers. Modifications to the HLL source are also necessary to retrieve performance data.
3.3. Challenges in performance presentation
Current trace-based displays such as Jumpshot [17] show communication and computation for parallel
com-Original top-level file Module Submodule Modified component interface User Application (HLL) Hardware Measurement Thread / Process Lock CPU(s)
FPGA Access Methods (Wrapper) Original Application
Data Transfer Module
FPGA(s)
User Application (HDL)
Measurement and Interface Hardware Measurement
Module (HMM)
Submodule Submodule Module New top-level file
Legend Original RC Application Additions by Instrumentation
Figure 3: Additions made by source-level instrumentation of an RC application puting applications. These displays can be extended to include FPGAs as additional processing elements for RC applications. A visualization (mockup) example is shown in Figure 4. In this example, the CPUs (nodes 0-7) are actively completing their work and receiving data from the FPGAs (nodes 8-15). Nodes 3 (CPU) and 11 (FPGA) are idle while most processors finish the cur-rent iteration somewhere in the middle of the diagram. Nodes 4 and 12 are lagging, completing towards the end of the interval and finally allowing global synchroniza-tion of all nodes before a new iterasynchroniza-tion begins.
Figure 4: Mockup Jumpshot visualization of an RC application with 8 CPUs and 8 FPGAs Unfortunately, trace-based displays scale poorly with system size. If the performance data included hun-dreds of CPUs and FPGAs communicating with each other, this diagram may become ineffective. Worse yet, the classification of an FPGA as a single processing el-ement above does not accurately account for the levels of parallelism inside the FPGA. Treating the FPGA as a multicore processor may be inadequate as well if the FPGA design uses different cores in the same device or possibly in a hierarchy.
Hierarchical views of clusters such as Ganglia [18] have been developed and could be useful in large-scale RC systems for displaying heterogeneous devices and behavior. Finding the right balance between abstraction
and detail in large-scale visualizations remains a signifi-cant challenge in presentation for parallel computing as well as RC.
3.4. Unified performance analysis tool
To create a holistic view of an RC application’s behavior, a unified software/hardware tool is essential. Separate tools will give a disjointed view of the sys-tem, requiring significant effort to stitch the two views back together. In addition, each tool must make deci-sions about instrumentation and measurement without any knowledge of what is being monitored by the other. A unified tool could potentially take advantage of strate-gically choosing where to monitor a specific event, such as software, hardware, or both, based upon factors such as efficiency, difficulty in accessing information, and accuracy of that information. Also, some instrumen-tation and measurement techniques require complimen-tary modifications to software and hardware (e.g., mod-ifying a memory map to allow CPU-initiated transfers of performance data).
We use the Parallel Performance Wizard (PPW) [19] as a specific software performance analysis tool to discuss integration here, although these concepts apply to other tools as well. PPW supports performance anal-ysis for Partitioned Global Address Space (PGAS) pro-gramming languages such as UPC and SHMEM (with addition of MPI support planned) via the Global Ad-dress Space Performance (GASP) interface [20], which is currently implemented by compilers such as Berke-ley’s UPC and gcc-upc. Based on a specific language, many constructs such as synchronization primitives will warrant monitoring, which the compiler instruments by using event callback functions (user-definable events are also possible). These events can then be received by any tool supporting the GASP interface, where the tool can choose to profile, trace, or ignore these events. To track FPGA activity from software, the GASP interface could be extended with generic events such as FPGA reset, configure, send, and receive. Upon receiving an FPGA event, the performance tool could store information such as bytes transferred, time taken to configure the FPGA, or transfer latency, providing a detailed view of FPGA communication from soft-ware. However, automatically adding these extended GASP functions around FPGA communication is dif-ficult; FPGA communication can appear in a variety of ways in software, including vendor APIs, pointers, and I/O calls. Ideally, a standard API for FPGA ac-cess could make detection of FPGA calls trivial. In the absence of such a standard, performance analysis tools must detect each vendor’s FPGA access methods.
4. Case study
To demonstrate the overhead, benefits, and im-portance of RC performance analysis techniques, we present a case study using a prototype version of our hardware measurement module (HMM). The HMM al-lows for profiling and tracing of data via event-based triggering or sampling and uses CPU polling via a sepa-rate thread to periodically transfer performance data off-chip since this is universally supported. Due to porta-bility, flexiporta-bility, and difficulty concerns, instrumenta-tion in our framework is performed at the source level. While instrumentation is currently performed manually, the HMM allows quick customization of (and easy ac-cess to) profile counters and trace buffers, eliminating the time-consuming and error-prone process of manu-ally measuring performance. Figure 5 illustrates the de-sign of our prototype HMM.
Triggers Signal Analysis Module Signals Data Profile Counters 0 1 2 P - 1 Trace Data Trace Data Trace Data Cycle Counter Module Statistics Module Control Request Perf. Data Sample Control signal value comp trigger B u ff e r B lo c k R A M O n -b o a rd M e m o ry (D D R /Q D R ) data ...
Figure 5: Hardware Measurement Module For our case study, we executed the N-Queens benchmark application on two RC systems. The first RC system, the Cray XD1, consists of six nodes, each containing two Opteron 250 CPUs and a Xilinx Virtex-2 Pro 50 FPGA connected via a high-speed interconnect (3.2GB/s ideal peak) [3]. The second RC system is a 16-node Gigabit Ethernet cluster, each node containing a 3.2GHz Intel Xeon EM64T processor and a Nallatech H101-PCIXM application accelerator [21] employing a Xilinx Virtex-4 LX100 user FPGA and connected via a PCI-X bus (1GB/s ideal peak). The N-Queens applica-tion was implemented using UPC (software) and VHDL (hardware). Compilation for the Cray XD1 was per-formed using Synplicity’s Synplify Pro 8.6.2, Xilinx’s ISE 7.1.04i, and Berkeley UPC 2.4.0. Compilation for the cluster was performed using Nallatech’s Dimetalk 3.1.5, Xilinx’s ISE 9.1.03i, and Berkeley UPC 2.4.0.
The N-Queens problem asks for the number of dis-tinct ways thatN queens can be placed onto anN xN
chessboard such that no two queens can attack each other [22]. As only one queen can be in each column, a simple algorithm was employed to check all possible
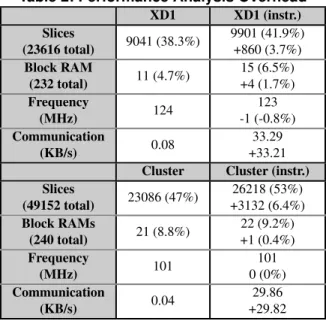
positions via a back-tracking, depth-first search. Par-allelism was exploited by assigning two queens within the first two columns; each core then receives a partial-board and generates all possible solutions by moving queens in the remainingN−2columns, returning the number of solutions to software. The program was exe-cuted on both RC systems using a board size of16×16. The N-Queens application was first executed without hardware instrumentation to acquire baseline timing, and then with instrumentation to collect measured data. The HMM was configured to include 16 profile counters in each FPGA (six for monitoring application commu-nication, nine for monitoring an N-Queens core state machine, and one to monitor the number of solutions found by that core) and one 2KB trace buffer to moni-tor the exact cycle in which any core in the application completed. The UPC and VHDL code were modified to allow performance data to be transfered at runtime, with the CPU polling the FPGA once per millisecond for per-formance data (the application independently polled the device once per 100 milliseconds). Table 2 provides the overhead incurred by adding instrumentation to the N-Queens cores and periodically measuring profile coun-ters and trace data from the N-Queens application at runtime. From this data, a maximum overhead band-width of 33.3KB/s was observed, which is negligible when compared to the interconnect bandwidth. Less than 7% of the FPGA’s resources and 2% of the block RAM were needed to monitor the application. Fre-quency degradation ranged from 1% on the XD1 to no degradation on the LX100s in the cluster.
Table 2: Performance Analysis Overhead
XD1 XD1 (instr.) Slices (23616 total) 9041 (38.3%) 9901 (41.9%) +860 (3.7%) Block RAM (232 total) 11 (4.7%) 15 (6.5%) +4 (1.7%) Frequency (MHz) 124 123 -1 (-0.8%) Communication (KB/s) 0.08 33.29 +33.21
Cluster Cluster (instr.) Slices (49152 total) 23086 (47%) 26218 (53%) +3132 (6.4%) Block RAMs (240 total) 21 (8.8%) 22 (9.2%) +1 (0.4%) Frequency (MHz) 101 101 0 (0%) Communication (KB/s) 0.04 29.86 +29.82
The number of cycles spent in each state of an N-Queens core state machine was monitored in order to understand a core’s behavior at runtime. While not
ac-cessible from a software performance analysis tool, this information is easily obtained by using as many pro-file counters as there are states, with each counter in-crementing when that state occurs. From this data, the percentage of cycles spent in each state was calculated and is shown in Figure 6. More than a third of the to-tal time is spent determining whether any queens can attack each other. While this state would normally be targeted for optimization, it was already heavily opti-mized, leaving little room for improvement. However, Figure 6 also shows that theReset Attack Checkerstate consumes 12% of the total state machine cycles, which is surprising given the relatively small job that this state performs. Thus, a relatively simple modification was made to combine the Reset Attack Checker state, as well as theFinishedandReset Queen Row, with the re-maining states, giving an ideal speedup of 16.3% versus the non-optimized version, based upon removing these states from the graph. This speedup is ideal as the opti-mization only applies to a portion of the application (ne-glecting setup and communication times). While fre-quency degradation can also affect speedup, a negligi-ble drop in core clock frequency of the optimized ver-sion was observed. The optimized N-Queens core was then measured on the target systems, giving an average speedup of 10.5%. This performance gain was greatly facilitated by the use of hardware performance analy-sis, removing guesswork from understanding the appli-cation’s behavior and aiding in the detection of perfor-mance bottlenecks. Queen Attacking? 37% Finished? 1% Queen Off Board? 12% Move Queen Row? 12% Move Queen Col? 13% Reset Attack Checker 12% Valid Solution? 12% Reset Queen Row 1%
Figure 6: Distribution of cycles spent in core state machines of N-Queens
The trace buffer was used to monitor the cycle in which any core in the device completed in order to un-derstand the penalty of the application’s static schedul-ing, which requires all cores in the device to complete before receiving further work. Tracing data (ignoring trivial completions of invalid starting boards) revealed that the first core to complete was idle 25% of the time,
waiting for the last core to complete; on average cores were idle 10% of the time. Thus, a dynamic scheduling algorithm could ideally improve speedup by 11%.
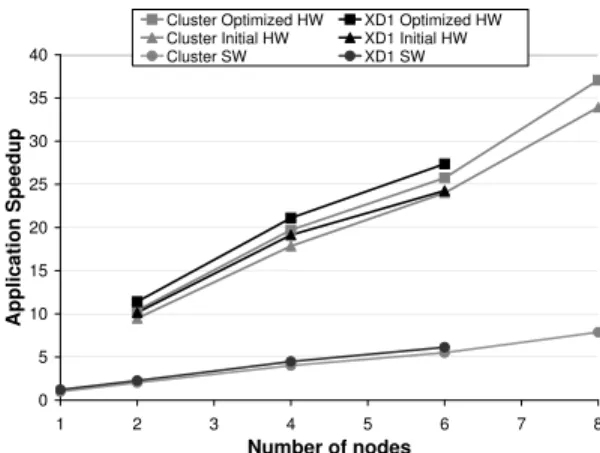
Figure 7 shows the speedup of the parallel software and both the initial and optimized hardware versions of N-Queens over the baseline sequential C version. The 8-node software version was able to achieve a speedup of 7.9 over the sequential baseline. The cluster exe-cuting the optimized hardware on 8 FPGAs achieved a speedup of 37.1 over the baseline.
0 5 10 15 20 25 30 35 40 1 2 3 4 5 6 7 8 Number of nodes A p p li c a ti o n S p e e d u p
Cluster Optimized HW XD1 Optimized HW Cluster Initial HW XD1 Initial HW Cluster SW XD1 SW
Figure 7: Speedup of N-Queens Application
5. Conclusions
In this paper we have explored various challenges faced in RC performance analysis. While we discussed some challenges that are shared by software perfor-mance analysis, many of these challenges are more dif-ficult in or unique to RC. Challenges such as resource sharing, automation of instrumentation and measure-ment, as well as compromises between accurate and precise measurement all need to be addressed for per-formance analysis to be successful. Furthermore, as systems continue to increase in size, the difficulty in presenting meaningful visualizations continues to in-crease. We proposed that, due to the complexity inher-ent in large-scale RC systems and applications, unifi-cation of software and hardware performance analysis into a single tool is crucial to efficiently record and un-derstand application behavior at runtime.
To demonstrate the overhead and benefits of these techniques, results from an N-Queens case study were provided. Using N-Queens on two RC platforms, we demonstrated that our prototype hardware measurement module (HMM) incurred little overhead. Measuring application behavior using profile counters and trac-ing cost no more than 6.4% of the logic resources in a medium-sized FPGA, 1.7% of the block RAM, 1% in
frequency degradation, and 33KB/s in bandwidth when polled once per millisecond. From the performance data returned, including statistics on time spent in the main N-Queens state machine, the behavior of the application was readily understood, resulting in a 10.5% speedup with minimal modifications.
Directions for future work include studying more advanced methods of signal analysis, measurement ap-proaches (e.g., FPGA-initiated transfers), and other techniques to minimize overhead and improve the fi-delity of measured data. In addition, further study of automated instrumentation techniques (especially with high-level languages) as well as development of large-scale visualizations will be critical in order for perfor-mance analysis of RC applications to achieve wide use. Recording data from more complex designs, such as de-signs with multiple clock domains or an embedded pro-cessor, are also important. Finally, automation of anal-ysis and optimization are open areas of research that could enable more widespread and effective use of per-formance analysis without intricate design knowledge.
Acknowledgments
This work was supported in part by the I/UCRC Program of the National Science Foundation under Grant No. EEC-0642422. The authors gratefully ac-knowledge vendor equipment and/or tools provided by Xilinx, Cray, Nallatech, Aldec, and Synplicity.
References
[1] M. C. Smith, J. S. Vetter, and X. Liang. “Accelerating scientific applications with the SRC-6 reconfigurable computer: methodologies and analysis”,Proc. of 19th IEEE International Parallel and Distributed Processing Symposium (IPDPS), Apr. 2005, p. 157b.
[2] J. L. Tripp, A. A. Hanson, M. Gokhale, and H. Mortveit. “Partitioning hardware and software for reconfigurable supercomputing applications: a case study”, Proc. of 2005 ACM/IEEE Conference on Supercomputing (SC), Nov. 2005, p. 27.
[3] Cray, “Cray XD1 datasheet”, 2005, http://www.cray. com/downloads/Cray XD1 Datasheet.pdf.
[4] XDI, “XD1000TMFPGA Coprocessor Module for Socket 940”,http://www.xtremedatainc.com/.
[5] DRC, “RPU100-L60 DRC Reconfigurable Processor Unit”, 2006,http://www.drccomputer.com/.
[6] S. S. Shende and A. D. Malony. “The Tau Parallel Performance System”, International Journal of High-Performance Computing Applications (HPCA), May 2006, 20(2):297–311.
[7] I. Chung, R. E. Walkup, H. Wen, and H. Yu. “MPI performance analysis tools on Blue Gene/L”,Proc. of 2006 ACM/IEEE Conference on Supercomputing (SC), Nov. 2006, p. 123.
[8] K. Camera, H. K. So, and R. W. Brodersen. “An in-tegrated debugging environment for reprogrammable hardware systems”, Proc. of 6th International Sym-posium on Automated Analysis-Driven Debugging (AADEBUG), Sep. 2005, pp. 111–116.
[9] Altera, “Design Debugging Using the SignalTap II Em-bedded Logic Analyzer”, Mar. 2007,http://www.altera. com/literature/hb/qts/qts qii53009.pdf.
[10] Xilinx, “Xilinx ChipScope Pro Software and User Guide, v. 9.1.01”, Jan. 2007,http://www.xilinx.com/ise/ verification/chipscope pro sw cores 9 1i ug029.pdf. [11] R. DeVille, I. Troxel, and A. George. “Performance
monitoring for run-time management of reconfigurable devices”, Proc. of International Conference on En-gineering of Reconfigurable Systems and Algorithms (ERSA), June 2005, pp. 175–181.
[12] M. Schulz, B. S. White, S. A. McKee, H. S. Lee, and J. Jeitner. “Owl: next generation system monitoring”,
Proc. of 2nd Conference on Computing Frontiers (CF), May 2005, pp. 116–124.
[13] P. Graham, B. Nelson, and B. Hutchings. “Instrument-ing Bitstreams for Debugg“Instrument-ing FPGA circuits”,Proc. of 9th annual IEEE Symposium on Field-Programmable Custom Computing Machines (FCCM), Apr. 2001, pp. 41–50.
[14] S. A. Guccione, D. Levi, and P. Sundararajan. “JBits: A Java-based interface for reconfigurable computing”,
Proc. of 2nd Military and Aerospace Applications of Programmable Devices and Technologies Conference (MAPLD), Sep. 1999, p. 27.
[15] F. Cristian. “A probabilistic approach to distributed clock synchronization”,Proc. of 9th International Con-ference on Distributed Computing Systems (ICDCS), June 1989, pp. 288–296.
[16] Xilinx, “Virtex-4 Family Overview”, Jan. 2007,http:// direct.xilinx.com/bvdocs/publications/ds112.pdf. [17] C. E. Wu et al. “From trace generation to
visualiza-tion: a performance framework for distributed parallel systems”,Proc. of 2000 ACM/IEEE Conference on Su-percomputing (Cdrom) (SC), Nov. 2000, p. 50. [18] M. L. Massie, B. N. Chun, and D. E. Culler. “The
Ganglia Distributed Monitoring System: Design, Im-plementation and Experience”. Technical report, Uni-versity of California, Berkeley, Feb. 2003.
[19] A. Leko and M. B. III. Parallel Performance Wiz-ard User Manual, 2007, http://ppw.hcs.ufl.edu/docs/ pdf/manual.pdf.
[20] A. Leko, D. Bonachea, H. Su, H. Sherburne, B. Golden, and A. George. “GASP! A Standardized Performance Analysis Tool Interface for Global Address Space Pro-gramming Models”,Proc. of Workshop on Applied Par-allel Computing (PARA), June 2006,http://www.hcs.ufl. edu/pubs/PARA06.pdf.
[21] Nallatech, “H100 Series FPGA Application Ac-celerators”, Apr. 2007, http://www.nallatech.com/ mediaLibrary/images/english/5595.pdf.
[22] C. Erbas, S. Sarkeshik, and M. M. Tanik. “Differ-ent Perspectives of the N-Queens problem”, Proc. of 1992 ACM Annual Conference on Communications, Mar. 1992, pp. 99–108.