Bringing Trade Liberalization Back into Trade
Agreements:
Explaining the Variation in U.S. Preferential Trade
Agreements
∗
Moonhawk Kim
University of Colorado at Boulder
[email protected]
April 22, 2010
Preliminary Version Comments Welcome
∗Version 1.0 (20100416): Prepared for presentation at the “Workshop on the Politics of Preferential Trade
1
Introduction
Preferential trade agreements (PTAs) began proliferating in the early 1990s and have contin-ued to increase in numbers and geographical scope in recent years, even in regions tradition-ally without institutionalized governance of international trade (Mansfield and Milner, 1999; Kastner and Kim, 2008).1 Both in economics and political science, analysts have sought to understand both the causes of PTAs (e.g. Mattli, 1999; Mansfield and Reinhardt, 2003; Mansfield et al. , 2007; Whalley, 2008) and the consequences of PTAs (e.g. Baier et al. , 2008; Hafner-Burton, 2009; Mansfield and Reinhardt, 2008).
Despite the significant progress that scholars have made in understanding PTAs, much of the progress has come at the cost of “black-boxing” trade agreements, implicitly or explicitly treating every agreement as the same and thus masking the variations that exist across PTAs. This has taken the form of explaining whether an agreement exists or not between states, counting the number PTAs states have signed and using the existence/absence of PTAs between states to explain other political and economic phenomena.
In recent years, however, scholars have begun to address the issue of variations across agreements. For example, Mansfield et al. (2008) explain the type of regional economic arrangements that states sign—ranging from PTA and free trade area (FTA) to customs union (CU)—using domestic political institutional characteristics. Hicks and Kim (2010) first code the varying levels of credible commitment across PTAs involving Asian states and explain the amount of trade using the credibility of PTAs.
Although these studies no longer treat all PTAs as being the same2, they continue to leave
unaddressed what should be the fundamental aspect of trade agreements—trade barriers and trade liberalization. The formal institutional variation—i.e. FTAs vs. CUs—certainly
1Pomfret (2007) cautions scholars against exaggerating the empirical phenomena of PTAs.
2Mansfieldet al. (2008) use the term PTA in a particular sense—the lowest form of regional integration
agreement—but I use it in the conventional sense in the literature, referring to the generic phenomena of trade integration at the bilateral or plurilateral levels.
affects the level trade liberalization. Presumably customs unions liberalize trade more than preferential trade agreements. At the same time, given the number of PTAs, a great deal of potential variation remains unaccounted for. Hicks and Kim more closely capture the trade liberalization aspects of PTAs by coding the sectoral coverage and the pace of tariff liberalization as part of their credible commitment measure. But a large of the measure consists of formal institutional aspects—the type of PTA (similar to Mansfieldet al. (2008)), dispute settlement mechanisms, and ratification/withdrawal procedures.
In short, much remains unknown about the substantive variation in the terms of trade liberalization. These include the breadth (the number of tariff lines covered), the depth (the extent of reduction and elimination in barriers) and the rate (the phase-in time of reduction and elimination) of trade liberalization. Building on recent developments, I begin to fill the gap in the literature and our understanding of PTAs in this paper. More specifically, I examine the variation in the terms of liberalization in the PTAs that the U.S. has signed in recent years. What is the pattern of variation in the breadth, the depth and the rate of trade liberalization in U.S. PTAs? Why do PTAs vary in these dimensions?
In this paper, I carry out simple descriptive analyses of eight bilateral U.S. PTAs that are in force. While a rigorous quantitative analysis is not possible with the number of cases, I present interesting patterns and variations across PTAs. In addition, I develop and examine three alternative hypotheses that can explain the variations in the terms of trade liberalization. The empirical pattern, as revealed by the newly-coded data, is consistent with arguments about the role of domestic preferences and of domestic political institutions. Cross-tabulations of the PTA characteristics and potential explanatory factors show the following. Partner states with a factor endowment similar to the U.S. are more likely to pursue a deep liberalization, whereas partner states with different factor endowments are more likely to pursue a shallow and slow liberalization. Partner states that are democracies are more likely to pursue a deep liberalization than autocracies, whereas partner states that
are democracies are less likely to pursue a fast liberalization than autocracies.
This paper makes three contributions. First, I make a conceptual contribution by drawing attention to the importance of focusing on the substantive dimensions of PTAs—those deal-ing with the terms of trade liberalization—as well as the procedural dimensions. Second, I make an empirical contribution by gathering and coding information on tariff commitments, which was not previously done. I also devise novel ways to summarize and utilize the in-formation. Lastly, the theoretical contribution in the paper comes from devising alternative arguments based on the open economy politics framework that can account for the variation in the terms of trade liberalization.
The paper proceeds in the following manner. In section 2.1 I briefly review the literature relevant to the empirical phenomena and argue that scholars have insufficiently analyzed the substantive characteristics of PTAs. In section 2.2, I elaborate on the three substantive dimensions of PTAs—the breadth, the depth and the rate of trade liberalization. Section 2.3 lays out three alternative arguments that can account for the variation in the terms of liberalization. Section 3 provides a preliminary analysis by characterizing the variations across eight PTAs and cross-tabulating the variations against potential explanatory variables. Section 4 concludes by laying out the future research.
2
Explaining Variations in PTA Characteristics
2.1
The Existing Literature
The existing literature relevant to explaining PTA characteristics consists of three groups: works explaining whether or a not states sign a PTA; those addressing characteristics of international institutions at large, including PTAs; and those addressing specific dimensions of PTAs. While the three bodies of the literature generate relevant and testable implications for explaining the variation in the terms of trade liberation across PTAs, none of them have
theoretically or empirically addressed the phenomenon. I briefly review each of the three groups.
The literature on PTA formations—why states form a PTA or not—has the longest and the liveliest history among the three groups of literature. Because of the intellectual history of how analysts have addressed the PTA phenomena (Viner, 1950), much of this literature, especially in economics, is cast in terms of multilateralism versus regionalism. Thus, the general trade economics literature approaches the question of why states form PTAs by comparing the relative welfare effects between a multilateral trade liberalization and a preferential one (Baldwin, 2008; Panagariya, 1999).3
In contrast to the purely economic explanations, other explanations take interests and power at both the domestic and the international levels into consideration. One group of domestic explanations points to the interests that some privileged groups have for desiring a PTA. Bhagwati (2008) maintains that bureaucracies and ethnic groups in the U.S. pushed for particular PTAs (40-41). Chase (2003) shows that businesses may prefer regional to global trade liberalization to exploit economies of scale and geographically proximate production sharing.
Rather than these interest-based explanations, explanations highlighting the role of do-mestic political institutions characterize the state-of-the-art of the PTA literature. Mansfield
et al. (2002) argue that democracies are more likely to sign PTAs than autocracies because
of the greater control that voters exert on political leaders to generate good economic out-comes. However, the number of veto players in a polity has the opposite effect. Mansfield
et al. (2007) argue that as the number of veto players rises in a state, the state’s probability
of forming a PTA declines.
Interests and institutions at the international level influence PTA formations as well.
3Baier and Bergstrand (2004) provide an economic explanation that has an explicit conception of domestic
States may have an interest in offsetting adverse economic consequences such as volatility in trade (Mansfield and Reinhardt, 2008) or potential commercial closure during and after a global recession (Mansfield, 1998).4 More generally, states might respond to creation of
PTAs by their trade partners by forming a PTA themselves, creating a domino effect of competitive liberalization (Baldwin, 1995; Bergsten, 1996; Mansfield, 1998; Lazer, 1999). Or they may seek specific security and economic benefits that only hegemons can provide by forming PTAs (Bhagwati, 2008, 44-45).5 Lastly, states may form PTAs to gain greater leverage in and create insurance against the multilateral governance of trade (Mansfield and Reinhardt, 2003).
In contrast to the above body of literature on PTA formations, two groups of literature speak more directly to the variations in the terms of trade liberalization across PTAs. First, Koremenos et al. (2001) develop a general conceptual framework for explaining character-istics of international institutions.6 Five characteristics they focus on are membership rules, scope of issues covered, centralization of tasks, rules for controlling the institution and flexi-bility of arrangements. They explain these characteristics with how the structure of strategic interaction problems among states varies across institutions. Although this rational design framework largely focuses on procedural aspects of institutions rather than substantive ones, it can generate implications how states would design the terms of trade liberalization.
Second, few existing works focus on explaining variations that exist across PTAs. Gross-man and HelpGross-man (1995) build on their existing political economic framework for explain-ing trade policy outcomes with domestic political economic interactions. They tie particular characteristics of PTAs—enhancement or reduction of protectionism possible and the number of industries included in the agreement—to the likelihood of states signing a PTA.
Politi-4Mansfield and Reinhardt (2008) do not argue that volatility reduction is a cause of PTA formation, but
given their finding that PTAs reduce volatility, formation of PTAs for that purpose is reasonable implication.
5Gruber (2000) argues that hegemons can indirectly compel smaller states to join PTAs.
6The legalization approach (Abbott et al. , 2000) is not as useful for studying PTAs, since most PTAs
cal leaders make choices on these dimensions by trading off pressures from special interest groups and concerns about the average voter. In political science, Mansfield et al. (2008) integrate their previous arguments about democracy and veto players to explain the varying depth of economic integration. Lastly, while Hicks and Kim (2010) code characteristics of Asian PTAs, they do not yet seek to account for what explains the variation.
In short, existing works on PTAs have implications for the the unaddressed question of what explains variation across PTAs in their terms of trade liberalization. For example, if states form PTAs due to the domino effect pressure, then they should create PTAs that are wide (covering more industries), deep (involving greater tariff cuts) and fast (eliminating tariffs rapidly) to gain the relative competitive advantage over other states that have formed PTAs. Similarly, components of the rational design approach generate implications for the terms of trade liberalization—the number of tariff lines covered in a PTA can increase with the severity of the distribution problem between states.
Despite these potential implications for the terms of trade liberalization in PTAs, scholars have not yet examined them. I begin developing alternative explanations for variations in the terms of trade liberalization in the next section by first elaborating on the difference between procedural and substantive dimensions of PTAs.
2.2
Substantive Terms of Trade Liberalization
Substantive dimensions of a PTA prescribe or proscribe state policies and behavior in gov-erning trade (e.g. “reduce tariffs tox, ” “do not use non-tariff barriers”). In the language of the seminal literature on international regimes, substantive dimensions of a PTA are “specific prescriptions and proscriptions for action” (Krasner, 1983, 2). In contrast, procedural dimen-sions prescribe states’ behavior with respect to substantive dimendimen-sions (e.g. “file a complaint when a party does not reduce tariffs as agreed”). They are akin to “decision-making proce-dures” and lay out the procedures through which states can manage their interactions within
the institution once it is created. They include re-negotiation rules (Koremenos, 2001a,b), dispute settlement mechanisms (Smith, 2000) and escape clauses.
Much of the literature on international institutions in general and the literature on PTAs in particular—at least works going beyond the presence/absence of PTAs—has focused on the procedural dimensions of international agreements. While delineating these dimensions is critical for understanding the creation and consequence of institutions in particular and international cooperation broadly, they only provide a partial picture of PTAs.
The core substantive aspect of PTAs, as scholars understand it, is trade liberalization through reduction and elimination of trade barriers.7 I focus on three broad aspects of
PTAs’ substantive dimensions related to trade liberalization: the breadth of sectoral coverage in tariff reductions, the depth of tariff liberalization and the rate of tariff liberalization. Substantive dimensions of PTAs other than these also address trade liberalization. For example, provisions in PTAs restricting anti-dumping, subsidies and other non-tariff barriers (NTBs) are about trade liberalization. However, I focus on tariff-related dimensions for two reasons. First, despite the broad reductions in tariffs and the concomitant rise in NTBs (Anderson and Schmitt, 2003; Mansfield and Busch, 1995), tariffs continue to constitute a significant portion of PTAs that states bargain over. Second, whereas tariff reductions are negotiated at the detailed industry levels, provisions about NTBs are typically singular and at the agreement level. Greater variation in the pattern of tariff reductions than the pattern of NTB rules provides an opportunity to analyze domestic-level variations in negotiating PTAs. I elaborate on each of the three dimensions, which are captured at the PTA-state level:
• Breadth of tariff liberalization: An agreement that addresses a larger portion of a state’s economy liberalizes trade more than one that addresses a smaller portion. This
7This is not an undisputed assumption across PTAs (Gray, 2010), but scholars need to examine theprima
dimension captures the number of sectors and industries in a state that is covered by a PTA and is calculated as the proportion of a state’s full tariff schedule that is addressed by a PTA.
• Depth of tariff liberalization: An agreement that simplifies and eliminates more tariffs liberalizes trade more than one that maintains a complex system and does not fully eliminate tariffs. This dimension can be calculated in a number of ways:
1. the proportion of the tariff lines that is covered by an ad valorem rate versus specific duties or special procedures
2. the standard deviation of the ad valorem rates
3. the average ad valorem rate when the agreement enters into force
• Rate of liberalization: An agreement that reduces and eliminates tariffs quicker liber-alizes trade more than one that reduces and eliminates barriers over a long period of time. This dimension is coded by the proportions of tariff lines falling into each staging category. Staging categories establish the timeline for the reduction and elimination of trade barriers for tariff lines. Tariff lines can be subject to standard staging categories that two states in a PTA lay out, or they can be subject to special categories and procedures that each side establishes.
2.3
Alternative Explanations
The existing literature on PTAs and the open economy politics approach to international political economy (Lake, 2009) point to three possible places where explanations for the varying terms of trade liberalization can lie—domestic interests, domestic institutions and international interactions. In this section, I develop three alternative explanations for the variation in the terms of trade liberalization.
Distribution of Domestic Interests and the Terms of Trade Liberalization
Distribution of preferences at the societal level can influence the substantive terms of PTA that a state negotiates with another state. The assumption of this approach is that societal preferences are paramount in explaining state-level preferences and states’ foreign economic policies (Gourevitch, 1986; Legro and Moravcsik, 1999). The relevant preferences in explaining trade agreements and their characteristics are the protectionist and free-trading interests within a society. In a bilateral context, these preferences are distributed according to the relative factor endowment of each state.
The cleavage between the two groups within each state signing a PTA will favor the free-trading one if the two states have broadly similar factor endowments. When factor en-dowments are similar, the existing trade flows and the anticipated increase in flows resulting from the PTA will be largely intra-industry. Intra-industry trade generates fewer economic adjustments and thus leads to less political opposition from mobilized groups. The terms of trade liberalization will likely reflect this distribution of societal interests and favor greater liberalization.
In contrast, the cleavage between the two groups will favor the protectionist one if the two states have contrasting factor endowments. Reducing barriers between states with different factor endowments through a PTA will lead to greater comparative advantage-based trade, resulting in more economic adjustments and political opposition. The terms of trade liber-alization will likely reflect this distribution of societal interests and favor less liberliber-alization.8
H1a If two states forming a PTA have similar factor endowments, then the states’ terms of liberalization will be broad, deep and fast.
H1b If two states forming a PTA have contrasting factor endowments, then the states’ terms of liberalization will be narrow, shallow and slow.
8This is under the assumption that the decision to sign a PTA is a separate and exogenous one to decisions
Domestic Political Institutions and the Terms of Trade Liberalization
The domestic political institutions of states signing a PTA can have competing effects on the terms of trade liberalization contained in the PTA. On the one hand, the terms of liberalization may be increasing in the level of democracy. As Mansfieldet al. (2002) argue, democratic states are more likely to sign trade agreements because they help political leaders signal their intention of maintaining strong economic performance to their constituents. In this scenario, the information content of PTAs promoting greater liberalization would be stronger, enabling political leaders to send more explicit signals to their constituencies. Thus, democratic states would pursue greater liberalization through PTAs than non-democratic states.
On the other hand, the information content of PTAs might be lower than what Mansfield
et al. (2002) argue. Most citizens do not know what the specific tariff provisions in PTAs
are, unless the provisions affect them directly. Thus, political leaders in democracies might have the incentive to exploit this information asymmetry to their advantage. By signing a PTA, political leaders can signal to the broad electorate that they are committed to strong economic performance and at the same time allow rent-seeking from mobilized groups. Kono (2006) advances a similar argument about the move to non-tariff barriers. In fact, democratic institutions can enable greater rent-seeking than autocratic ones.
In short, democratic political institutions can have offsetting effects on the terms of lib-eralization. Although dyadic hypotheses about the effects of regime type might be possible, since the effect of regime type is not unambiguous, I limit the hypotheses to the following monadic ones:
H2a If a state signing a PTA is democratic, then its terms of liberalization will be broad, deep and fast.
shallow and slow.
H2c The regime type of states signing a PTA does not have any systematic effects on their terms of liberalization.
Asymmetric Bargaining Power and the Terms of Trade Liberalization
At the international level, asymmetric bargaining power—in terms of differential market size—can influence the terms of liberalization. A more powerful state can extract greater concessions from their weaker PTA partners and resist or delay granting concessions itself.9
In the absence of an assumption about the preference of powerful states with respect to trade liberalization, however, only partial hypotheses are possible. First, since I assume that states prefer their PTA partners to liberalize as much as possible, more powerful states will be able to extract greater liberalization from their partners using the additional leverage they possess. Second, although powerful states might prefer to liberalize their own market as much as possible as well, they will certainly be able to resist demands from weaker parter states for greater liberalization if that is not consistent with their preference.
H3a If a state signing a PTA is less powerful than its partner, then its terms of liberalization in the PTA will be broad, deep and fast.
H3b If a state signing a PTA is more powerful than its partner, then its terms of liberaliza-tion in the PTA will be narrow, shallow and slow.
9See Hafner-Burton (2009) for a discussion on the role that relative power can play in the terms of trade
3
Variations in U.S. Preferential Trade Agreements
3.1
Background on Data Coding
The empirical analysis focuses on bilateral PTAs that the U.S. has signed and are in force. This excludes the two plurilateral agreements—the North American Free Trade Agreement (NAFTA) and the Dominican Republic-Central American FTA (DR-CAFTA). Three more agreements have been signed—U.S–Colombia, U.S.–Korea and U.S.–Panama. But these are not yet in force due to lack of ratification and are excluded from the analysis. Lastly, two agreements are excluded for reasons beyond these. The tariff commitments from the very first PTA that the U.S. signed—the U.S.–Israel FTA—are not publicly available.10 The original
agreement between the U.S. and Canada is also excluded due to problems of processing non-electronic tariff documents. The following are the eight agreements I code and analyze, in an alphabetical order of the partner states’ names (the years in parentheses are the years in which the agreements entered into force):
• US–Australia Free Trade Agreement (2005) • US–Bahrain Free Trade Agreement (2006) • US–Chile Free Trade Agreement (2004) • US–Jordan Free Trade Agreement (2001) • US–Morocco Free Trade Agreement (2006) • US–Oman Free Trade Agreement (2009) • US–Peru Free Trade Agreement (2006)11
• US–Singapore Free Trade Agreement (2004)
For each of these agreements, I obtained the tariff schedules for both parties in the agree-ment from the USTR website in PDF format. The files—ranging in length from 159 pages
10Neither the Office of the United States Trade Representative (USTR) nor the Department of State have
been cooperative in tracking down the schedules.
(Jordan’s schedule) to 940 pages (Morocco’s schedule)—were converted to a spreadsheet for-mat using ReadIris 12 Corporate Edition—an optical character recognition (OCR) software. Three research assistants compiled and checked the general fidelity of the conversion process, and the data was ultimately imported into Stata.
3.2
Agreement Characteristics
I begin the analysis by characterizing the variation in the three dimensions of the terms of trade liberalization. Table 1 provides the summary statistics. On the U.S. side of the seven PTAs12, the commitments for reducing tariffs look remarkably similar, despite the diversity in the trade partners. To measure the breadth of trade liberalization, I calculate the number of tariff lines covered by each PTA as a proportion of all U.S. tariff lines under MFN obligations through the World Trade Organization (column 2 of the table). No significant variation exists in these proportions across PTAs. The proportion ranges between 81.7% (with Chile) and 84.5% (with Bahrain, Morocco and Singapore).
[Table 1 about here]
The depth of liberalization is characterized by several different summary statistics. The proportion of the tariff lines in each PTA containing only ad valorem tariffs for the U.S. (column 6 of the table) ranges from 87.1% (with Chile) to 89.1% (with Oman). The minimum
ad valorem tariff (column 7) is always zero, and the maximum (column 8) is always 350%,
except with Jordan—the only agreement in the analysis signed prior to the 2002 Trade Act— in which the maximum is 164%.13 The mean ad valorem tariff ranges between 4.25% (with
Bahrain and Morocco) and 4.49% (with Chile). Lastly, the standard deviation of the ad
valorem rates ranges between 11.25 (with Australia) and 11.5 (with Chile).
12The U.S. data on the Peru-US PTA is not yet available.
Lastly, the rate of liberalization is summarized by calculating the proportion of all tariff lines under a PTA that become duty-free inx number of years as specified by the agreement.14
Figure 1 presents seven charts, one for each agreement. The bars marked “0” contain the proportion of tariff lines in the PTA that were already granted duty-free access prior to the PTA. The bars marked “1” contain the proportion of tariff lines that become duty-free upon the PTA’s entry into force. Some goods in some PTAs never reach the duty-free status as indicated by “Never” in the Australia agreement and the Jordan agreement. Except with Jordan, the U.S. had already been granting duty-free access to over 25% of the total products to its partner countries prior to the entry into force of each PTA. Much of the liberalization, however, happened in the year that each agreement entered into force (year 1). Beyond the first year, the agreements with Australia, Jordan, Morocco and Singapore exhibit significant over-time staging of liberalization.
[Figure 1 about here]
To collapse this information into a single statistic for each agreement, I calculate the following measure:
N X
i=1
No. of Years Until Duty-Freei×PNNumber of Tariff Linesi i=1Number of Tariff Linesi
!
where i indexes the staging category and excludes the category for which products were already receiving duty-free treatment.15 The larger the value of this measure, the longer the U.S. has to fully liberalize its trade with its partner. Table 2 summarizes this statistic for the U.S.—U.S. liberalizes the fastest with Bahrain (1.12) and slowest with Australia (3.57).
14The statistics presented here collapse different paths through which products can become duty-free in
the same number of years. Under the conventional process, each state reduces the baseline tariff rate of a product in a particular staging category in equal amounts over the number of years specified by the category. In addition, each state can specify more complex procedures through which they reduce trade barriers over time.
[Table 2 about here]
Since little meaningful variation exists in the dimensions of breadth and depth, each PTA on the U.S. side can only be distinguished based on the rate of trade liberalization. I di-chotomize the seven agreements according to the calculated measure of the rate, summarized in Table 2. The U.S. trade liberalization in PTAs with the following partners is coded as “fast”: Bahrain (1.12), Oman (1.34) and Chile (1.36). The U.S. trade liberalization in PTAs with the following partners is coded as “slow”: Australia (3.57), Jordan (3.02), Singapore (2.19) and Morocco (2.07). The top-half of Table 4 lists these codings.
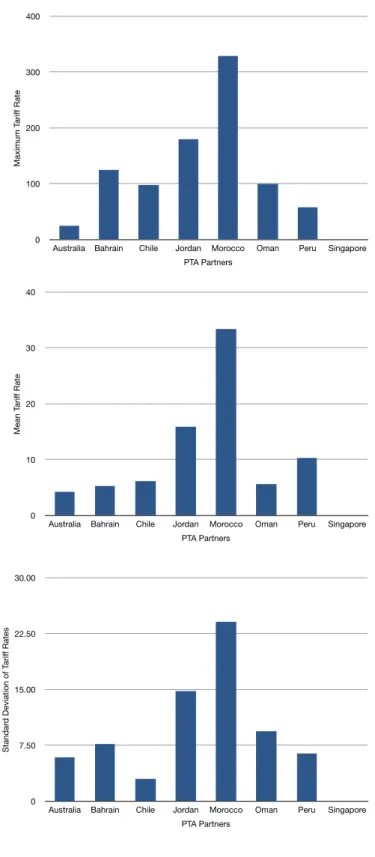
The terms of trade liberalization vary more widely among the partner states. For the breadth of liberalization, Chile has the lowest proportion of its tariff lines covered by its PTA with the U.S. at 68%. The highest coverage is by Australia with 89.9% of its tariff lines being addressed by its PTA with the U.S. (See Table 1 column 2.) For the depth of liberalization, the proportion of tariff lines consisting of ad valorem rates is uniformly high among all the partner states. The lowest proportion is for Chile (99.3%) and the highest proportion is for Singapore (100%). All of Singapore’s tariff lines in its PTA with the U.S. consist only of ad
valorem rates. The maximum ad valorem rates vary between 0% (for Singapore) and 329%
(for Morocco). The meanad valorem rates vary between 0% (for Singapore) and 33.4% (for Morocco). Lastly, the standard deviation of ad valorem rates range from 0 (for Singapore) to 24.1 (for Morocco). Figure 2 plots the maximum, the mean and the standard deviation
of ad valorem rates across eight partner states.
[Figure 2 about here]
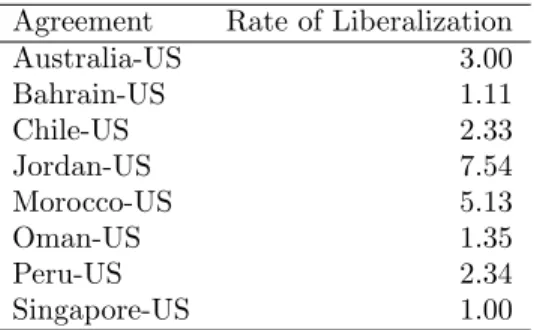
Similar to the U.S., I summarize the rate of trade liberalization through charts and calculated measures. Figure 3 presents the eight charts for each of the agreements. Several interesting patterns emerge from them. First, unlike the U.S., partner states have lower proportion of their tariff lines, for which they had already been granting the U.S. duty-free
access prior to the PTAs, except for Australia. Second, overwhelming majority of trade liberalization took place in the year that the PTA entered into force for Bahrain, Oman, Chile and Peru. In contrast, Jordan’s liberalization is backloaded, with almost 40% of the duty-free liberalization taking place in the tenth year. Third, Morocco has a very long time-horizon, with some duty-free liberalization set to take place in the 25th year of its agreement with the U.S. Lastly, Singapore is an interesting case in which almost all the duty-free tariff liberalization had taken place prior to its agreement with the U.S.
[Figure 3 about here]
Table 3 presents the calculated measures of how quickly each state fully liberalizes its trade with the U.S. in their PTA. Consistent with the charts on Figure 3, Singapore has the quickest liberalization (1.0) and Jordan has the slowest one (7.54).
[Table 3 about here]
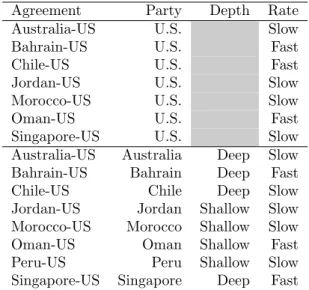
Given the sufficient variation on both the depth and the rate dimensions across the partner states’ side of PTAs, I code the eight agreements on both of these dimensions. For the depth of liberalization, I focus on two summary statistics—the meanad valorem rate and the standard deviation amongad valorem rates. Both statistics carry useful information, so I multiply the two for each partner state to obtain a single, comparable measure across the eight agreements. High values on this measure indicate shallower liberalization (high mean tariff rates and/or high variability/complexity in the tariff schedule), and low values indicate deeper liberalization. I divide the eight partner states into two groups based on this measure. Trade liberalization of the following partner states is coded as deep: Singapore (0), Chile (18.57), Australia (25.12) and Bahrain (40.81). The following partner states’ liberalization is coded as shallow: Morocco (804.94), Jordan (235.32), Peru (66.25) and Oman (53.07). The rate of trade liberalization is coded similar to that of the U.S. Using the calculated measures
of the rate of liberalization (Table 3), I divide the PTAs into two groups. Singapore (1.0), Bahrain (1.11) and Oman’s (1.35) side of PTAs with the U.S. is coded as fast, whereas Jordan (7.54), Morocco (5.13), Australia (3.0), Peru (2.34) and Chile’s (2.33) side of PTAs with the U.S. is coded as slow. The bottom-half of Table 4 lists these codings.
3.3
Descriptive Analysis
Because the number of cases does not allow any rigorous quantitative analysis, I carry out a series of cross-tabulations instead to examine the hypotheses. The first set of hypotheses points to the relative factor endowment as a possible explanation for the varying terms of liberalization. I use the capital-labor ratio in the Extended Penn World Tables by Marquetti to capture the relative factor endowments. The capital-labor ratios for the nine countries in 2003—the latest year for which data is available—are the following, in decreasing values: Singapore 132,298; U.S. 108,410; Australia 97,840; Chile 42,920; Oman 29,638; Bahrain 25,007; Peru 13,886; Jordan 11,424; and Morocco 8,076. Thus, Singapore and Australia are coded as having similar factor endowments as the U.S., while the rest of the partner states are coded as having different factor endowments. Figure 4 presents three cross-tabulations, one for the depth of liberalization by the partner states, another for the rate of liberalization by the partner states and a third for the rate of liberalization by the U.S. in the seven agreements.
[Figure 4 about here]
The depth of liberalization on the partners’ side supports the factor endowment hypothe-ses (H1a and H1b). No partner state with a factor endowment similar to that of the U.S. has a shallow commitment to trade liberalization. Both Australia and Singapore have com-mitted to deep liberalization with the U.S. In contrast, more of partner states with factor endowments different from the U.S. have committed to shallow liberalization. Only Bahrain
and Chile in this group have committed to deep liberalization with the U.S. For the rate of liberalization, the pattern among those with a factor endowment different from that of the U.S supports the hypothesis. Chile, Jordan, Morocco and Peru committed to a slow liberalization, whereas only Bahrain and Oman committed to a fast liberalization. On the U.S. side, the evidence contradicts the hypotheses. With partners that have a similar factor endowment (Australia and Singapore), the U.S. committed to a slow liberalization. With more of partners that have a different factor endowment (Bahrain, Chile and Oman), it committed to a fast liberalization. This analysis suggests that the Bahrain agreement might be unique.
Next, I carry out a similar analysis with the level of states’ democracy using the Polity score of regime type to examine the second set of hypotheses. The partner states fall into three groups: democracies, anocracies and autocracies. Australia, Chile and Peru score between 9 and 10 during the relevant time period. Jordan and Singapore score –2.16 Bahrain, Morocco and Oman score –7, –6 and –8, respectively.17 I cluster the anocratic states and autocratic states into a single group to facilitate the analysis. Figure 5 presents two cross-tabulations. Since the regime type of the U.S. does not vary, I only include the partner states in the analysis.
[Figure 5 about here]
A weak pattern supporting hypothesis H2a exists with the depth of liberalization as the dependent variable. More democratic partner states pursue deep liberalization (Australia and Chile) than shallow liberalization (Peru). More autocratic partner states pursue shallow liberalization (Jordan, Morocco and Oman) than deep liberalization (Bahrain and Singa-pore). The relationship reverses with the rate of liberalization as the dependent variable. All democratic partner states pursue a slow liberalization, and more of autocratic partner
16Jordan falls to –3 in 2007.
states pursue a fast liberalization (Bahrain, Oman and Singapore) than a slow one (Jordan and Morocco). This patter supports hypothesis H2b that democracies pursue less trade lib-eralization than autocracies. These contrasting results between the depth of liblib-eralization and the rate of liberalization contribute to the long-standing literature on the relationship between regime type and economic reform (e.g. Geddes, 1994).
Lastly, that the U.S. has been able to negotiate strikingly similar agreements across varying partners presents some prima facie evidence that the U.S. power plays a role in its PTA negotiations.18 To examine the hypotheses regarding asymmetric power further, however, I compare the total GDP (in constant U.S. dollars) of two states in each PTA. The following is the ranking of partner states in decreasing order of the ratio between the partner state GDP to the U.S. GDP: Australia, Singapore, Chile, Peru, Morocco, Oman, Bahrain and Jordan. The drop-off in relative GDP is significant from Singapore to Chile, so I categorize Australia and Singapore as being symmetric in terms of power with the U.S. and the remainder of the states as asymmetric in their relative power. Figure 6 presents three cross-tabulations summarizing the results, which correspond perfectly with Figure 4.
[Figure 6 about here]
The hypotheses related to relative power (H3a and H3b) receive the least support among the three sets of hypotheses. Contrary to the expectation, among the partner states with weaker power, more pursue a shallow liberalization (Jordan, Morocco, Oman and Peru) than a deep one (Bahrain and Chile). With the rate of liberalization as the dependent variable, a similar pattern emerges. More among the weaker partners pursue a slow liberalization (Chile, Jordan, Morocco and Peru) than a fast one (Bahrain and Oman). The rates of liberalization that the U.S. has committed to also reveal some paradoxical results. With partners that have the most capacity to resist U.S. attempts to pursue a slow liberalization
18An alternative hypothesis to this would be that a bureaucratic culture of the USTR drives the similarities
(Australia and Singapore), the U.S. has committed to a slow liberalization. With more of partner states with the least capacity, the U.S. has committed to a fast liberalization (Bahrain, Chile and Oman) than a slow one (Jordan and Morocco). However, given that the classification of partner states according to the relative factor endowments correspond perfectly with the classification based on relative power measured by the market size, I am unable to distinguish which factor is contributing to the observed outcomes.
While the small number of available cases render any rigorous analysis impossible, some patterns still emerge from the analysis, especially among partner states. First, states’ relative factor endowments influence the depth and the rate of trade liberalization they pursue in a PTA. Those with similar endowments are more likely to pursue a deep liberalization, whereas those with different endowments are more likely to pursue a shallow and slow liberalization. Second, domestic political institutions influence the terms of trade liberalization in a complex manner. Democracies liberalize their trade through PTAs more deeply than autocracies, but they liberalize more slowly than autocracies do. Lastly, relative power does not influence the terms of liberalization in PTAs in an intuitive manner. This pattern may highlight that the motivation for signing and incorporating certain terms in PTAs may lie beyond simple power dynamics between states.
4
Conclusion
In this paper I pursued three objectives. First, I sought to highlight the conceptual impor-tance of focusing on the substantive as well as the procedural aspects of trade agreements. Much of the existing literature focuses on explaining the procedural—frequently referred to as “institutional”—aspects of PTAs and analyzing the consequences of those procedu-ral aspects. This has come at the cost of leaving out the substantive dimensions of PTAs, those that lay out the terms of trade liberalization between the parties. Second, this
pa-per serves as the starting point for gathering the empirical data on the variation in the terms of trade liberalization across PTAs. The hurdles until now in this respect have been two-fold—technical and analytical. Processing thousands of tariff lines poses a significant technical challenge, but increased sophistication in computing hardware and software can address this. More importantly, turning thousands of lines of information into meaningful data has posed an analytical challenge. In this paper, I devised some ways to collapse the information into useful statistics. Lastly, I proposed potential competing and complemen-tary theoretical arguments to account for the variation in the terms of trade liberalization. Arguments based on the open economy politics (OEP) framework provide a useful platform to account for the variations across PTAs.
Much work remains to be done on each of these three objectives. First, further work will be necessary in clarifying the relationship between the procedural and the substantive aspects of PTAs in particular and of international institutions in general. How the substantive features of PTAs—the terms of trade liberalization—interact with the procedural features of PTAs—e.g. the dispute settlement mechanism, the escape clause provisions, etc.—is an interesting empirical question as well as a theoretical one. Second, the limitations of this paper—eight agreements, two parties each and sixteen tariff schedules total—highlight the need to broaden the data-gathering. Coding all the PTA that the U.S. has signed, including the plurilateral ones, as well as the PTAs that the European Union (EU) has signed will contribute greatly to advancing this line of research. Lastly, advancements in the preceding points will also enable progress on the theoretical front. As the simple analysis in this paper suggests, distribution of domestic interests, domestic political institutions and international interactions likely interact in a non-intuitive way to produce the varying terms of trade liberalization across PTAs.
References
Abbott, Kenneth W., Robert O. Keohane, Andrew Moravcsik, Anne-Marie Slaughter, and Duncan Snidal. 2000. The Concept of Legalization. International Organization54(3):401– 419.
Anderson, Simon P. and Nicolas Schmitt. 2003. Nontariff Barriers and Trade Liberalization.
Economic Inquiry 41(1):80–97.
Baier, Scott L. and Jeffrey H. Bergstrand. 2004. Economic Determinants of Free Trade Agreements. Journal of International Economics64(1):29–63.
Baier, Scott L., Jeffrey H. Bergstrand, Peter Egger, and Patrick A. McLaughlin. 2008. Do Economic Integration Agreements Actually Work? Issues in Understanding the Causes and Consequences of the Growth of Regionalism. World Economy 31(4):461–497.
Baldwin, Richard. 2008. Big-Think Regionalism: A Critical Survey. NBER Working Paper 14056. Cambridge, MA: National Bureau of Economic Research, June.
Baldwin, Richard E. 1995. The Domino Theory of Regionalism. In Expanding Membership of the European Union, edited by Pertti Haaparanta and Jaakko Kiander, Chap. 2, 25–53. Cambridge, UK: Cambridge University Press.
Bergsten, C. Fred. 1996. Competitive Liberalization and Global Free Trade: A Vision for the Early 21st Century. Working Paper 96-15. Washington, DC: Institute for International Economics.
Bhagwati, Jagdish N. 2008. Termites in the Trading System: How Preferential Agreements undermine Free Trade. New York, NY: Oxford University Press.
Chase, Kerry A. 2003. Economic Interests and Regional Trading Arrangements: The Case of NAFTA. International Organization 57(1):137–174.
Geddes, Barbara. 1994. How Politicians Decide Who Bears the Cost of Economic Liberal-ization: Latin American, Southern European, and African Experiences. In Transition to a Market Economy at the End of the 20th Century, edited by Ivan T. Berend, 203–225. Munich, Germany: S¨udoseuropa-Gesellschaft.
Gourevitch, Peter A. 1986. Politics in Hard Times: Comparative Responses to International Economic Crises. Ithaca, NY: Cornell University Press.
Gray, Julia. 2010 (April). Politics of Patronage: The Function of Dysfunctional Regional Trade Agreements. Unpublished manuscript, University of Pittsburg.
Grossman, Gene M. and Elhanan Helpman. 1995. The Politics of Free-Trade Agreements.
Gruber, Lloyd. 2000. Ruling the World: Power Politics and the Rise of Supranational Institutions. Princeton, NJ: Princeton University Press.
Hafner-Burton, Emilie M. 2009. Forced to Be Good: Why Trade Agreements Boost Human Rights. Ithaca, NY: Cornell University Press.
Hicks, Raymond and Soo Yeon Kim. 2010 (January). Credible Commitment through PTAs and their Effects on Trade: A Study of Asia’s Reciprocal Trade Agreements. Unpublished manuscript, Princeton University and University of Maryland.
Kastner, Scott L. and Soo Yeon Kim. 2008. Why the Rush to Bilateral Free Trade Agreements in the Asia-Pacific? Paper presented at the Annual Meeting of the Midwest Political Science Association (MPSA), April, Chicago, IL.
Kono, Daniel Y. 2006. Optimal Obfuscation: Democracy and Trade Policy Transparency.
American Political Science Review100(3):369–384.
Koremenos, Barbara. 2001a. Loosening the Ties that Bind: A Learning Model of Agreement Flexibility. International Organization 55(2):289–325.
Koremenos, Barbara. 2001b. Modeling the Adjustment Mechanisms in International Agree-ments. Paper presented at the 2001 Annual Meeting of the American Political Science Association, August, San Francisco, CA.
Koremenos, Barbara, Charles Lipson, and Duncan Snidal. 2001. The Rational Design of International Institutions. International Organization 55(4):761–799.
Krasner, Stephen D. 1983. Structural Causes and Regime Consequences: Regimes as Inter-vening Variables. InInternational Regimes, edited by Stephen D. Krasner, 1–21. Ithaca: Cornell University Press.
Lake, David A. 2009. Open Economy Politics: A Critical Overview. Review of International
Organizations4(3):219–244.
Lazer, David. 1999. The Free Trade Epidemic of the 1860s. World Politics 51(4):447–483. Legro, Jeffrey W. and Andrew Moravcsik. 1999. Is Anybody Still a Realist? International
Security24(2):5–55.
Mansfield, Edward D. 1998. The Proliferation of Preferential Trading Arrangements. Journal
of Conflict Resolution42(5):523–543.
Mansfield, Edward D. and Marc L. Busch. 1995. The Political Economy of Nontariff Barriers: A Cross-National Analysis. International Organization 49(4):723–749.
Mansfield, Edward D. and Helen V. Milner. 1999. The New Wave of Regionalism.
Mansfield, Edward D. and Eric Reinhardt. 2003. Multilateral Determinants of Regionalism: The Effects of GATT/WTO on the Formation of Preferential Trading Arrangements.
International Organization57(4):829–862.
Mansfield, Edward D. and Eric Reinhardt. 2008. International Institutions and the Volatility of International Trade. International Organization 62(4):621–652.
Mansfield, Edward D., Helen V. Milner, and B. Peter Rosendorf. 2002. Why Democracies Cooperate More: Electoral Control and International Trade Agreements. International
Organization 56(3):477–513.
Mansfield, Edward D., Helen V. Milner, and Jon C. Pevehouse. 2007. Vetoing Cooperation: The Impact of Veto Players on International Trade Agreements.British Journal of Political
Science 37(3):403–432.
Mansfield, Edward D., Helen V. Milner, and Jon C. Pevehouse. 2008. Democracy, Veto Players and the Depth of Regional Integration. World Economy 31(1):67–96.
Mattli, Walter. 1999. The Logic of Regional Integration: Europe and Beyond. Cambridge, MA: Cambridge University Press.
Panagariya, Arvind. 1999. The Regionalism Debate: An Overview. World Economy
22(4):477–511.
Pomfret, Richard. 2007. Is Regionalism an Increasing Feature of the World Economy? World
Economy30(6):923–947.
Smith, James McCall. 2000. The Politics of Dispute Settlement Design: Explaining Legalism in Regional Trade Pacts. International Organization 54(1):137–180.
Viner, Jacob. 1950. The Customs Union Issue. New York, NY: Carnegie Endowment for International Peace.
Whalley, John. 2008. Recent Regional Agreements: Why So Many, Why So Much Variance in Form, Why Coming So Fast, and Where Are They Headed? World Economy31(4):517– 532.
Figure 1: Staging of Tariff Elimination—U.S. 0% 13% 25% 38% 50% 0 1 4 5 8 10 18 Never USA in AUS-USA
Year of Duty Free Access
0% 18% 35% 53% 70% 0 1 5 10 USA in BAH-USA
Year of Duty Free Access
0% 18% 35% 53% 70% 0 1 4 8 10 12 USA in CHL-USA
Year of Duty Free Access
0% 8% 15% 23% 30% 1 2 4 5 10 Never USA in JOR-USA
Year of Duty Free Access
0% 13% 25% 38% 50% 0 1 5 6 8 9 10 12 15 18 USA in MOR-USA
Year of Duty Free Access
0% 15% 30% 45% 60% 0 1 5 9 10 USA in OMA-USA
Year of Duty Free Access
0% 13% 25% 38% 50% 0 1 4 8 10 USA in SGP-USA
Figure 2: Summary Statistics of Ad Valorem Rates—Partner States 0 100 200 300 400
Australia Bahrain Chile Jordan Morocco Oman Peru Singapore
Maximum T arif f Rate PTA Partners 0 10 20 30 40
Australia Bahrain Chile Jordan Morocco Oman Peru Singapore
Mean T arif f Rate PTA Partners 0 7.50 15.00 22.50 30.00
Australia Bahrain Chile Jordan Morocco Oman Peru Singapore
Standar
d Deviation of T
arif
f Rates
Figure 3: Staging of Tariff Elimination—Partner States 0% 13% 25% 38% 50% 0 1 5 10 AUS in AUS-USA
Year of Duty Free Access
0% 25% 50% 75% 100% 0 1 10 BAH in BAH-USA
Year of Duty Free Access
0% 23% 45% 68% 90% 1 3 4 8 10 12 CHL in CHL-USA
Year of Duty Free Access
0% 10% 20% 30% 40% 2 4 5 8 10 Never JOR in JOR-USA
Year of Duty Free Access
0% 8% 15% 23% 30% 0 1 2 5 6 8 9 10 12 15 18 19 25 MOR in MOR-USA
Year of Duty Free Access
0% 23% 45% 68% 90% 0 1 5 10 OMA in OMA-USA
Year of Duty Free Access
0% 20% 40% 60% 80% 1 2 3 5 7 8 9 10 12 15 PER in PER-USA
Year of Duty Free Access
0% 25% 50% 75% 100% 0 1 SGP in SGP-USA
Figure 4: Relative Factor Endowments and Depth/Rate of Liberalization
None SingaporeAustralia
Jordan Morocco Oman Peru Bahrain Chile Shallow Deep
Depth of Trade Liberalization
Di ff er en t Si m il a r R e la ti ve F a ct o r E n d o w m e n t Australia Singapore Chile Jordan Morocco Peru Bahrain Oman Slow Fast
Rate of Trade Liberalization
Di ff er en t Si m il a r R e la ti ve F a ct o r E n d o w m e n t U.S. (Australia)
U.S. (Singapore) None
U.S. (Jordan) U.S. (Morocco) U.S. (Bahrain) U.S. (Chile) U.S. (Oman) Slow Fast
U.S. Rate of Trade Liberalization
Di ff er en t Si m il a r R e la ti ve F a ct o r E n d o w m e n t
Figure 5: Regime Type and Depth/Rate of Liberalization
Peru AustraliaChile
Jordan Morocco Oman Bahrain Singapore Shallow Deep Depth of Trade Liberalization
Autocr ati c De m oc ra ti c De m o cra cy Australia Chile Peru None Jordan Morocco Bahrain Oman Singapore Slow Fast Rate of Trade Liberalization
Autocr ati c De m oc ra ti c De m o cra cy
Figure 6: Relative Power and Depth/Rate of Liberalization
None SingaporeAustralia
Jordan Morocco Oman Peru Bahrain Chile Shallow Deep
Depth of Trade Liberalization
Asym m etr ic Sy m m et ri c R e la ti ve P o w e r (G DP ) Australia Singapore Chile Jordan Morocco Peru Bahrain Oman Slow Fast
Rate of Trade Liberalization
Asym m etr ic Sy m m et ri c R e la ti ve P o w e r (G DP
) U.S. (Singapore)U.S. (Australia) None
U.S. (Jordan) U.S (Morocco) U.S. (Bahrain) U.S. (Chile) U.S. (Oman) Slow Fast
Rate of Trade Liberalization
Asym m etr ic Sy m m et ri c R e la ti ve P o w e r (G DP )
T able 1: Descriptiv e Statistics of T erms of T rade Lib eralization Agreemen t P art y T otal Lines Prop. A V Only Mixed Sp ecific Prop. A V Min A V Max A V M e an A V SD A V (1) (2) (3) (4) (5) (6) (7) (8) (9) (10) Australia-US P artner 6068 89.9% 6051 12 5 99.7% 0 25 4.25 5.91 Australia-US US 10536 83.7% 9367 395 769 88.9% 0 350 4.27 11.25 Bahrain-US P artner 6955 84.6% 6923 0 14 99.5% 0 125 5. 3 7.7 Bahrain-US US 10629 84.5% 9289 555 780 87.4% 0 350 4.25 11.27 Chile-US P artner 5956 68.0% 5915 0 47 99.3% 0 98 6.17 3.01 Chile-US US 10284 81.7% 8961 519 790 87.1% 0 350 4.49 11.5 Jordan-US P artner 6258 88.7% 6249 9 0 99.9% 0 180 15.9 14.8 Jordan-US US 10288 81.8% 9014 521 751 87.6% 0 164 4.3 6.3 Moro cco-US P artner 17470 86.3% 17470 0 0 100% 0 329 33.4 24.1 Moro cco-US US 10629 84.5% 9291 552 786 87.4% 0 350 4.25 11.3 Oman-US P artner 7132 86.7% 7120 0 12 99.8% 0 100 5.64 9.41 Oman-US US 10459 83.1% 9321 359 779 89.1% 0 350 4.22 11.3 P eru-US P artner 6987 84.0% 6978 0 8 99.9% 0 58 10.32 6.42 P eru-US US – Data Unavailable – Singap ore-US P artner 8185 86.7% 8182 0 3 100.0% 0 0 0 0 Singap ore-US US 10628 84.5% 9290 526 812 87.4% 0 350 4.35 11.3
Table 2: Summary Statistic of U.S. Staging Categories
Agreement Rate of Liberalization
Australia-US 3.57 Bahrain-US 1.12 Chile-US 1.36 Jordan-US 3.02 Morocco-US 2.07 Oman-US 1.34 Singapore-US 2.19
Table 3: Summary Statistic of Partner States’ Staging Categories
Agreement Rate of Liberalization
Australia-US 3.00 Bahrain-US 1.11 Chile-US 2.33 Jordan-US 7.54 Morocco-US 5.13 Oman-US 1.35 Peru-US 2.34 Singapore-US 1.00
Table 4: Dichotomous Classification of the Terms of Trade Liberalization
Agreement Party Depth Rate
Australia-US U.S. Slow
Bahrain-US U.S. Fast
Chile-US U.S. Fast
Jordan-US U.S. Slow
Morocco-US U.S. Slow
Oman-US U.S. Fast
Singapore-US U.S. Slow
Australia-US Australia Deep Slow
Bahrain-US Bahrain Deep Fast
Chile-US Chile Deep Slow
Jordan-US Jordan Shallow Slow
Morocco-US Morocco Shallow Slow
Oman-US Oman Shallow Fast
Peru-US Peru Shallow Slow