VrtProf: Vertical Profiling for System Virtualization
Hussam Mousa
∗†, Kshitij Doshi
†, Timothy Sherwood
∗and Elmoustapha Ould-Ahmed-Vall
† ∗Department of Computer Science, University of California, Santa Barbara, CA 93116Email: husmousa,[email protected]
†Software Solutions Group, Intel Corporation, Chandler, AZ 85226
Email: hussam.mousa,kshitij.a.doshi, [email protected]
Abstract—As data centers and end users become increasingly reliant on virtualization technology, more efficient and accurate methods of profiling such systems are needed. However, under virtualization the virtual machine and OS each try to manage the same resources independently, the underlying hardware is now multiplexed between many streams of execution, and non-trivial interference can be caused by seemingly unrelated resources. While sampling techniques are effective at gathering average be-haviors over long runs, understanding the time-varying behavior of programs under virtualization, the correlation between events at the level of program phases, or the transient effects of rare events requires a new way of profiling virtualized applications.
To this end we present VrtProf, a low overhead profiling tool that automates the collection of hardware and software events spanning the vertical execution stack, including the hardware, the virtual machine monitor, the guest kernels, and applications at very fine time scales. We describe the many challenges faced while developing VrtProf, the design of the resulting tool, and how it can be used in practice on several multi-programmed workloads both as virtualized and native executions. We show that VrtProf introduces negligible performance overhead of only 1.2% while capturing the time-varying application behavior with interval granularities as small as a few thousand cycles.
I. INTRODUCTION
From the largest cloud computing infrastructure to the smallest mobile desktop, virtualization has become a very popular strategy for providing migration, isolation, and ser-vice agreements across a broad spectrum of parallel software platforms. The potential for consolidating data centers and en-hancing the availability and security of enterprise applications means that many in the industry are eager to carefully evaluate the tradeoffs involved in its adoption [1], [2]. While the per-formance of virtualized systems is always a significant issue, recent generations of hardware support for virtualization have begun closing the gap between native and virtualized execu-tion [3]. However, the story is never that simple. Virtualizaexecu-tion complicates many of the traditional methods by which we measure and understand program performance. The extra layer of abstraction that virtualization introduces further removes the high level software behaviors (that application programmers actually understand) from the underlying hardware resources that determine the performance of the end system.
The ability to profile a full system stack, from the hardware to the application, has shown itself to be useful in many prior works [16], [17]. This is especially true when coupled with information about how those workloads shift and change over time. On a non-virtualized system (i.e. native) this information can be gathered with the hardware performance counters
(HPC) present in most modern processors, and methods to collect [4], [5] and use [6] such counters are not trivial but have been well studied. Gathering such time-based information from a virtualized system is even more challenging because of all the extra sharing, management, and scheduling intro-duced by the virtualization management software, the Virtual Machine Monitor(VMM).
Most prior vertical profiling approaches use the operating system (OS) to manage the many physical and software counters in a meaningful way. Under virtualization, however, even the operating system (and thus everything that runs above it) is scheduled by the VMM; the counters are not directly accessible by the OS, while most interrupts, DTLB misses, and I/O operations (among many other system events) are cap-tured and subsequently remapped according to ever-changing transient relationships. Therefore, capturing and reconstructing an accurate picture of application behavior while both the OS and VMM manage the same resources (sometimes to detrimental effect) is problematic. A tool is needed that will allow application and system developers to see, and eventually model, how the different phases of their applications are effected by both virtualization and sharing.
Along these lines, we introduce a new software tool, VrtProf, specifically built to vertically profile full systems under hardware virtualization support with time granularities as low as a few thousand cycles. While VrtProf builds upon many of the advanced profiling techniques developed in recent years, gathering detailed time-series performance profiles from a virtualized hardware requires a method of synthesizing a picture of the system performance from snapshots taken both across layers and across metrics. To our knowledge, VrtProf is the only low-overhead tool capable of aligning event collection from various distinct sources spanning the vertical system stack, including the HPC, the VMM, the guest OS, and the applications. We describe the methods used in our tool to make time-varying vertical profiling possible with both low overhead and high precision. We outline many of the problems faced in creating such a system, and we evaluate the effectiveness of our tool on real virtualization hardware, and draw some interesting conclusions about the performance of virtualized execution. Specifically, in this paper we make the following contributions:
• We show that fine-grain time-based vertical profiling on
virtualization systems with hardware is possible and we introduce a novel vertical profiling tool, VrtProf, designed
specifically to provide this capability.
• We describe many of the new problems that are encoun-tered when profiling virtualized systems and describe how these problems can be overcome by our software architecture and counter management heuristics.
• We evaluate several of VrtProf’s operational
character-istics, including its overhead and precision as imple-mented in the popular Xen VMM. For practical con-figurations, VrtProf introduces near-negligible overhead, and we show how such a tool provides an unprecidented view of the fine-grain behavior of several virtualized SPECRCPU2006TM [7] and SPECRJBB2005TM [8]
benchmarks.
The remainder of this paper is organized as follows. The next section will introduce the concepts of Virtual Machines and Virtual Machine Monitors, and describes some of the current popular profilers for virtualizaed systems. Section III details the design of VrtProf and describes some important lessons that may benefit other tool builders and users. Section IV describes our experimental setup and operational considera-tions when running VrtProf, and presents several examples that illustrate the use of VrtProf in the analysis and optimization of a subset of SPEC CPU2006 benchmarks in addition to Pseudo JBB. Finally, we describe existing research which VrtProf builds upon or supplements.
II. BACKGROUND
At the heart of a fully virtualized system is the hypervisor, commonly referred to as the Virtual Machine Monitor(VMM). A VMM directly controls and manages all the physical re-sources, including the CPU, memory, IO devices and even interrupt vector assignments. The VMM then allocates these resources to the Virtual Machines as they are created. There are many virtualization strategies ranging from emulation to hard-ware supported virtualization; however, commonly deployed VMM models are divided primarly according to whether or not they rely on hardware support.
In the absence of hardware support for virtualization, one of several software techniques are used to allocate physical resources to VMs. The most common method used in the open source software world is ParaVirtualization (PV) utilized by the popular Xen VMM. Paravirtualization modifies the guest kernel to reroute access to system devices through the VMM. This enables the VMM to perform the necessary verification and ensure isolation and security across the many VMs. PV is not an option when source code for the guest kernel is not available (as in the case with proprietary closed source OS)
Alternatively, in systems with hardware support(e.g. IntelRVT-X [26], the VMs are allowed to execute directly on physical processors unmodified and unaware that they are executing inside a VM. To enable this, the hardware introduces two execution contexts to replace the prior ring 0: VMX root and VMX non-root mode. VMX root are intended for the VMM and allow access to all instructions and all resources. VMs, however, are limited to running in VMX non-root mode, a restricted context which traps certain instructions and
references that either access global state information or affect potentially shared resources.
For exclusively allocated resources (usually physical mem-ory regions or time slots on processor cores), the VM executes unimpeded. For shared resources (such as IO devices) the VMs are exposed to a virtual ”incarnation” of the physical hardware. When a VM accesses these virtual devices (or other restricted resources such as state register) the instructions are trapped by the virtualization logic in the processor and control immediately switches to the VMM (in root VMX). The request is scrutinized for proper permissions and access controls and executed by the VMM on behalf of the VM.
A. Profiling Virtualized Systems
The VMM is a new software layer that is distinct from the VMs and requires its own profiling tools. There are several parallel tools to existing Linux profilers that were implemented to collect runtime information under Xen:
• XenOprof is a port of Oprofile (a popular Linux profiling tool) which captures HPC and assigns them to the proper execution context (i.e. VMM, VM...)
• XenTop replicates the behavior of the Linux Top utility;
however, it captures individual VM runtime behavior instead of process behavior.
• XenTrace records certain system events such a VT Exits,
context switches...
• PerfC, XenStat, XenMon are other tools that collect and aggregate different subsets of events.
There are two main functional limitations to the existing array of virtualization profiling tools:
• The ability to allign and correlate events from different
software contexts. The main challenge to this goal is the significant time skew, and the ”virtualized” view of time maintained in each software context.
• Fine granularity event profiling for both hardware and software events. This limitation is due to the engineering design of many of these existing tools which makes certain assumptions on the usages of the collected data. In section V we will further elaborate on work related to VrtProf. In the next sections we will explain how VrtProf ad-dresses these limitations and how the new capabilities are used to enhance our ability to understand and analyze execution in virtualized system.
III. VRTPROFSOFTWAREARCHITECTURE
Creating a tool that is capable of giving a vertical view of multiple events across a virtualized system at a fine time gran-ularity requires the development a novel software architecture for profiling that can both gather andcommunicateevents very efficiently.
A. Design Considerations
Specifically, VrtProf was designed with the following goals in mind:
Accurate time slices: Event counts from hardware and software sources need to be in time alignment; that is, over
a given span of time, all event counts should be obtained and logged with as little time skew as possible. Alignment in time is needed to allow a better understanding of how specific run-time behaviors in real programs are affected by virtual-ization and to understand how those behaviors change over time. While multiplexing a few available hardware counting resources is unavoidable, it must be performed at fine enough time granularity to allow such analysis.
Minimal software perturbation: Such a tool should be easy to customize and extend, should perturb software (includ-ing the VMM) to a minimal degree, and should be easy to port across hardware architectures. Ideally, this would also mean compatibility with existing profiling utilities (so that those application or OS statistics can be aligned with the hardware performance counters and other low level events).
Minimal performance perturbation: As this is a perfor-mance analysis tool, having as small an impact as possible on the run-time of the end system is critical. The challenge here is that, because VrtProf is aimed at profiling virtualized execution, its data collection needs to simultaneously span multiple execution domains, including the VMM and the guest VMs. A key requirement is to achieve such alignment with minimal synchronization or communication overhead.
Meeting the above goals required the creation of a new verti-cal profiling software architecture, VrtProf. The key decisions in the creation of this software design are:
Location of profiling: To minimize the overhead and
con-centrate the event recording into a single narrow block of Vrt-Prof instructions, we place the primary profiling mechanism within the VMM. Hosting the profiling management logic within the VMM–as opposed to placing it in the supervisor VM(Dom0), as Xenoprof does for example, or distributing it across multiple domains–gives us the ability to see each VM’s context without requiring expensive hypercalls or excessive structure dereferencing. The highest frequency activities are located within a single procedure that has visibility of the necessary state information concerning the VMM, all the VMs, and their virtual processors. However, this simplicity comes at the expense of a lack of direct access to a block device and it makes cheap communication with guest kernels or their user-mode utilities a challenge (which we will discuss in the next section).
Avoidance of Inter-Domain Communication: To minimize
the communication overheads and associated time drifts be-tween logging of profiling data, we avoid inter-domain com-munication for profiling except for initiation and termination of the profiling session. Further along this line, it is desirable to employ shared memory based funneling of updates instead of performing active reads or writes over inter-domain transport mechanisms. Section III-C elaborates on this further.
Elimination of Peformance Perturbations:Any performance
perturbing activities within the profiling mechanism such as al-locating or recycling memory, VMM timer scheduling, are all completely avoided. Furthermore, we confine event collection logic, as far as possible, to the interrupt handler (rather than in a background collector) to minimize interference with the
executing applications being profiled.
B. VrtProf Design
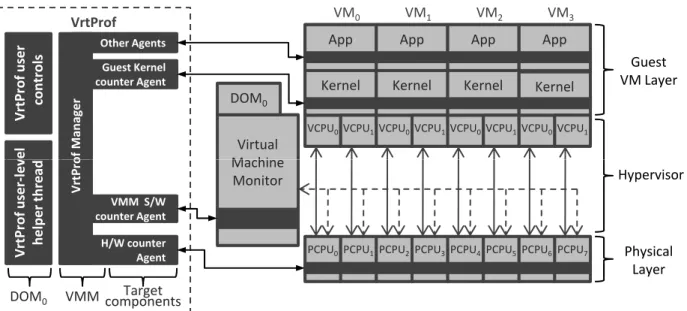
While the above design considerations provide a sketch of our end design, there are many details critical to the perfor-mance of our end system which we outline here. Figure 1 shows the overall design of VrtProf. It consists of these components: a VrtProf Manager, a HPC management agent, a VMM software counter agent, several Guest Kernel counter agents, a set of extensible guest user agents, and User level controls. To expand instrumentation, additional agents can be defined or existing utilities can be integrated into VrtProf as new agents. The specific duties and interactions of these components are as follows:
1) VrtProf Manager: This component resides in the VMM.
It receives requests for initiating and terminating profiling sessions. It triggers the various profiling agents requested by the user and periodically sweeps the data from each of the profiling data sources into a common collection buffer. It allocates bulk memory at load time, in which it maintains a page aligned circular buffer where data from many intervals can be aggregated before being flushed to persistent store by a Dom0 helper daemon.
2) HPC Agent: This is an architecture-specific agent and
contains the mechanisms for programming or reading the HPC registers in order to collect hardware event counts at the desired interval granularity, and to multiplex the HPC resources to cover the requested events. It also implements the logic to program for, and receive and handle, the counter-overflow interrupts for driving profiling. While clock cycles or any one of a large number of HPC events can be used as a basis to set multiplexing interval, in the current version of VrtProf, we have used retired instruction count as the basis for defining event multiplexing intervals.
3) VMM Software Counter Agent(s): These agents are
VMM specific. In this version we only implement VrtProf on Xen, so we use Xen software counter infrastructures such as perfc and Xentrace for capturing the event counts. We modify these utilities so that we can read or reset the counters with simple loads and stores from other VrtProf modules.
4) Guest Kernel Counter Agents: We capitalize on guest
kernel instrumentations, such as sysstat or vmstat utilities, to collect profile data in those guests. Naturally, these utilities run outside the VMM address space and privilege, and so to achieve low overhead access to these data collection utilities, we instrument the guest kernel to set up a shared memory region into which counter updates get redirected. VrtProf then periodically reads these counters. Due to the requirement of modifying the guest kernel source code, this is an optional feature for select VM OS.
5) Other (Extensible) Agents: VrtProf is designed to easily
incorporate additional existing or custom profiling data sources at build time. Each of the three agents listed above, i.e. the HPC, the VMM, and the guest VM kernel event data collectors, is an example of an extensible agent. Existing
o f M anager VM0 VM1 VM2 VM3 App VCPU0 Kernel VCPU1 App VCPU0 Kernel VCPU1 App VCPU0 Kernel VCPU1 App VCPU0 Kernel VCPU1 Other Agents Guest Kernel counter Agent VrtProf user controls vel Virtual M hi VrtProf DOM0 Guest VM Layer VrtPr o H/W counter
Agent PCPU0 PCPU1PCPU2PCPU3PCPU4PCPU5PCPU6PCPU7
VrtProf user ‐ le v helper thread Machine Monitor VMM S/W counter Agent Physical Layer Hypervisor
DOM0 VMM componentsTarget
Fig. 1. VrtProf architecture design (shown with a 4 Virtual Machine configuration on an 8 core system). Four different profiling agents are displayed. The user level components (to the left) are decoupled from the VMM and guest level components during active profiling. (Note: the 1:1 correspondance between virtual CPU (VCPU) and physical CPU (PCPU) if for clarity and illustrations. In reality the pairings are dynamic and fluid.)
instrumentation such as Xenoprof, which is not part of VrtProf yet, is being added as an extensible agent at this time.
6) VrtProf User Controls: Two controls run at the user
level in Dom0. One provides the ability to initiate or terminate profiling sessions, which are actions requiring direct interac-tion between Dom0 user level and the VMM. The second control (referred to in figure 1 as ”VrtProf user-level helper thread”) consists of a daemon that periodically sleeps for several seconds, wakes up, copies new data from the data buffer (see VrtProf manager, above) to a file, and sleeps again.
C. Engineering Tradeoffs
As noted above, a key objective is to obtain aligned event counts from hardware and software layers and to do so at a high collection frequency. Furthermore, the PMU data collection needs to multiplex the scarce counter resources among the different types of profiled events. This allows us to record the densities of multiple different types of events within each high resolution collection interval.
These considerations led to hand-optimizing the instructions that run in the HPV interrupt handler, which read and re-program the HPC event registers, and which update the log buffer with the event counts. Performance data is collected into the log buffer in the form of a two-dimensional table, with a column per event and a row per interval. A global interval counter is maintained and all processors record their event counts (from the HPC and other agents) into the table using the modulo of the counter and buffer size as the row index. This avoids the need to bring the processors to a barrier before logging the event counts. The processors make a local copy of the interval number before using it as row index, so spin locking the interval number is unnecessary. This strategy complicates the portability of our implementation to different processors and so we have reduced to a minimum the number
of instructions needed to participate in this monolithic index management.
We also avoid synchronization overhead in the interaction between the VMM resident data logging code and the user level thread that commits the event data from the log buffer to persistent store. In essence, it is a single producer-single consumer interaction: the producer in this case is the VMM resident code that inserts event data from all agents into the (circular) log buffer, while the consumer is the user level thread that repeatedly sleeps for several seconds and then commits any updates that were made in the log buffer. Since rows are indexed by the interval count, any loss of information that can occur when the producer gets too far ahead of the consumer is easily noticed, and corrective action can be taken (if desired) by changing the rate at which the consumer is activated or adjusting the memory available for data buffering.
Finally, since VrtProf is designed to provide an identical profiling environment for both native and virtualized environ-ments, we need to port VrtProf to work with the native guest Kernel. Unfortunately, the tight integration of the event logging logic within the VMM code means that we are unable to directly restructure it as a pseudo device driver, which could be reused without modification in a natively executing OS kernel. Fortunately, only the VMM resident code needs to be ported into native kernels, while the remaining elements –including the agents – are mostly identical with only minor differences. Another key difference is in the shared memory transport: kernel-user sharing in native instances is setup differently from the VMM-guest sharing of memory that is needed for enabling coordinated profiling under virtualization. We have implemented identical facilities for aligning profiles in native and virtualized cases and have found that we achieve identical overheads and precision in the two situations.
Parameter
Description
Range HPC Event Count The number of hardware events that are simultaneously
col-lected
2-20 events Interval Width Number of retired instruction in a single interval. Low values
may increase overhead and perturb the profiled application. High number may reduce the precision and usefulness of subsequent analysis.
2-400 mil. instr.
Multiplex Interval Width (Derivative) Interval width (in retired instructions) divided by the interval count. This is the effective sampling rate.
1-20 mil. instr. Monitor Sleep Time Time in seconds before the monitoring thread will read data
from the shared circular buffer and write them to disk
1-20 seconds Runtime Data Buffer Size Number of records in the circular buffer. Larger buffers allow
longer sleep times before records need to be persisted without loss of data. They also increase the memory footprint of the VMM component of VrtProf (and in consequence the VMM footprint)
210- 213records (set at build time)
TABLE I
VRTPROF PARAMETERS THAT AFFECT OVERHEAD AND PRECISION.
IV. EXAMPLEUSAGE ANDAPPLICATIONS OFVRTPROF A. VrtProf Configuration
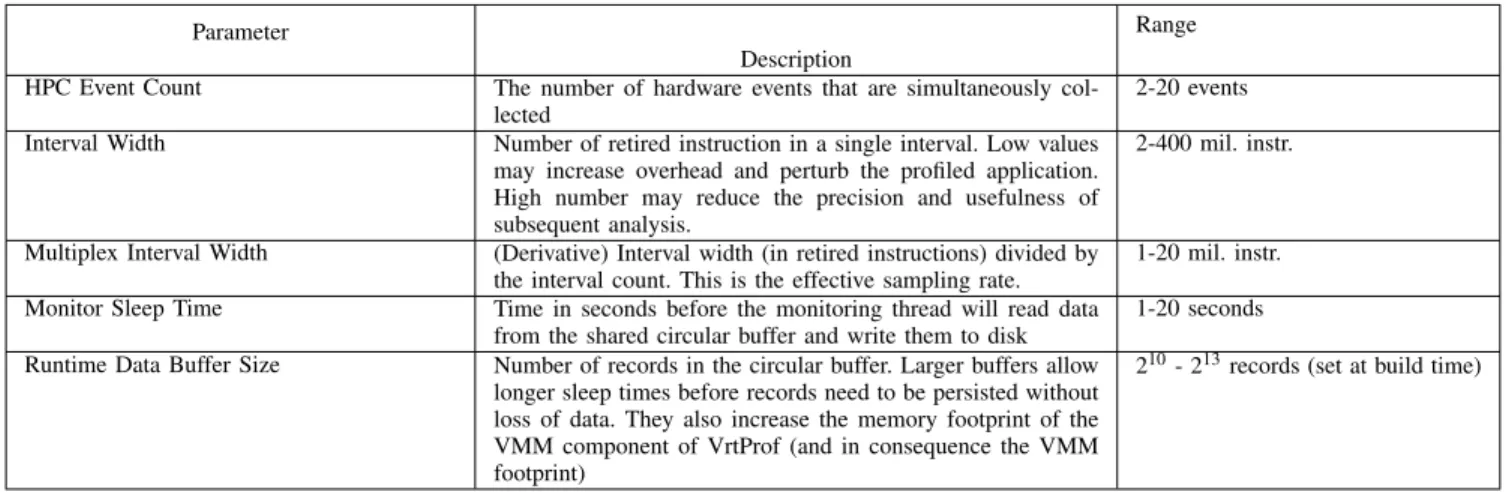
Table I lists the customizable VrtProf parameters, describes each parameter and specifies the range of values that reason-ably bound the parameter. The range column in table I can have a different set of bounds that may be reasonable for dif-ferent benchmarks and under difdif-ferent system environments; therefore, some pilot experimentation is necessary to pick a value that draws a balance between the cost of instrumentation and the desired interval resolution for the measured data. We briefly explain the contents of table I next.
• HPC Events: Because of the limited number of hardware event counters in modern processors, we use multiplexing at the HPC level to collect processor hardware counters. Most of processors such as the one used in the measur-ments described in the next section support the simulta-neous collection of at least 2 types of HPC events. The high end range of 20 (i.e., simultaneous collection of 20 events in each measurement interval) is due to a decision to hardwire a limit of 20 on this parameter to simplify the testing of VrtProf during its initial implementation stage. Of course, this upper bound can be easily changed.
• Interval Width: As described in preceding sections, Vrt-Prof divides the workload execution time into intervals of equal length using a reference event. By default, we use instructions retired as the reference event. As shown in row 2 of table I, VrtProf can be run with an interval width as small as 2 million instructions without causing a noticeable overhead. We recommend a maximum interval width of 400 million instructions because we noticed that at higher widths, we began to lose phase distinctions in both HPC and VMM data.
• Multiplexing Interval Width: In each interval, few counter
registers of the HPC can be used for profiling simultane-ously. To collect more events, we divide each collection interval into several subintervals each of which collects a subset of the events in a round-robin fashion. This
parameter denotes the width of such subintervals. The number of these intervals is also derived by dividing the number of profiled HPC events by the number of available physical HPC registers (e.g., 2). Since we have currently a limit of 20 different HPC events that VrtProf may collect simultaneously, practical multiplexing inter-val widths ranges from a low of 1 million to a high of 20 million instructions. Lower values will cause significant workload perturbation, while higher values will degrade the statistical representation of the multiplexed events. The number of multiplexing subintervals will range from 1 to 10.
• Monitor Sleep Time: This parameter determines how long
the user-level helper thread sleeps between flushing data collected by VrtProf to persistent store. With potentially 20 events collected and with interval widths that are only a few million instructions, we found it necessary to limit the monitor sleep time to 20 seconds, since higher numbers will result in a large number of missed intervals. Values smaller than 1 second introduce a lot of perturbation and overhead to the profiled system.
• Collection Buffer Size: This parameter determines how large the collection buffer can be in number of records while waiting for the monitoring thread to commit the data to persistent store. We experimented with a range of values and found that a collection buffer of size between a thousand and eight thousand records provided sufficient data holding (Our buffer size was fixed at 8MB. The number of records was set to fit in that buffer).
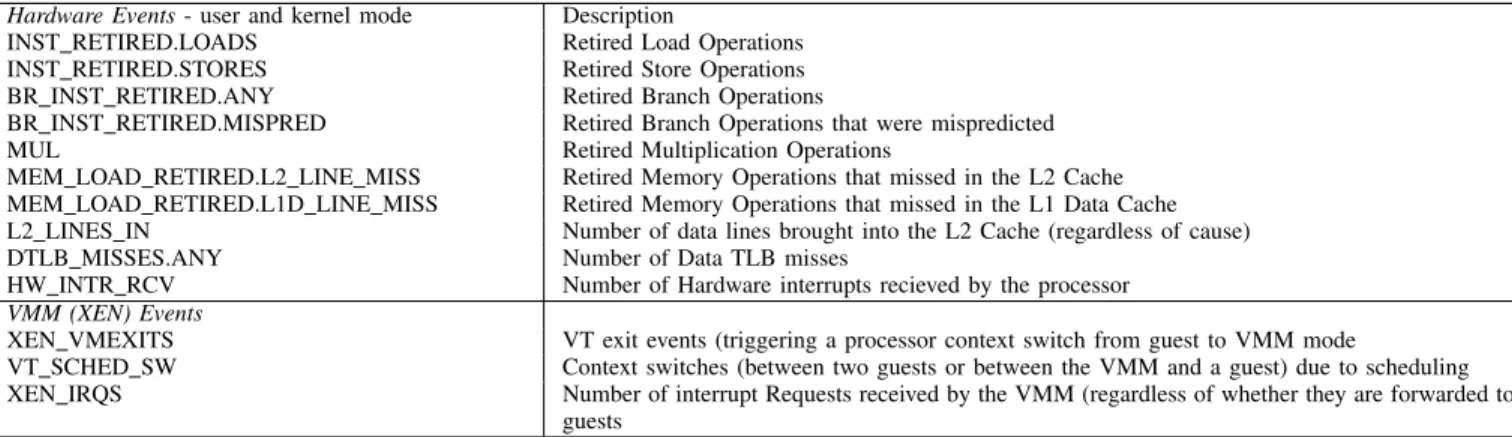
For the experiments described in the subsequent sections, we collect the events listed in table II with an interval width of 50 million retired instructions. Recall that this implies a multiplexing subinterval width of 2.5 million retired instruc-tions. We set the helper thread’s sleep time to 1 second, which is enough to keep up with the interval data generated by the 8 physical CPUs.
Hardware Events- user and kernel mode Description
INST RETIRED.LOADS Retired Load Operations INST RETIRED.STORES Retired Store Operations BR INST RETIRED.ANY Retired Branch Operations
BR INST RETIRED.MISPRED Retired Branch Operations that were mispredicted
MUL Retired Multiplication Operations
MEM LOAD RETIRED.L2 LINE MISS Retired Memory Operations that missed in the L2 Cache MEM LOAD RETIRED.L1D LINE MISS Retired Memory Operations that missed in the L1 Data Cache L2 LINES IN Number of data lines brought into the L2 Cache (regardless of cause)
DTLB MISSES.ANY Number of Data TLB misses
HW INTR RCV Number of Hardware interrupts recieved by the processor VMM (XEN) Events
XEN VMEXITS VT exit events (triggering a processor context switch from guest to VMM mode
VT SCHED SW Context switches (between two guests or between the VMM and a guest) due to scheduling XEN IRQS Number of interrupt Requests received by the VMM (regardless of whether they are forwarded to any
guests
TABLE II
HARDWARE AND SOFTWARE EVENTS COLLECTED BYVRTPROF FOR THE ANALYSIS IN SECTIONIV
Native Virtualized
System IntelRXeonTMX5355 Quad Core x2 (total 8 cores)
Specifications
2.66GHz Core Clock - 1333MHz Bus Speed 8MB L2 Cache per chip (16MB total)
16GB Main Memory Operating
Sys-tem SUSE Linux 2.6.16.46-0.12
Virtual Machine Monitor
NA XenR3.0.4
TABLE III
HARDWARE ANDSOFTWARE ENVIRONMENT USED FOR THE EXPERIMENTS
DESCRIBED IN THIS PAPER.
B. Experimental Virtualized System Setup
Table III describes the hardware, VMM, and kernel used in our measurement system setup. We use an alpha version of VrtProf for the Xen VMM. Specifications of the system we use are listed in table III.
As we are concentrating on the potential usefulness of the described tool, and not attempting to draw broader conclusions about virtualization performance at large, we have selected benchmarks that we have found–through comprehensive pilot evaluations–to exhibit some interesting behaviors, including a significant divergence between native and virtual execution, particularly high or low CPIs, or significant expansions of the Path Length (dynamic committed instructioncount).
We run 6 benchmarks from the SPEC CPU2006 suite, including both integer and floating point benchmarks. We also use Pseudo JBB [9], an adaptation of SPEC JBB2005 that is designed to run a predetermined number of transactions instead of running for a specified amount of time.
In addition to the experiments run to present the findings in sections IV-C and IV-D, we also evaluate the overhead of Vrt-Prof by comparing the execution time when collecting profile data for the above benchmarks under three circumstances:
• While VrtProf is unloaded.
• While VrtProf is set to a very low frequency (the smallest possible sampling rate without overflowing the counters).
Benchmark RT with VrtProf RT without VRTPROF Overhead(%) 403.gcc 5362.4 5268.8 -1.78% 416.gamess 1425.0 1448.0 1.59% 429.mcf 3185.6 3205.8 0.63% 433.milc 4882.9 4919.5 0.74% 465.tonto 6192.7 6108.0 -1.39% 481.wrf 2965.7 3013.9 1.60% Pseudo JBB 2578.0 2646.6 2.59% Geomean 2578.0 2646.6 1.34% TABLE IV
RUNTIME OF THE BENCHMARKS WITHVRTPROF(COLUMN2)AND
WITHOUTVRTPROF(COLUMN3). THE OVERHEAD
• With VrtProf set to a practical sampling frequency that affords an acceptable error rate.
Table IV presents the runtime for the evaluated benchmarks. We found that across all our profiling scenarios, the execution times for the above three cases are within 1-2% of each other and they even presented very similar variances, suggesting that the overhead introduced by VrtProf is essentially negligible. The geomean of the overheads across the tested benchmarks was 1.34%1 The two negative overhead benchmarks are long
executing benchmarks with a very high rate of DTLB and L2 misses, and a high rate of VT exits. This likely masks any overhead introduced by VrtProf, and the negative overhead simply represents the noise of run to run variation.
Finally, examining the effect of virtualization requires going beyond an understanding of simply ”virtualized” and ”non-virtualized” systems. Multiple applications, and multiple in-stances of applications, can all run under a single operating system, and multiple operating systems can run across multiple virtual machines, all of which can be scheduled across a variety of physical machines. For the purposes of this eval-uation we have considered how a set of identical application runs can be distributed across VM guests. Specifically, we have collected event data from the benchmarks under the 1The modulo of the negative values was used to compute the geomean of the overheads. If those values were eliminated from the computation the geomean of the overheads will be 1.253%.
following system configurations: Native (no VM, all apps run on a single OS), and Virtualized with 1, 2, 4, and 8 guests (with benchmark copies distributed evenly across those guests). Since the system has 8 physical CPUs, we alter the number of virtual CPUs allocated to the guests so that there is always a 1:1 correspondence between physical and virtual CPUs. Further, in order to saturate the system with a homogeneous workload, we run 8 parallel copies of the profiled benchmark under all configurations (also to maintain a 1:1 correspondence with the number of physical CPUs). In the case of 1, 2, 4, and 8 guest VMs we respectively run 8, 4, 2, and 1 copies of the benchmark on each VM. We configure VrtProf to collect the events listed in table II at an interval rate of 100 million events (i.e. a multiplexing interval of 5 million events). Each architectural event is collected twice, in USER and KERNEL mode (denoted by a U and K prefix during the results presentation in sections IV-C and IV-D). KERNEL events capture both the VMM and the guest kernel’s behavior. Future versions of vrtprof will employ software methods of separating the two components.
Now that we have described the operational parameters involved with VrtProf, we describe a few scenarios in which its unique abilities can be useful. In particular, we have conducted a series of experiments designed to show how virtualization effects a set of executing applications. While we limit this study to a subset of the benchmarks from SPEC CPU2006 and Pseudo JBB, the main point of this section is to show how VrtProfcan be usedto evaluate the many different aspects of virtualized system performance.
These experiments have allowed us to consider the effects of virtualization on low level architectural metrics, the changes in the reasons for VT exits (an expensive operation), and the effect of changing the VM load distribution on several hardware level events.
C. Event Correlation
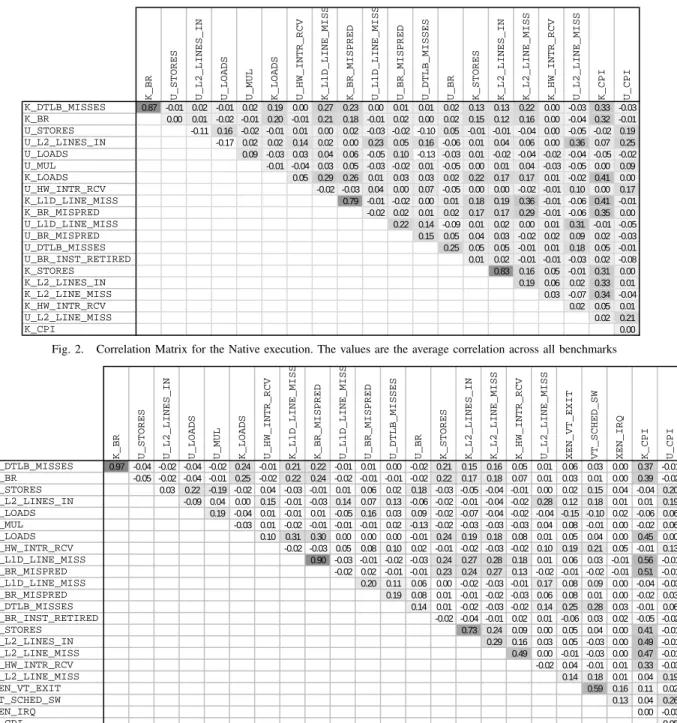
The analysis space for our experiment is very large. The combination of events that can be examined and the number of benchmarks and experimental configurations is prohibitively large. One strategy is to use a correlation matrix to identify the pairs of events that have some degree of correlation and subject them to further study.
Another strategy is to compare correlation values across different experimental configurations and note significant changes. Such changes can identify event relationships that are subject to change because of Virtualization.
Figures 2 and 3 can illustrate both strategies. In the native case, we can observe a high correlation between Kernel DTLB misses and Kernel Branch instructions. This likely due to the DTLB miss resolution, which involves a walk of the Page Tables, a very ”branchy” operation.
While examining the Virtualization correlation matrix (for the 8 guest example) we observe a similar trend to the native case for many of the architectural events. One stark difference is the higher correlation of the Kernel CPI to several architecture events in the case of Virtualization.
In the Virtualization example, we also observe some in-teresting correlation trends between Virtualization events and some architectural events. The correlation values are generally small–due to the significant difference in magnitude between VT and architectural events. Nevertheless, User level DTLB misses and Hardware Interrupts demonstrate a slightly elevated value, since both these events almost always trigger a VT exit.
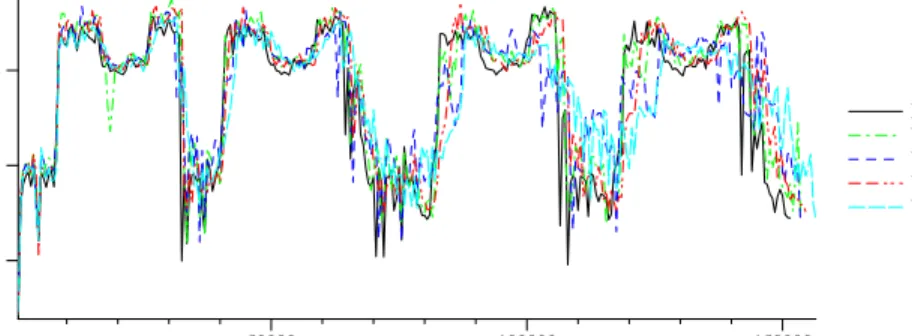
D. Event Timeline
Another very useful utility of VrtProf’s high granularity interval-based event collection is the ability to visualize the execution timeline in terms of specific event rates. Figures 4 to 7 show several examples of such visualizations. 1 433.milc shows a very clear pseudo-regular pattern, while Pseudo JBB is essentially a flat single-phased benchmark. One of the primary benefits of VrtProf is the ability to capture and visualize the phase behavior of benchmarks. Most existing tools lack either the interval-based capability or the granularity to capture such behaviors.
One of the very interesting trends captured by our visualiza-tion is the regularity of VT exit operavisualiza-tions during the execuvisualiza-tion of 433.milc in all of the VT execution modes, while also highlighting the difference in magnitude. During the second peak (around the 30K instruction retired marker), the VT exit rate is inversely proportional to the number of guests, whereas later in the execution this almost perfect relationship breaks. This is a very good example of the value of time series visualization over the reliance on coarse grained averaged data. (The exact cause of this behavior requires additional source code-level analysis).
V. RELATEDWORK
Our work builds on many past efforts to provide perfor-mance analysis for virtualized systems. For example, several VMM profiling utilities, XenTrace [10], XenTop [11], Perfc and XenMon [12] to name few, are built directly into Xen. Both XenTrace and Perfc have been adapted as plugin agents to VrtProf and operate as an event counter source for the hypervisor layer.
The closest existing tool to VrtProf is most likely Xeno-prof [13], which is a system-wide profiling tool that sup-ports both timing-based (e.g. through a tsc counter) and hardware performance counter event collection. It is based on the popular Oprofile [14] tool which allows the user to profile the executing code base of both the application and the kernel, by sampling the Instruction Pointer register whenever a sampling trigger is generated. Oprofile allows for several hardware performance counters to trigger sampling at arbitrarily defined frequencies and even attempts to resolve the Instruction Pointer into a source code line if debugging information is available in the loaded Object files. Xenoprof provides Oprofile functionality within the scope of the VMM by sampling the VMM and the supervisor kernel (Dom0) code 1We intentionally chose events and benchmarks with low noise levels and interesting variation pattern to demonstrate these visualizations.
K_BR U_STORES U_L2_LINES_IN U_LOADS U_MUL K_LOADS U_HW_INTR_RCV K_L1D_LINE_MIS
S
K_BR_MISPRED U_L1D_LINE_MIS
S
U_BR_MISPRED U_DTLB_MISSES U_BR K_STORES K_L2_LINES_IN K_L2_LINE_MISS K_HW_INTR_RCV U_L2_LINE_MISS K_CPI U_CPI K_DTLB_MISSES 0.87 -0.01 0.02 -0.01 0.02 0.19 0.00 0.27 0.23 0.00 0.01 0.01 0.02 0.13 0.13 0.22 0.00 -0.03 0.33 -0.03 K_BR 0.00 0.01 -0.02 -0.01 0.20 -0.01 0.21 0.18 -0.01 0.02 0.00 0.02 0.15 0.12 0.16 0.00 -0.04 0.32 -0.01 U_STORES -0.11 0.16 -0.02 -0.01 0.01 0.00 0.02 -0.03 -0.02 -0.10 0.05 -0.01 -0.01 -0.04 0.00 -0.05 -0.02 0.19 U_L2_LINES_IN -0.17 0.02 0.02 0.14 0.02 0.00 0.23 0.05 0.16 -0.06 0.01 0.04 0.06 0.00 0.36 0.07 0.25 U_LOADS 0.09 -0.03 0.03 0.04 0.06 -0.05 0.10 -0.13 -0.03 0.01 -0.02 -0.04 -0.02 -0.04 -0.05 -0.02 U_MUL -0.01 -0.04 0.03 0.05 -0.03 -0.02 0.01 -0.05 0.00 0.01 0.04 -0.03 -0.05 0.00 0.09 K_LOADS 0.05 0.29 0.26 0.01 0.03 0.03 0.02 0.22 0.17 0.17 0.01 -0.02 0.41 0.00 U_HW_INTR_RCV -0.02 -0.03 0.04 0.00 0.07 -0.05 0.00 0.00 -0.02 -0.01 0.10 0.00 0.17 K_L1D_LINE_MISS 0.79 -0.01 -0.02 0.00 0.01 0.18 0.19 0.36 -0.01 -0.06 0.41 -0.01 K_BR_MISPRED -0.02 0.02 0.01 0.02 0.17 0.17 0.29 -0.01 -0.06 0.35 0.00 U_L1D_LINE_MISS 0.22 0.14 -0.09 0.01 0.02 0.00 0.01 0.31 -0.01 -0.05 U_BR_MISPRED 0.15 0.05 0.04 0.03 -0.02 0.02 0.09 0.02 -0.03 U_DTLB_MISSES 0.25 0.05 0.05 -0.01 0.01 0.18 0.05 -0.01 U_BR_INST_RETIRED 0.01 0.02 -0.01 -0.01 -0.03 0.02 -0.08 K_STORES 0.83 0.16 0.05 -0.01 0.31 0.00 K_L2_LINES_IN 0.19 0.06 0.02 0.33 0.01 K_L2_LINE_MISS 0.03 -0.07 0.34 -0.04 K_HW_INTR_RCV 0.02 0.05 0.01 U_L2_LINE_MISS 0.02 0.21 K_CPI 0.00
Fig. 2. Correlation Matrix for the Native execution. The values are the average correlation across all benchmarks
K_BR U_STORES U_L2_LINES_IN U_LOADS U_MUL K_LOADS U_HW_INTR_RCV K_L1D_LINE_MIS
S
K_BR_MISPRED U_L1D_LINE_MIS
S
U_BR_MISPRED U_DTLB_MISSES U_BR K_STORES K_L2_LINES_IN K_L2_LINE_MISS K_HW_INTR_RCV U_L2_LINE_MISS XEN_VT_EXIT VT_SCHED_SW XEN_IRQ K_CPI U_CPI K_DTLB_MISSES 0.97 -0.04 -0.02 -0.04 -0.02 0.24 -0.01 0.21 0.22 -0.01 0.01 0.00 -0.02 0.21 0.15 0.16 0.05 0.01 0.06 0.03 0.00 0.37 -0.01 K_BR -0.05 -0.02 -0.04 -0.01 0.25 -0.02 0.22 0.24 -0.02 -0.01 -0.01 -0.02 0.22 0.17 0.18 0.07 0.01 0.03 0.01 0.00 0.39 -0.02 U_STORES 0.03 0.22 -0.19 -0.02 0.04 -0.03 -0.01 0.01 0.06 0.02 0.18 -0.03 -0.05 -0.04 -0.01 0.00 0.02 0.15 0.04 -0.04 0.20 U_L2_LINES_IN -0.09 0.04 0.00 0.15 -0.01 -0.03 0.14 0.07 0.13 -0.06 -0.02 -0.01 -0.04 -0.02 0.28 0.12 0.18 0.01 0.01 0.19 U_LOADS 0.19 -0.04 0.01 -0.01 0.01 -0.05 0.16 0.03 0.09 -0.02 -0.07 -0.04 -0.02 -0.04 -0.15 -0.10 0.02 -0.06 0.06 U_MUL -0.03 0.01 -0.02 -0.01 -0.01 -0.01 0.02 -0.13 -0.02 -0.03 -0.03 -0.03 0.04 0.08 -0.01 0.00 -0.02 0.06 K_LOADS 0.10 0.31 0.30 0.00 0.00 0.00 -0.01 0.24 0.19 0.18 0.08 0.01 0.05 0.04 0.00 0.45 0.00 U_HW_INTR_RCV -0.02 -0.03 0.05 0.08 0.10 0.02 -0.01 -0.02 -0.03 -0.02 0.10 0.19 0.21 0.05 -0.01 0.13 K_L1D_LINE_MISS 0.90 -0.03 -0.01 -0.02 -0.03 0.24 0.27 0.28 0.18 0.01 0.06 0.03 -0.01 0.56 -0.01 K_BR_MISPRED -0.02 0.02 -0.01 -0.01 0.23 0.24 0.27 0.13 -0.02 -0.01 -0.02 -0.01 0.51 -0.01 U_L1D_LINE_MISS 0.20 0.11 0.06 0.00 -0.02 -0.03 -0.01 0.17 0.08 0.09 0.00 -0.04 -0.03 U_BR_MISPRED 0.19 0.08 0.01 -0.01 -0.02 -0.03 0.06 0.08 0.01 0.00 -0.02 0.03 U_DTLB_MISSES 0.14 0.01 -0.02 -0.03 -0.02 0.14 0.25 0.28 0.03 -0.01 0.06 U_BR_INST_RETIRED -0.02 -0.04 -0.01 0.02 0.01 -0.06 0.03 0.02 -0.05 -0.02 K_STORES 0.73 0.24 0.09 0.00 0.05 0.04 0.00 0.41 -0.01 K_L2_LINES_IN 0.29 0.16 0.03 0.05 -0.03 0.00 0.49 -0.01 K_L2_LINE_MISS 0.49 0.00 -0.01 -0.03 0.00 0.47 -0.01 K_HW_INTR_RCV -0.02 0.04 -0.01 0.01 0.33 -0.03 U_L2_LINE_MISS 0.14 0.18 0.01 0.04 0.19 XEN_VT_EXIT 0.59 0.16 0.11 0.02 VT_SCHED_SW 0.13 0.04 0.26 XEN_IRQ 0.00 -0.03 K_CPI 0.05
Fig. 3. Correlation Matrix for the eight guest VT mode execution. The values are the average correlation across all benchmarks. Note the additional VT events.
50000 100000 150000
Execution progress in Instructions Retired 50
100 150 200
VT Exit per instruction
VT 1G VT 2G VT 4G VT 8G
50000 100000 150000 Execution progress in Instructions Retired
0.02 0.03 0.04
U_L2_LINES_IN per instruction
Native VT 1G VT 2G VT 4G VT 8G
Fig. 5. The rate of User level L2 Cache Line reads over the duration of the benchmark 433.milc for the different VT modes and the Native execution
50000 100000 150000 200000 250000
Execution progress in Instructions Retired 0.005
0.010 0.015
U_L2_LINES_IN per instruction
Native VT 1G VT 2G VT 4G VT 8G
Fig. 6. The rate of User level L2 Cache Line reads over the duration of the benchmark Pseudo JBB 2005 for the different VT modes and the Native execution
50000 100000 150000
Execution progress in Instructions Retired 0.002
0.004 0.006
U_DTLB_MISSES per instruction
Native VT 1G VT 2G VT 4G VT 8G
Fig. 7. The rate of User level DTLB misses over the duration of the benchmark 433.milc for the different VT modes and the Native execution
maps upon receiving sampling triggers. It also extends virtu-alization support to the guest Virtual Machines by forwarding the sampling signals triggered by hardware counter overflows (all of which are managed within the VMM) to all the guests registered to receive such a signal. Xenoprof also supports passive profiling, ignoring specific code lines executing within the guests and simply registering the specific domain that was being serviced at the instance of the sampling trigger.
While Xenoprof does provide significant VMM profiling capabilities, it and VrtProf are complementary tools designed for different types of analysis. Specifically, VrtProf provides the following additional feature:
• Concurrently sample event counters from various sources
(including the hardware, VMM and guests).
• Align and present events from different vertical contexts. • Multiplex the collection of several hardware events across
a limited set of physical counters.
• Collect events at a very fine granularity - as little as a
few thousand cycles or retired instructions
The result of these features is the ability to capture the time varying behavior of events and enable the types of studies presented earlier in this paper.
Our work also relates to research within the sphere of online profiling and performance characterization and anal-ysis. VrtProf is essentially a vertical full system profiler for virtualization. The authors in [15], [16] have developed and utilized vertical full system profiling in the study of Java Virtual Machine performance. In [17] the authors also utilize Full System profiling, although in a simulation context, to analyze and identify bottlenecks in the networking subsystem of the Linux Kernel.
Performance characterization and analysis is a very active field. VrtProf is an enabling tool for this research, and the CPI decomposition and modeling, such as done in [18], [19], [20], [21] in virtualization contexts, and [6], [22], [23] in native contexts is one of the original objectives of VrtProf.
Additional profiling tools also aid in this and other objectives; for example [24], [25], [4], [5] are used for profiling across the kernel boundary, profiling embedded devices, managing hardware performance counters, and identifying and visualiz-ing performance bottlenecks respectively.
VI. CONCLUSION
As virtualization becomes an increasingly integral part of modern software design, the application behavior is further removed from the complex details of the underlying sys-tem software and hardware. While this may prove to be a significant advantage for those responsible for tackling a huge variety of system-level challenges, the performance of the resulting applications is harder to comprehend because it is yet another step removed from the underlying hardware environment. In fact, the performance of the resulting system is impacted by decisions across the whole vertical stack, from the hardware, to the virtual machine, to the multiple operating systems at the guest level, all the way up to the application itself. To truly understand the performance of such a machine, tools combining information from all of these sources into a cohesive picture are needed. This paper introduces VrtProf, a tool that provides such a functionality.
To create VrtProf we have pulled information from the hardware, hypervisor, VM kernel and application layers, then aligned them according to predefined criteria (e.g. retired instructions). We made sure our system has minimal overhead to support the fine granularity necessary for the forms of analysis we believe are necessary to comprehend virtualized system execution. We also achieved this with a software architecture that is flexible to expand and incorporate future requirements for virtualized system profiling.
Looking toward the future, we see many ways in which VrtProf can be used in real world scenarios. For example, system administrators and Data Center designers could use VrtProf in evaluating the efficiency of a given configuration at the architecture and system software level, ultimately aiding and guiding the customizations and the co-location of various applications for virtualization and consolidation. We believe that our current tool will prove to be a useful utility in under-standing and subsequently optimizing applications designed to operate in a virtual environment, and has the potential to act as a platform around which production quality VM optimization systems could grow.
REFERENCES
[1] M. Rosenblum and T. Garfinkel, “Virtual machine monitors: current technology and future trends,”IEEE Computer, vol. 38, no. 5, pp. 39– 47, MAY 2005.
[2] N. Inc, “Virtualization in the data center,” Novell Inc, Tech. Rep. 462-002015-001, MAY 2006.
[3] K. Adams and O. Agesen, “A comparison of software and hardware techniques for x86 virtualization,” inProceedings of the 12th interna-tional conference on Architectural support for programming languages and operating systems (ASPLOS). New York, NY, USA: ACM, 2006, pp. 2–13.
[4] S. Browne, J. Dongarra, N. Garner, G. Ho, and P. Mucci, “A portable programming interface for performance evaluation on modern proces-sors,”International Journal for High Performance Computer Applica-tions, vol. 14, no. 3, pp. 189–204, 2000.
[5] “Vtune: A visual tuning environment.” [Online]. Available: http: //support.intel.com/support/performancetools/vtune/
[6] S. Eyerman, L. Eeckhout, T. Karkhanis, and J. Smith, “A performance counter architecture for computing accurate cpi components,” in Pro-ceedings of the 12th international conference on Architectural support for programming languages and operating systems (ASPLOS). New York, NY, USA: ACM, 2006, pp. 175–184.
[7] “Spec cpu2006.” [Online]. Available: http://www.spec.org [8] “Spec jbb2005.” [Online]. Available: http://www.spec.org
[9] S. Blackburn, “Pseudo jbb2005.” [Online]. Available: http://cs.anu.edu. au/∼Steve.Blackburn/
[10] M. Williamson, “Xentrace.”
[11] J. Fischbach, D. Hendricks, and J. Triplett, “Xentop,” Xen builtin Utility, 2005.
[12] D. Gupta, R. Gardner, and L. Cherkasova, “Qos monitoring and perfor-mance profiling tool,” HP, Tech. Rep. HPL-2005-187, OCT 2005. [13] A. Menon, J. R. S., Y. Turner, G. Janakiraman, and W. Zwaenepoel,
“Diagnosing performance overheads in the xen virtual machine environ-ment,” inProceedings of the 1st ACM/USENIX international conference on Virtual execution environments (VEE). New York, NY, USA: ACM, 2005, pp. 13–23.
[14] J. Levon, “Oprofile.” [Online]. Available: http://oprofile.sourceforge.net [15] H. Mousa, C. Krintz, L. Youseff, and R. Wolski, “Viprof: Vertically integrated full-system performance profiler,” in Workshop on Next-Generation Software (w/IPDPS), March 2007, pp. 63–74.
[16] M. Hauswirth, A. Diwan, P. Sweeney, and M. Mozer, “Automating vertical profiling,” inProceedings of the 20th annual ACM SIGPLAN conference on Object oriented programming, systems, languages, and applications (OOPSLA). New York, NY, USA: ACM, 2005, pp. 281– 296.
[17] A. Saidi, N. Binkert, S. Reinhardt, and T. Mudge, “Full-system criti-cal path analysis,” inIEEE International Symposium on Performance Analysis of Systems and software (ISPASS), April 2008, pp. 63–74. [18] L. Youseff, R. Wolski, B. Gorda, and C. Krintz, “Evaluating the
perfor-mance impact of xen on mpi and process execution for hpc systems,” in 2nd International Workshop on Virtualization Technology in Distributed Computing (VTDC). Washington, DC, USA: IEEE Computer Society, 2006, p. 1.
[19] P. Apparao, S. Makineni, and D. Newell, “Characterization of network processing overheads in xen,” in Proceedings of the 2nd Interna-tional Workshop on Virtualization Technology in Distributed Computing (VTDC). Washington, DC, USA: IEEE Computer Society, 2006, p. 2. [20] L. Cherkasova and R. Gardner, “Measuring cpu overhead for i/o process-ing in the xen virtual machine monitor,” inProceedings of the USENIX Annual Technical Conference (ATEC). Berkeley, CA, USA: USENIX Association, 2005, pp. 24–24.
[21] J. Matthews, W. Hu, M. Hapuarachchi, T. Deshane, D. Dimatos, G. Hamilton, and M. McCabe, “Quantifying the performance isolation properties of virtualization systems,” in Proceedings of Experimental computer science (ECS). Berkeley, CA, USA: USENIX Association, 2007, pp. 5–5.
[22] B. Lee and D. Brooks, “Accurate and efficient regression modeling for microarchitectural performance and power prediction,” inProceedings of the 12th international conference on Architectural support for pro-gramming languages and operating systems (ASPLOS). New York, NY, USA: ACM, 2006, pp. 185–194.
[23] E. Ould-Ahmed-Vall, J. Woodlee, C. Yount, K. Doshi, and S. Abraham, “Using model trees for computer architecture performance analysis of software applications,” in IEEE International Symposium on Perfor-mance Analysis of Systems and Software (ISPASS), 25-27 April 2007, pp. 116–125.
[24] E. V. Mirgorodskiy and B. P. Miller, “Crosswalk: A tool for performance profiling across the user-kernel boundary,” inInternational Conference on Parallel Computing (ParCo), 2003, pp. 745–752.
[25] P. Nagpurkar, H. Mousa, C. Krintz, and T. Sherwood, “Efficient remote profiling for resource-constrained devices,”ACM Transactions on Archi-tecture and Code Optimization (TACO), vol. 3, no. 1, pp. 35–66, 2006. [26] Rich Uhlig, Gil Neiger, Dion Rodgers, Amy L. Santoni, Fernando C.M. Martins, Andrew V. Anderson, Steven M. Bennett, Alain Ksgi, Felix H. Leung, Larry Smith, ”Intel Virtualization Technology,” Computer, vol. 38, no. 5, pp. 48-56, May, 2005.