A3. Measuring globalisation: an analysis
of transit flows from integrated trade
and transport statistics
Chris de Blois, Gert-Jan Linders1), Harm Jan Boonstra
3.1
Introduction
The Netherlands is a trading nation. It is currently (2008), the second largest export country in the European Union, after Germany (Lemmers, 2009), and plays an important role as a distribution centre in European and global transport networks. Hence, the Netherlands attracts a relatively large share of transport flows to and from the European hinterland. These flows not only include Dutch imports and exports, but also goods flows for which the Netherlands is neither the ultimate origin nor the final destination. About 45 percent of Dutch exports are re-exports, i.e. goods that are transported via the Netherlands and become property of a Dutch citizen without being industrially processed in a significant way. In addition to re-exports, transit2)of goods via Dutch ports plays an important role in transport for the Netherlands as well.
The Dutch position as gateway to Europe has implications for the potential benefits and costs of accommodating the further growth in export, re-export and transit flows that we are likely to observe in the near future (cf. CPB, 1999; Ubbels et al., 2000). International commodity flows are an important source of income, but as shown by Kuipers et al. (2003), the value added generated by transit flows is much lower than the value added generated by re-exports and exports produced in the Netherlands. Per euro of goods transported, the average value-added generated is 1.5 cent for transit, 10 cent for re-exports and 60 cent for domestically produced exports. In addition, the transport flows associated with the international trade in goods through the Netherlands contribute to traffic jams, emission of greenhouse gases and fine dust, road accidents, noise pollution and destruction of the landscape.
But before we can analyse the consequences of ongoing international integration of the world economy for the economic position of the Netherlands, we need to have a clear empirical insight into the various types of goods flows involved in the Dutch economy. Therefore, it is important to be able to quantify trade and transport flows and answer relevant questions like: What types of goods are conveyed in transit? What transport modes are involved? Where do these goods come from and what is their destination? At present, directly observed data on transit flows are largely
unavailable. Moreover, an integrated database on the volume and value of goods flows according to different types (viz., exports and imports, re-exports and transit), by origin and destination and modal split is needed to complement the currently available separate databases that provide a partial and incomplete picture. The aim of this chapter is to give more insight in the size, origin, destination, commodity types and transport modes of the transit flows of the Netherlands. This chapter reports newly derived estimates of transit flows based on matching and then statistically integrating existing trade and transport statistics. So far, the integration has been completed for the reporting year 2004. The results show that transit flows through the Netherlands cannot be neglected in terms of the volume and value of the flows involved. In 2004, transit amounted to about one third of the weight and value of exports. The chapter starts with a discussion of the existing data on merchandise trade and transport and the model used to integrate these data, so as to derive estimates of transit flows. Secondly, we will present the pattern of transit flows emerging from the data integration. The last section briefly concludes the integration results acquired so far and discusses some options for future research.
3.2
Methodology
Historically, data on transit were available at Statistics Netherlands. These were compiled from direct observations and customs procedures. After entering the single European market in 1993, most customs information on intra-European flows was lost. For transit flows, this resulted in a loss of information, and the statistics on transit were eventually terminated. As a result, directly observed or obtained data on transit flows are currently unavailable. At the moment, information on international goods flows for the Netherlands is available in two separate databases at Statistics Netherlands: the international trade statistics and the statistics on transport flows. Both datasets contain a substantial amount of relevant information, but there is no complete and integrated overview of international goods flows. These separate statistics cannot provide insight in the international goods flows, neither in terms of value and weight, nor broken down by type of flow (e.g. trade, re-export, transit), product group, country of origin or destination and country of loading or unloading combined with the transport mode at the border. Given the relevance of this information for analysing trends in globalisation and for policy assessment of investments in infrastructure and of environmental goals, it is essential to have integrated statistics on trade and transport flows.
This study represents the first attempt to integrate the two statistics at Statistics Netherlands that are explicitly intended to monitor international goods flows. It serves to complement the method and results, presented by Kuipers et al. (2003), and has the aim to start a new, consistent data series on trade and transport flows.
The integration of the trade and transport statistics provides a comprehensive view of international commodity flows. Comparing total foreign supply with total imports allows us to determine total incoming transit flows. Comparing total domestic supply with total export makes it possible to determine total outgoing transit flows.
To match both statistics, we expressed them in terms of gross weight. The net weight, quantity, or value of registered transactions in the trade statistics were converted into gross weight. We used the information from the customs authorities including value, quantity, net weight and gross weight for extra-EU trade transactions for this purpose (see Linders et al., 2008). The transport figures were already given in gross weight.
A complicating factor for the integration is the difference between country of origin or destination in the trade statistics and the country of loading or unloading in the transport statistics. The country of origin of a shipment is thefirstcountry where the goods were loaded for transport, whereas the country of loading is thelastcountry where the goods were freighted. For example, for goods shipped in Shanghai and directly transported to Rotterdam the country of origin is the same as the country of loading, i.e. China. However, when there is a transfer in Alexandria, then the country of origin is still China but the country of loading is Egypt. Similarly, the country of destination is thelastcountry where the goods were unloaded, while the country of unloading is thefirstcountry where the goods were defreighted. We addressed this issue in our data integration exercise by using a breakdown by continents. For the quantification of international goods flows by continent of origin or destination, the distribution over continents from the trade statistics was applied. For the subdivision by continent of loading or unloading, we made use of the distribution over continents from the transport statistics. As such, we assumed that the distribution over continents for trade and transit are the same.
For the classification of goods types we used the NSTR classification at level 1 (see Appendix 1). A significant problem for the integration in the transport statistics is the overrepresentation of gross weight in the rest category NSTR 9, representing ‘other goods and manufactures’, and especially in goods group NSTR 99, ‘other goods (among which mixed cargo)’. This problem of overestimation of NSTR 9 weights was solved by extrapolating data from 1982–1992 (Linders et al., 2008). The international transport statistics for these years were still based on detailed customs reports, which did not include the overrepresentation in NSTR 9. Uncertainty margins were defined for the original statistical data at the level of integration. We also assigned uncertainty margins to the value-to-weight ratios and NSTR 9 redistribution factors, used to match trade and transport statistics. The conversions and redistributions applied to the original statistical data led to several
successive recomputations of the uncertainty margins. The finally computed margins were input for a Bayesian integration model. The Bayesian integration model estimates the total incoming and outgoing flows, as well as the trade and transit flows that make up these totals.
In estimating the flows for which direct, separate information is not available, and which implicitly link both statistics – i.e. the transit flows –, we imposed two restrictions. First, transit flows should be non-negative. Second, incoming and outgoing transit flows should be equal for each product group because of the nature of transit flows3). For more details, see Boonstra (2007) and Linders et al. (2008).
3.3
Results: integrated trade and transport statistics
The model results provide policy-relevant insights in the international trade and transit flows of the Netherlands. Graph A3.1 shows that more than 520 million tonnes of goods were transported to the Netherlands in 2004. The estimated value of these goods is 355 billion euro. Out of this total incoming transport almost 400 million tonnes of goods with a total value of almost 260 billion euro were imported into the Netherlands, i.e. were used for domestic consumption, re-export or production. The rest, 127 million tonnes with an estimated value of 98 billion euro, was conveyed in transit. About 455 million tonnes of goods left the Netherlands in 2004. The value of this total outgoing transport was estimated at almost 385 billion euro. Transit amounted to approximately a quarter of the total gross weight and total value of outgoing transport.
The comparison between value and weight reveals an interesting difference between various types of good flows. Import flows are on the whole less value intensive per unit of weight, while export flows consist of relatively high value to weight goods. The average unit value of import is 0.65 euro/kg, for export it is 0.87 euro/kg. This may reveal the nature of specialisation and development patterns across countries. Given that the Netherlands has a highly developed economy, the export sectors tend to produce relatively high value goods, while imports consist of more basic products. A compelling result is, however, that transit flows through the Netherlands consist of relatively high value to weight goods as well: the average ratio of value to weight is 0.78 euro/kg for transit.
The uncertainty margins given in graph A3.1 are 90 percent confidence intervals. The uncertainty for the estimated gross weights is about plus or minus 20 million tonnes for transport and transit and 15 million tonnes for trade. The relative margins are almost 5 percent for total transport and trade and 17 percent for transit. The integrated database also provides insights into transit flows at a more detailed sector level. As graph A3.2a shows, the gross weight of transit mainly consists of raw
materials like petroleum (32 percent), ores and metal residues (16 percent), coal (15 percent) and crude minerals and building materials (13 percent). The value of transit (see graph A3.2b) is dominated by the category ‘other goods and
A3.1 Gross weight and value of the international goods flows, with 90 percent confidence intervals, 2004
Gross weight (million tonnes) Value (billion euro) 600
Incoming transport Import Transit Outgoing transport Export 500 400 300 200 100 0
A3.2a Transit flows by product group; gross weight, 2004
Fertilizers Agricultural products; live animals Food products and feed Chemical products Metals, metal semimanufactures Other goods and manufactures Crude minerals; building materials Solid mineral fuels Ores and metal residues Petroleum and petrochemical products
0 5 10 15 20 25 30 35
manufactures’, which contributes almost 70 percent. The main products in this category are: machines and electrical appliances, transport equipment, garments and footwear, paper and cardboard, glassware and pottery and metal manufactures.
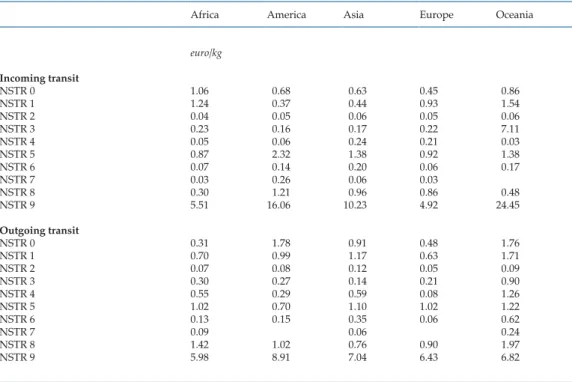
Table A3.1 shows the value-to-weight ratios for incoming and outgoing transit by product group and continent. Product group NSTR 9 clearly contains the most valuable goods. Especially, the NSTR 9 goods from the distant continents Oceania, Asia and America have a high value per kilo. Also for most of the other product groups the ratios are lower for Europe than for the other continents. Probably, this is because less valuable raw materials with smaller profit margins are transported from closer distances than more valuable goods. Another eye-catching aspect is that the differences among continents are larger for incoming transit of NSTR 9 goods than for outgoing transit of NSTR 9.
The pattern of NSTR 9 value-to-weight ratios clearly demonstrates the role of the Netherlands as a gateway to Europe. Besides the important transit flows from Europe to Europe, transit mainly flows from distant countries to Europe and vice versa, not from distant countries via the Netherlands to other distant countries. So, the relatively high value products from the distant continents are transported to the European hinterland of the Netherlands and mix with relatively low value products from other European countries.
A3.2b Transit flows by product group; value, 2004
Fertilizers Agricultural products; live animals
Food products and feed Chemical products
Metals, metal semimanufactures Other goods and manufactures Crude minerals; building materials Solid mineral fuels
Ores and metal residues
Petroleum and petrochemical products
0 10 20 30 40 50 60 70
In the integrated database, transit can also be broken down by transport mode, continent of (un)loading and product group. About 60 percent of the gross weight of transit is last loaded in a European country, whereas 20 percent is from America (see table A3.2a). Over 70 percent of the incoming transit is transported over sea. The rest is mainly shipped to the Netherlands by inland vessel or truck: each with more than a 10 percent share in incoming transit. Table A3.2a shows that most of the incoming transit of petroleum and petrochemical products (NSTR 3) arrives by sea-going vessel from Europe and Africa or by pipeline from Europe. About 65 percent of the incoming transit of ores and metal residues (NSTR 4) is transported over sea from America.
Table A3.2b shows the distribution of outgoing transit over transport modes, continents and product groups. Almost all transit, over 90 percent, is unloaded in Europe. Several transport modes were used: inland shipping (35 percent), maritime transport (21 percent), pipelines (21 percent) and road transport (17 percent). Outgoing transit of petroleum and petrochemical products is mainly by pipeline (70 percent). The outgoing transit of solid mineral fuels (NSTR 2) mainly uses inland vessels (52 percent), trucks (24 percent) or sea-going vessels (14 percent).
Table A3.1
Value-to-weight ratios for incoming and outgoing transit by product group and continent of origin or destination, 2004
Africa America Asia Europe Oceania
euro/kg Incoming transit NSTR 0 1.06 0.68 0.63 0.45 0.86 NSTR 1 1.24 0.37 0.44 0.93 1.54 NSTR 2 0.04 0.05 0.06 0.05 0.06 NSTR 3 0.23 0.16 0.17 0.22 7.11 NSTR 4 0.05 0.06 0.24 0.21 0.03 NSTR 5 0.87 2.32 1.38 0.92 1.38 NSTR 6 0.07 0.14 0.20 0.06 0.17 NSTR 7 0.03 0.26 0.06 0.03 NSTR 8 0.30 1.21 0.96 0.86 0.48 NSTR 9 5.51 16.06 10.23 4.92 24.45 Outgoing transit NSTR 0 0.31 1.78 0.91 0.48 1.76 NSTR 1 0.70 0.99 1.17 0.63 1.71 NSTR 2 0.07 0.08 0.12 0.05 0.09 NSTR 3 0.30 0.27 0.14 0.21 0.90 NSTR 4 0.55 0.29 0.59 0.08 1.26 NSTR 5 1.02 0.70 1.10 1.02 1.22 NSTR 6 0.13 0.15 0.35 0.06 0.62 NSTR 7 0.09 0.06 0.24 NSTR 8 1.42 1.02 0.76 0.90 1.97 NSTR 9 5.98 8.91 7.04 6.43 6.82
3.4
Conclusion
This chapter presented research at Statistics Netherlands that aims to contribute to improving the knowledge of the aggregate international merchandise movements through the country. We developed a statistical model that uses
Table A3.2a
Gross weight of incoming transit by transport mode, continent of loading and product group, 2004
Maritime transport Inland Road Rail Pipeline
shipping transport transport transport
Africa America Asia Oceania Europe Europe Europe Europe Europe
1,000 tonnes NSTR 0 61 302 94 2 255 492 44 NSTR 1 39 588 206 8 113 162 552 5 203 NSTR 2 4,360 5,561 2,730 2,495 5,319 574 708 4 NSTR 3 8,401 707 1,567 22,923 1,939 228 13 4,878 NSTR 4 2,040 18,168 522 1,377 2,223 2,504 1,339 49 NSTR 5 250 534 799 23 2,878 1,060 1,765 272 NSTR 6 185 353 522 36 3,395 7,039 7,259 1,515 NSTR 7 NSTR 8 223 1,016 697 12 3,864 1,463 3,298 90 176 NSTR 9 18 194 455 8 783 125 1,410 6 Table A3.2b
Gross weight of outgoing transit by transport mode, continent of loading and product group, 2004
Maritime transport Inland Road Rail Pipeline
shipping transport transport transport
Africa America Asia Oceania Europe Europe Europe Europe Europe
1,000 tonnes NSTR 0 16 1,281 NSTR 1 23 56 89 8 419 348 743 30 160 NSTR 2 45 227 426 26 2,352 11,379 5,194 2,101 NSTR 3 673 1,396 728 39 2,303 6,095 455 490 28,477 NSTR 4 196 1,377 2,452 126 5,651 14,750 537 3,134 NSTR 5 25 141 51 2 1,217 1,192 3,601 1,349 NSTR 6 59 248 255 11 1,926 10,971 6,677 154 NSTR 7 NSTR 8 125 726 1,050 34 2,747 2,309 2,926 714 189 NSTR 9 31 195 378 20 730 121 1,429 38
existing information from trade and transport statistics that was made comparable by converting weights and compiling value-to-weight ratios, to derive consistent estimates for the value and volume of trade and transit flows by product group.
The integrated estimates are derived for 10 different product groups. They also include estimated uncertainty margins. The results can be summarised in the following four stylised facts:
1. Transit flow estimates amount to about 127 million tonnes, or 98 billion euro for 2004. This is 28 and 25 percent, respectively, of total outgoing transport.4) 2. About 60 percent of the gross weight of transit is last loaded in a European
country, whereas 20 percent is from America. Over 70 percent of the incoming transit is transported over sea. Almost all transit, over 90 percent, is unloaded in Europe.
3. Perhaps surprisingly, transit flows do not appear to consist mainly of low-value products. The value-to-weight ratio for transit flows, albeit lower than for Dutch exports, on average exceeds that for imported goods.
4. When considering the sector composition of transit flows, most transit in terms of volume occurs in petroleum and petrochemical products. In value terms, though, the sector ‘other goods and manufactures’, including a variety of products from transport equipment, computers and machinery to clothes, is by far the most important.
The model developed to integrate trade and transport statistics yields both new variables, in particular for transit flows, and consistent estimates for trade and transport in terms of value and volume. These data may prove to be valuable for future research to assess the benefits and costs to the Dutch economy of developments in merchandise trade and transit flows. Though this is a step forward in our knowledge of the international goods transactions related to the Netherlands, we intend to invest in further development of the model and the database. In particular, a further division of imports and exports into pure trade, re-exports and quasi-transit flows will allow us to derive relevant information on differences between pure trade flows and flows with a ‘transit’ character. This will allow us to refine the model assumptions and improve the integrated estimates. Also, a more detailed level of product aggregation may be possible, especially for the sector ‘other goods and manufactures’. This is limited by the classification of transport statistics. Modelling value-to-weight ratios within the model requires further attention, as does the matching of mode of transport characteristics and loading/unloading characteristics of flows from both statistics. So far, we have to make rather restrictive assumptions for more extended model versions, related to limited data availability and definition differences. We plan to test the model outcomes for sensitivity to these assumptions and to relax them where possible.
References
CPB (1999). Globalization, International Transport and the Global Environment: four quantitative scenarios. CPB Working Paper, no. 110. Netherlands Bureau for Economic Policy Analysis, The Hague.
Boonstra, H.J. (2007). Macro-integratie: het opleggen van ongelijkheidsrestricties. Research paper DMH-2007-01-03-HBTA. Statistics Netherlands, Heerlen/Den Haag.
Kuipers, B., W.J.J. Manshanden, A.C. Muskens, G. Renes, M.J.P.M. Thissen, and J.E. Ligthart, (2003). De maatschappelijke betekenis van de doorvoer: Een onderzoek naar de zuivere doorvoer van goederen door de Nederlandse zeehavens. Rapport 2003-36. TNO Inro, Delft.
Lemmers, F.A.M.O. (16 April 2009). ‘Netherlands second largest export country in Europe’.Web Magazine.Statistics Netherlands, Heerlen/Den Haag.
Linders, G.J.M., C.J. De Blois, H.J. Boonstra, H.L.F. de Groot en J. Exel (2008). Integration of international trade and transport flow statistics for the Netherlands. Statistics Netherlands, Heerlen/Den Haag.
Manshanden, W.J.J. and B. Kuipers (2003). ‘Staat zonder transport ook het buitenland stil?’.Economisch Statistische Berichten, 89 (4445), D25–D27.
Pols, A. A. J. (1997). ‘Internationale concurrentiekracht en mainportstrategie’ in: Gelok, M.F. and W. M. de Jong (eds) (1997).Volatilisering in de economie.
Roos, J. (2006). Internationale handelsstromen en de statistiek. Statistics Netherlands, Heerlen/Den Haag.
Ubbels, B., C. Rodenburg and P. Nijkamp (2000).A Multi-layer Scenario Analysis for Sustainable International Transport.Discussion Paper number 00-102/3. Tinbergen Institute, Amsterdam/Rotterdam.
Notes in the text
1) Department of Spatial Economics, VU University Amsterdam
2) In this chapter ‘transit’ is defined as the sum of transport transit and warehouse transit. Transport transit is the transport of goods which are transported through the Netherlands and which are not stored, do not change owner, and are not cleared through customs (Roos, 2006). Distinction is made between transport transit with transhipment and transport transit without transhipment. The smallest of both, transport transit without transhipment, is not considered due to
lack of data. Warehouse transit involves goods entering or leaving warehouses that are monitored by customs for possible charge of customs duties. Warehouse transit implies that goods are stored in these warehouses, possibly subjected to value added logistics (VAL), and are subsequently redistributed to a destination outside the Netherlands without customs clearance, as customs goods (Roos, 2006). In this research, we do not separately identify warehouse transit. Quasi-transit, i.e. transit of goods that enter or leave the European Union and are cleared for or from the common EU market via the Netherlands, is not considered as part of transit but as part of trade.
3) With this, we assumed that possible losses of cargo because of theft, accidents or wrongly stored or handled products are negligible small. Furthermore, we assumed that the waiting time in customs warehouses does not lead to significant differences between the annual incoming and outgoing transit.
4) Total outgoing transport is composed of outgoing transit and export. Export is defined including re-exports and quasi-transit flows. The latter are transit flows that are reported by Dutch customs for administrative reasons. These flows are typically (for a large part) imports of EU countries that are processed in Dutch ports. As such, there can be storage in the Netherlands and/or clearance through customs for the single European market. They have been included in trade, since they are part of trade statistics and as such not derived as part of transit flows.
Appendix 1
NSTR classification at the 1-digit level, with subdivision of NSTR chapter 9
No. Sector
0 Agricultural products; live animals
1 Food products and feed
2 Solid mineral fuels
3 Petroleum and petrochemical products
4 Ores and metal residues
5 Metals, metal semimanufactures
6 Crude minerals; building materials
7 Fertilizers
8 Chemical products
9 Other goods and manufactures
of which:
91 Transport equipment
92 Agricultural tractors and machinery
93 Appliances, engines, other machinery
94 Metal manifactures
95 Glass(ware), ceramics
96 Leather, footwear; textile, clothes
97 Other (semi)manufactures