Development and Implementation of a Virtual
Laboratory for Fundamentals on Power Systems
Jules Simplice Djeumen1, Dan-Valentin Nicolae2 , Jo Le Roux1, Theresa Joubert1
Department of Power Engineering Vaal University of Technology Vanderbijlpark, South Africa1
Department of Electrical engineering Tshwane University of Technology Pretoria West, South Africa2 [email protected], [email protected], [email protected], [email protected] Abstract- In almost any engineering department, a laboratory is
an integral part of the educational process. The laboratory is a key component in the field of engineering in general, and electrical power engineering in particular. The virtual laboratory (VL) is a simulated experiment run by students on a computer station program; it can transform the conventional laboratory experiments into an interactive virtual environment, allowing simple and complex phenomena to be investigated by students just by changing the parameters and conditions of the experiments. This paper describes the development and the implementation of a VL, named VLABPOWER, for fundamentals on power systems. Mainly, electrical power engineering students will using to increase their understanding and to bridge the gap that exists between the theoretical part in the class and the practical at the traditional (real) laboratory and to better prepare before going to the traditional laboratory. The purpose of this work is to develop and implement a VL in order to enable students to have a better understanding of the experiments done in the traditional laboratory and to familiarize themselves with the different components used for those experiments. It presents a virtual interactive experiment environment that simulates the physical conditions on the transmission line. Moreover, it discusses and explains different types of short circuit faults such as symmetrical and unsymmetrical faults, modeling of different type of lines, and load condition analysis.
I. INTRODUCTION
The process of education in electrical engineering means the learning of theory and practice, self-teaching, team projects, experimental work involving equipment, simulation software package and laboratory application [1]. In almost any engineering department, laboratory experiments constitute an essential part of the educational process. Experiments done in the laboratory help students to better understand the theoretical part of the subject. In fact, the traditional laboratory in power system is mandatory, and requires a substantial amount of material and human resources, inter alia instrumentation, hardware and practical knowledge, which are not always available and affordable. This is a problem that is encountered in all engineering fields. Consequently, this has a negative impact on the practical training of undergraduate and graduate students who often perform experiments in large groups [2]. The power engineering department at any tertiary institution in South Africa, like many other engineering departments in various institutions, faces a real challenge when it comes to running practical experiments for all registered students. This
challenge exists because engineering is under considerable pressure to include additional material and to restructure existing content using new approaches and technologies. Therefore, there is an urgent need for an alternative solution to complement the traditional laboratory. In an attempt to find that solution, various studies have focused on the fault analysis of power systems with MATLAB Graphical User Interface (GUI) [3]; the development of a toolbox for electrical power system with GUI [4], the teaching of brushless direct current (DC) motor control with MATLAB graphical user interface in [5] and the development of a platform virtual laboratory for the renewable energy source by [6]. Most of these studies indicate that the virtual laboratory could be an effective instructional tool to reinforce theory with practice and to enhance the educational skills of students.
A VL enables the user to simulate a conventional experiment on a computer. It is preferable for a learner to begin by working with a VL before practicing in the actual laboratory, because it is safer, interactive and less time consuming; and it allows students to investigate simple and complex phenomena, just by changing the parameters and conditions of the experiments.
A VL can summarize all basic knowledge and practical experience in an interactive environment with animation. This efficiently allows students to have a very good knowledge of the fundamental power system in general and the transmission line in particular. Ref. [7] reported that one of the better methods of teaching the fundamental concepts of power system is via practical experiments. Ref. [8] argues that the teaching of fundamentals of power systems can be improved using a simulation laboratory. As for [9], the VL can be used as a pre-lab experience to give students an idea of what they will encounter in an actual laboratory. This can improve laboratory safety by enabling students to familiarize with the equipment before they actually use it [10].
VLs are useful for experimental studies of systems that are too large, too expensive, or too dangerous for physical measurement by undergraduate students [11]. In electrical engineering traditional laboratories, when medium and high voltages are involved, students are not allowed to perform experiments without supervision. When high voltage is involved in practical, for example, when dealing with medium and long transmission lines (6,6 kV–400 kV), this range of voltage can be very dangerous for students because of the lack of safety procedure and insufficient knowledge to
manipulate complex and sophisticated instruments. This study enables students to work with the final product, the virtual laboratory, by simulating dangerous situations involving high voltage, while remaining in a safe environment. The aim is to create a virtual electrical power systems laboratory, (an interactive environment where students can learn both electrical power systems with the use of MATLAB Graphical User Interface (GUI) as a tool) and to design an interactive environment platform using graphical user interface (GUI) of matrix laboratory (MATLAB) , which will be used to evaluate the student, as in a traditional laboratory, make quizzes and notes and create tutorials and a forum.
The remainder of the paper is organized as follows: Section 2 present previous research on the VL and the background on the VL. The structure of the VLABPOWER is explained in Section 3. Section 4 provides the theory knowledge on the fault calculation. The virtual experiments are presented in the form of flow chart in Section 5. The laboratory environment experiments and results are presented in detail in Section 6 and the last section provides the conclusion.
II. PREVIOUS RESEARCH AND BACKGROUND ON
VIRTUAL LABORATORY
Previously, the researhers presented many purpose on VL for renewable energy [6-7], thermodynamics [11], electric machine [30] and classic power system [3].
On a typical power system transmission line, many types of faults can occur. This work will focus on the balanced and unbalanced three phase’s faults depending on the parameter of the components included in the systems and voltage drop analysis on short and medium transmission line. Many researchers have completed the fault calculation on the power systems transmission lines by using different techniques such as decomposition in symmetrical components [2], Monte-Carlo method [4], Wavelet Transform [5-7], or dynamic phasor modeling [8]. In the most of the analysed cases, the status of electrical machines which form part of the power systems, such as transformers, motors and generators is not revealed. The MATLAB/M-file has been used to solve balanced and unbalanced three-phase faults using symmetrical components [9], [10] and [2]. Not many researchers used the Graphical User Interface to display the fault currents and voltages. However, this research will only use the symmetrical components method. The proposed method performs stable and accurate the transformation of an unbalanced system to a superposition of balanced systems. The proposed method has major advantages and it can be easily implemented in MATLAB’s GUI. Furthermore the method has been experimentally verified via case studies. A. Virtual laboratory as a pre-laboratory
A VL is a simulation of a traditional laboratory, created for the purpose of providing instruction to students in the use of laboratory facilities and report preparation. VL is quiet different from remote laboratory [26]-[27] which it won't be discuss here in detail. Reference [20] states that, "Virtual laboratories are computer-simulated laboratories that operate,
look, and produce results similar to traditional laboratories." The concepts of reducing time and costs, while improving student satisfaction and learning, are key to efforts to improve engineering education, which is the pre-occupation of many researchers these days. We choose to examine the importance of virtual laboratories as pre-laboratories for the fundamentals of power systems for several reasons, as previously explained.
In [21] is stated that in future, virtual laboratories will heavily facilitate a power system as part of electrical engineering studies. In other words, students will prepare for practical laboratory sessions using virtual experiments and assessments. VLABPOWER offers a range of pre-designed common virtual experiments and assessments on transmission line short circuits. This interactive virtual laboratory will be used as a pre-laboratory activity to help students understand the theoretical fundamentals, and build their self-confidence to perform laboratory activities in the traditional laboratory. B. Virtual laboratory in power system field
With the advent of the simulation software and the modern computer technology, virtual laboratories are used as a supplement or alternative to traditional laboratories. Traditional laboratories are physical laboratories occupying real estate, having physical equipment, and requiring technical expertise to function effectively. VLs are less time-consuming than traditional laboratories. VLs can be repeated as often as necessary, making the fundamentals more comprehensible. They offer students the opportunity to visualize the engineering fundamentals and concepts they learn in the classroom.
Virtual laboratories have been developed and implemented in a number of electrical engineering experiments; reference [5] presents the design of a MATLAB graphical user interface (GUI) for studying brushless DC motor control. According to [5], using of the visual tools seems to be a positive solution to make the concept of learning motor command more understandable, simpler and lasting for students.
Ref. [3] and [4] presented the MATLAB-based fault analysis of power systems with GUI. They confirmed that currently the program, as toolbox, is used as a supplement to electrical power courses in their respective departments.
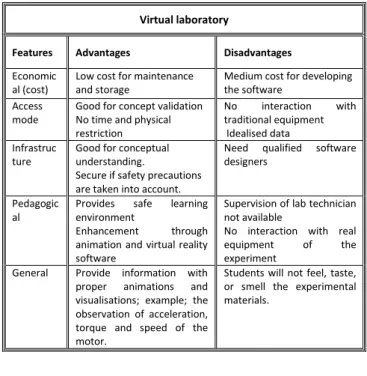
C. Advantages and disadvantages of the VL
The VL is characterized by its flexibility and versatility because it is software based. There are numerous advantages of using the virtual laboratory program for power systems, with safety and convenience at the top of the list. The danger of electrocution always exists in traditional laboratories; laboratory technicians and students are required to wear gloves, coats, and safety glasses or helmets with face guards in order to reduce the dangers in the laboratory. Physical phenomena that are either difficult to perceive or to measure in usual experiments can be presented in a VL in many different ways. In addition, dangerous, high cost, complicated experiments can be realized in a VL GUI. Like any laboratory, VLs have a number of advantages and
disadvantages. According to According to [22] and [23], the advantages of a virtual laboratory can outweigh its disadvantages, thus making it a feasible option. Table 1 provides a summary of the main advantages and disadvantages of the VL.
TABLE I
THE MAIN ADVANTAGES AND DISADVANTAGES OF VLs
Virtual laboratory
Features Advantages Disadvantages Economic
al (cost)
Low cost for maintenance and storage
Medium cost for developing the software
Access mode
Good for concept validation No time and physical restriction No interaction with traditional equipment Idealised data Infrastruc ture
Good for conceptual understanding.
Secure if safety precautions are taken into account.
Need qualified software designers
Pedagogic al
Provides safe learning environment
Enhancement through animation and virtual reality software
Supervision of lab technician not available
No interaction with real equipment of the experiment
General Provide information with
proper animations and visualisations; example; the observation of acceleration, torque and speed of the motor.
Students will not feel, taste, or smell the experimental materials.
III. STRUCTURE OF THE VIRTUAL LABORATORY
(VLABPOWER)
Fig. 1 depicts the basic structure of the VLABPOWER. This system allows several users to conduct virtual experiments at the same time. Fig. 2 depicts the general structure of the virtual laboratory.
Fig. 1. Virtual laboratory structure concept
The VL was developed as close as possible to the traditional laboratory, where students easily learn more about the fundamentals of power systems (transmission lines), be evaluated (tutorials), be tested (quizzes), and meet fellow students in a forum for further discussion.
VL systems use general server/client method as a basis for their system architecture. Similar method (server/client) has been used by [28]. Fig. 2 shows the structure chart of the system module and sub-modules. The system is divided into two sub modules i.e. the students and the expert module. The student module is further divided into sub modules as fellows:
•Help info: This help info aims to provide an overview of the system and practical guide for experiments.
•Experiment: This function contains a list of experiments that can be performed virtually; new experiments can be gradually added as a sub module to this function.
•Note and quizzes: This function provides notes relating to the experiment. Each topic is accompanied with quizzes to test the student’s understanding.
•Tutorial: The tutorial aims to enhance the student’s understanding by posing some problems related to the subject.
•Forum: The forum provides a platform for further
discussion with peers and experts.
Fig. 2. Structure chart of the system module
The experts module has three sub modules i.e. student registration, tutorial manager and content manager. The different features of sub modules are:
• Student identification: This function manages
student identification and authentication. Only authorized students are allowed to use this system. • Tutorial manager: This function manages the update
and deletion of tutorial contents.
• Content manager: This manager ensures that the
most updated content in notes, guidance and experiments are presented to students.
IV. THEORY KNOWLEDGE ON THE FAULTS CALCULATION
The main parameters on the fault calculations are the positive sequence impedance, negative sequence impedance, zero sequence impedance (Z1, Z2 and Z0) respectively and includes
the phase voltage Ea. These parameters are the thevenin
equivalent impedances of the line and can be used to calculate the symmetrical and unsymmetrical faults.
The symmetrical components have been explained in detail in [24]-[29], hence only the summary of the formulae is presented. Tutorial Manager Tutorials Virtual Laboratory Notes & Quizzes Help Info Forum Experiments Content Manager Student Students Expert Graphical user interface VLABPOWER MATLAB/GUI JAVA Apple Database VLABPOWER Serve
Three-phase fault (3LS)
/ (1)
0 (2)
Where Ea and Z1 are phase voltage and positive sequence
impedance.
Single-phase to ground fault (1LG)
/
(3)
(4)
Where Z0 and Z2 are zero and negative sequence impedance.
phase-phase fault (2LS)
/
(5)(6)
0
(7) Two-phase to ground fault (2LG)
/ / (8)
/
(9)/
(10)The symmetrical components of phase-a can be calculated by using (11). Other phase voltages have been determined via the voltage of phase-a. The positive admittance must be calculated from (12) for the time variations of signals this can be verifiied from [17] . 0 0 0 0 0 0 0 0 (11) " " (12) Where: Xd”, Xd’ and Xd are direct-axis sub transient, transient
and synchronous reactance, Td” and Td’ are direct-axis sub
transient time constants; Ea and E are complex and RMS
value of phase-a voltage of the synchronous machine terminal before the fault occurred.
Tables 2 & 3 may be used to calculate and to illustrate the fault current and voltage as depicted in fig. 11. The signals must be illustrated by taking the real parts of current equations into consideration [17]. After finding the symmetrical components of a phase current, the value of current and voltage can be calculated.
TABLE 2
SYMMETRICAL COMPONENTS CIRCUIT CONSTANTS
Fault type Circuit constant R L 3LS Ra L1 2LS 2*Ra L1+L2 1LS 2*Ra+R0 L1+L2+L0 2LG / / Note: , , , √2| |
Where Ta is armature time constant, L(0) is initial inductance
at t=0, Ra and R0 are armature resistance and
zero-phase-sequence resistances, L1, L2 and L0 are positive, negative and
zero-phase-sequence inductances, respectively.
The fault currents signals formulae are introduced in Table 3.
TABLE 3
SYMMETRICAL-COMPONENTS FAULT CURRENTS
V. TASKS IN THE DESIGN OF THE VIRTUAL EXPERIMENT GRAPHICAL PRESENTATION (FLOW CHART) VLABPOWER provides human-computer interaction, which is importance when working with the system model. Students interact with VLABPOWER easily, intuitively, without need for derivation, composition, design development and debugging the simulation model; they do not need to be an advanced user of MATLAB and, they receive the required information in a transparent, well-arranged format. This simulation program presents a functional virtual model, where students set the system parameters, and choose the mode of operation and the required outputs to observe results. The design of VLABPOWER has considered the eight essential steps, from the choice of the calculation modes and algorithms through to the determination of the inputs and outputs, up until the final refining and verification by [25]. This is summarised in Fig. 3.
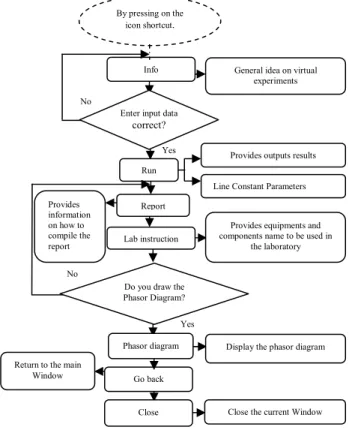
The recommended procedure for a new user is illustrated below in Fig. 4 (the flow chart of the virtual laboratory) in the order of priority, where there are two ways to access the virtual laboratory, either from the simulation session (SI) laboratory, or via the institution’s website, and the remaining steps represent a push button. It is advisable for users, after launching the program, to first press on the help infos, in order to have an overview of the information regarding the operation. Users can then use the notes and quizzes to gain the basic knowledge on the available virtual experiments with more confidence. The forum is available next, in case the user has come across a challenge for further discussion with peers and the exit button can help to logoff the VL.
Fault type Fault currents Ia1 Ia2 Ia0 3LS √2| | 0 0 0 2LS -Ia1 0 1LS Ia1 Ia1 2LG ‐ L0/ L0 L2 *Ia1 ‐L2/L0 L2
Fig. 3. Eight essenial steps followed VLABPOWER
Fig. 4. VLABPOWER flow chart
VI. VL INTERFACE OF VLABPOWER
GRAPHICAL USER INTERFACE DEVELOPMENT ENVIRONMENT
(GUIDE) IN MATLAB PROVIDES A MULTITUDE OF TOOLS FOR LAYING OUT GRAPHICAL USER INTERFACES (GUIS).
A Main windows of the virtual laboratory
The main Window of the VLABPOWER is represented in Fig. 5, which appears after the student have logged in and double clicked on the shortcut icon on a working station desktop, where the main functionalities of the VL are represented with the push buttons. More details about each of these push buttons follow in the next paragraph. On a
simple click on any of these push buttons, another Window will probably open for the next step in the procedure.
Fig. 5. Main window of VLABPOWER program B The meaning of the ‘experiments’ push button
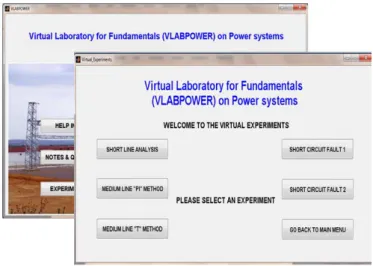
After students have familiarised themselves with the operation of the VL, the next action will be to access the virtual experiments by a simple click; a new Window will pop up with the list of the available virtual experiments, where one of them can be selected by clicking on it.
Fig. 6 illustrates the opening of the ‘Experiments’ Window, with a set of three experiments on the voltage drop analysis and two experiments on the fault experiments. The ‘Go back to main menu’ button will enable students to return to the main Window of VLABPOWER. The first three experiments allow students to study the performance of a single-phase short transmission line, and to analyse the single-phase medium length transmission line by using the T-method and the PI-method.
Fig. 6. Virtual experiments windows
There are different concepts to learned between the two experiments on the short circuit fault, whereby the first Calculation mode and Algorithm Determinati on of inputs parameters Determinatio n of outputs parameters Design of the interface and Interconnect sub-program Converting the mathematical model into Matlab codes Programming of the VLABPOWER Debugging and verification of the results Final refining using different tools VLABPOWER Tutorials Forum/Exit END Balanced faults Unbalanced faults Voltage drop Analysis
Medium line "PI" method
Medium line "T" method Short line analysis
Fault experiments Start Student identification Institution website Experiments Help info
Note & Quizzes Simulation laboratory
experiment does not reveal the status of others components (transformers, generator, motor) involved in the power system, while the second experiment does.
VII. VIRTUAL EXPERIMENTS WITH VLABPOWER
A. Short Transmission Line Analysis
The performance of a single-phase short transmission line is one of the practicals for the fourth semester students from the department of power engineering where there are very important concepts and principles to be grasped by learners. This virtual experiment on a short transmission line, with the main objective to investigate the factors that affect power flow, and particular reference to the load power factor, is graphically represented in Fig. 7, which is the main Window of the experiment. Users or students use four data as inputs, the voltage of the generator of the line (Vs), the resistivity of
the line (Rline), the inductance of the line (Lline), and the
frequency (F).
After entering the desired values in the appropriate edit boxes and choosing the correct type of load between the three radio buttons under ‘type of load’ button group available, the program is ready to be executed. By pressing on the ‘Run’ push button, the student can observe the output parameters and the line constant parameters (A, B, C and D) in the edit text boxes. The type of loads have been chosen according to the real ones available in the traditional laboratory with the only difference that students can have a combination of loads like resistive-inductive load (RL), resistive-capacitive load (RC) or inductive-capacitive load (LC), which are not common in reality. When pressing the ‘Phasor Diagram’ push button, students can display the equivalent phasor diagram of the entered input data. Similarly, when clicking on the ‘Report Instruction’ push button, another Window will pop-up with the information on how to compile the technical report. One of the most important push buttons is ‘Lab Instruction’, which gives the student a list of all components to be used in the traditional (real) laboratory during the real physical experiment of this specific experiment. The ‘Infos’ push button gives an overview of the virtual experiment, while the ‘Go Back’ push button returns to the main experiment Window. Finally, the ‘Close’ push button completely closes the window of the virtual experiment. The interface offers functionalities such as save, print, insert, zoom in and out, open an existing file, and the help button, which gives some instructions and some basic theoretical information.
Fig. 7 illustrates the type of loads, which are purely resistive, and from the phasor diagram the learners can observe that the voltage should be in phase with the current. A slight change will be observed during the practical session, where the current lags the voltage with a small angle value. This difference is due to a small amount of inductance within the circuit itself (transmission line, circuit connections etcetera) and the construction material of the resistive load (this is explained during the tutorial sessions).
Fig. 7. Purely resistive load analysis experiment
The flowchart below gives more information on the operation of the virtual experiment and the functionality of any of the push buttons after students have been identified and log in to the VLABPOWER. Fig. 8 gives advice on the approach to a new user using the virtual experiment.
Fig. 8. Functionality of the push buttons
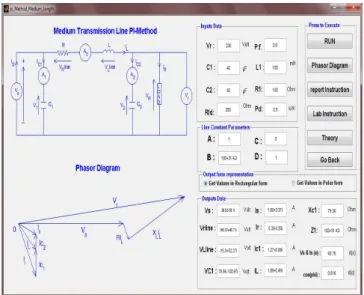
B. Medium transmission line analysis based on "T" and
"Π” methods
In this specific experiment, users are required to enter some inputs parameters such as the resistivity and inductivity of the line, the shunt capacitor value, the developed power, the power factor of the load and the frequency of the line as well.
By pressing on the icon shortcut. No No Yes Yes
Provides equipments and components name to be used in
the laboratory Lab instruction
Info
Go back
Close
General idea on virtual experiments
Return to the main Window
Close the current Window Phasor diagram
Report
Provides outputs results
Line Constant Parameters Provides information on how to compile the report Run
Do you draw the Phasor Diagram?
Display the phasor diagram Enter input data
All these mentioned inputs are given in the practical guidelines which are the same values used during the report writing. By pressing on the "RUN" push button, the program will display the different outputs values and the line constant parameters.
Firstly, students enter the input data in the appropriate edit text boxes and after they proceed with the execution of the experiment. Here, students have a choice between displaying the outputs in the rectangular form (complex form) or in the polar form which are standard expressions in the field of electrical engineering. To observe the phasor diagram regarding the specific inputs data, a click is enough on the push button called "Phasor Diagram". The remaining push buttons have the same functionalities as in the previous experiment on the single-phase short transmission line, which are the <Lab instruction>, the <report instruction> and the <Go back>. The push button named “Theory” enables students to refresh their understanding of basic principles, concepts and information on the related topic. Fig. 9 shows the virtual experiment on the medium transmission line T-method.
Fig. 9. Medium line transmission line "T" method virtual experiment
Similar to the "T" method with the only difference that the shunt capacitor has been divided into two equal capacitors and the inductor and resistivity of the line have been combined to make one complete impedance (Z). The operation procedure of the virtual experiment remains the same and the functionalities of the push button are also working as described in the previous sub-session.
Fig. 10 shows virtual experiment on the medium line Π -method, where students can observed the outputs, the phasor diagram and the possibility to obtain the outputs results on different forms (rectangular and polar) as mentioned previously, and the remaining push buttons function similarly.
Fig. 10. Medium line transmission line " Π" method virtual experiment
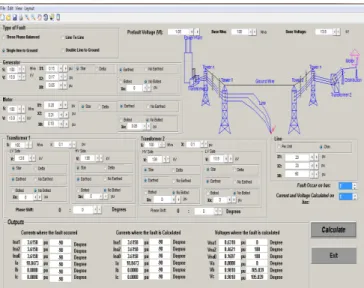
One the focus of this VL was on the short circuit faults on the transmission line, where these different types of faults were interactively represented with animation, principally 1LS, 2LG, 2LS and 3LG which are single line to ground, double line to ground, line-to-line fault and three line to ground fault. Fig. 11 represents the entire results 2LG fault, with the two lines falling to ground as in real life. Here, students can observe the sequence network diagram, the general representation, the signal representation of fault current and voltage as outputs and the outputs are expressed either in real values or per unit (PU) values.
Fig. 11: 2LG Virtual experiment fault calculations window
Fig. 12 shows the interface of the three-phase balanced faults calculation on the transmission line experiment. This experiment was prepared and demonstrated to students to illustrate the effect on the fault currents and voltages (at the different states of the components in the power systems), as well as the faults at the different bus levels.
Fig. 12: 3LG Virtual experiment fault calculations.
VIII. CONCLUSION AND RECOMMENDATIONS FOR FURTHER
WORKS
The description of the VL interactive environment, on the fault calculation of the fundamental of power system has been described and experiments presented have been tested with the input values according to various examples in the textbooks and the obtained results matched the results of the examples. The VL offers more individualized and independent learning and provides the simulation of a complex scenario that is less likely to be demonstrated in a traditional laboratory. Without taking risks, students can manipulate internal connection of the components (generator, transformers and motor) and visualize the results. This interface can therefor be used as an educational tool for power systems.
Further research might explore whether VLs could be used for different subjects such as electrical machinery, electrical protection and electrical engineering. Also, it would be interesting to establish whether VLs could be configurated on cell phones and tablets.
REFERENCES
[1] M. Travassos valdez, c. Machado ferreira, and f. P. M. Barbosa, "electrical engineering teaching and distance learning using a desktop virtual reality system," in power engineering conference (upec), 2013 48th international universities', 2013, pp. 1-4.
[2] D. Karadimas and K. Efstathiou, "Design, Implementation and Evaluation of a Remote Laboratory System for Electrical Engineering Courses," in
Proceedings of the Sixth International Conference on Advanced Learning Technologies (ICALT'06), 2006.
[3] K. Hatipoglu, A. Jamahbozorg, and G. Radman, "MATLAB-based fault analysis of Power Systems with Graphical User Interface as an educational tool," in Southeastcon, Proceedings of IEEE, 2011, pp. 354-358.
[4] M. G. Rabbani, A. B. M. Nasiruzzaman, R. I. Sheikh, and S. Anower, "MATLAB Based Fault Analysis Toolbox for Electrical Power System," in Electrical and Computer Engineering, 2006. ICECE '06. International Conference on, pp. 116-119.
[5] G. ADAM, G. LIVINT, and a. G. STAN, "A Matlab Graphical User Interface for Studying Brushless DC Motor Control," presented at the Buletinul AGIR, Romania, 2011.
[6] A. M. Bonilla, A. C. Santos, M. C. Gil, D. B. Diez, and J. V. Espierrez, "Virtual Lab platform for distance learning courses in engineering technologies for the use of renewable energies," in Proceedings of IEEE Global Engineering Education Conference (EDUCON), Marrakech, Morocco April 2012, pp. 1-7.
[7] J. Muñoz and P. Díaz, "A Virtual Photovoltaic Power Systems Laboratory," presented at the IEEE EDUCON Education Engineering, Madrid, SPAIN, 2010.
[8] G. G. Karady, M. Reta-Hernandez, and A. Bose, "Role of laboratory education in power engineering: is the virtual laboratory feasible? II," in Power Engineering Society Summer Meeting, IEEE, 2000, pp. 1478-1483.
[9] H. Hodge, H. S. Hinton, and M. Lightner, "Virtual circuit laboratory," in Frontiers in Education Conference, (FIE) 30th Annual, 2000, pp. T1D/6 vol.1.
[10] L. D. Feisel and A. J. Rosa, "The role of the laboratory in undergraduate engineering education," Journal of Engineering Education, vol. 94, pp. 121-130, Jan 2005.
[11] J. Baher, "Articulate Virtual Labs in Thermodynamics Education: A Multiple Case Study*," Journal of Engineering Education, vol. 88, pp. 429-434, 1999.
[12] A. Sauhats and M. Danilova, “Fault location algorithms for super high voltage power transmission lines”, In proceedings of the IEEE PowerTech, Bologna, Italy, 2003.
[13] S. Shaaban and H. Takasshi “Transmission line faults classification using wavelet transform”, In Proceedings of the 14th International Middle East Power Systems Conference (MEPCON’10), Cairo University, Egypt, December 19-21, 2010. [14] P. Chiradeja and A. Ngaopitakkul, “Identification of fault types for single circuit
transmission line using discrete wavelet transform and artificial neural networks”, In Proceedings of the International MultiConference of Engineers and Computer Scientists (IMECS), Vol. 2, Hong Kong, March 18-20, 2009.
[15] A. Hajjar, M. Mansour and H. Tallat, “Wavelets for six-phase transmission lines relaying: fault classification and phase selection”, IEEE MELECON, Cairo, Egypt, pp. 235-239, 7-9 May, 2002.
[16] A. M. Stanković and A. Timur “Analysis of asymmetrical faults in power systems using dynamic phasors” IEEE Transactions on Power Systems, Vol. 15, No. 3, pp. 1062-1068, August 2000.
[17] K. Savaş and A. Zafer, “A MATLAB/GUI Fault simulation tool for power system education”, Mathematical and Computational Applications, Vol. 14, No. 3 pp. 207-217, 2009.
[18] T. K. Nagsarkar and M.S Sukhija, Power system Analysis, Oxford Higher Education, University press, , pp. 381-418, 2007
[19] J.C. Das “Power System Analysis Short-Circuit Load Flow and Harmonics”, Marcel Dekker, Inc. New York, 2002.
[20] J. Svajger and V. Valencic, "Discovering electricity by computer-based experiments," Education, IEEE Transactions on, vol. 46, pp. 502-507, 2003. [21]P. J. Mosterman, M. A. M. Dorlandt, J. O. Campbell, C. Burow, R. Bouw, A. J.
Brodersen, and J. R. Bourne, "Virtual Engineering Laboratories: Design and Experiments," Journal of Engineering Education, vol. 83, pp. 279-285, July 1994. [22] T. J. Roberts, "The Virtual Machines Laboratory," Australasian Journal of
engineering Education, vol. 01, p. 15, 01- 2004.
[23] Y. H. Elawady and A. S. Tolba, "Educational Objectives of Different Laboratory Types: A Comparative Study," International Journal of Computer Science and Information Security (IJCSIS), vol. Vol. 6, p. 8, Friday, 4 December 2009. [24] D. J. GLOVER, M. S. SARMA, and T. J. OVERBYE, Power System Analysis
and Design, International student Edition ed. United States of America: Cengage Learning, 2008.
[25] J. S. Djeumen, J. Le Roux, and D. V. Nicolae, "Virtual Laboratory Development for Teaching Power Systems via Interactive Experiment Environment," in Sofware Engineering and Applied Computing
(ACSEAC), 2012 African Conference on, 2012, pp. 82-89.
[26]A. S., HEGEDUS, COPOT, C., CHEVALIER, A., NASCU, I. & DE KEYSER, R. Remote laboratory: A novel tool for control engineering
laboratories. System Theory, Control and Computing (ICSTCC), 17th International Conference, 11-13 Oct. 2013. 256-261.
[27]S. Wen-Jye, S. Te-Jen and L. Chia-Ming. Development of Remote Monitoring and a Control System Based on PLC and WebAccess for Learning
Mechatronics. Int J Adv Robot Syst, 2013, 10:97. doi: 10.5772/55363
[28]C. M. Ionescu, E. Fabregas, S. M. Cristescu, S. Dormido, and R. De Keyser, "A Remote Laboratory as an Innovative Educational Tool for Practicing Control Engineering Concepts," Education, IEEE Transactions on, vol. 56, pp. 436-442, 2013.
[29]V. Fedák, T. Balogh, and P. Záskalický, "Dynamic Simulation of Electrical Machines and Drive Systems Using MATLAB GUI," ed: INTECH, 2012. [30] P. Casals-Torrens, "Virtual Laboratory for Learning Asynchronous Motors in Engineering Degrees," Tecnologias del Aprendizaje, IEEE Revista