vu iv
I v 111 vu11111
0000092469
STUDY OF RAINFALL-RUNOFF RELATIONSHIP USING HYDROLOGICAL MODELLING SYSTEM (HEC-HMS) FOR KURAU RIVER BASIN, PERAK
AMANINA BT NASRUDDIN
A thesis submitted in fulfillment of the requirements for the award of the degree of
B.ENG (HONS.) CIVIL ENGINEERING
Faculty of Civil Engineering and Earth Resources UNIVERSITI MALAYSIA PAHANG
V
ABSTRACT
Landuse changes and urbanisation has always been blamed as among the major causes of the increase in the magnitude and frequency flooding. Flash flood had occured in Kurau River due to low lying of the draining area which the drainage capacity cannot cattle the quantity of water when the capacity of runoff increases. When the quantity of the runoff is increasing and filled all the drainage and river, the flood will then occur. Therefore, this research aim is to to carry out rainfall-runoff modelling exercises using HEC-HMS Model, determine the rainfall-runoff relationship in Kurau River basin, Perak and to get appropriate model to predict discharge after calibration, validation and verification process. Relationship between rainfall and runoff will then be determined by the producing hydrograph from this software. In this software, hydrology parameter such as rainfall data and stream flow data are important to simulate rainfall-runoff data. In this study, HEC-HMS were used to develop hydrologic model for Sungai Kurau Basin based on the available data. These models were calibrated on November 1999 and validate on March 1999. The simulated model were approximately fit with the observed data and shows that the HEC-HMS are suitable model to predict hydrologic changes in Sungai Kurau Basin. The performance of determination RMSE value is used to measure the performance of the hydrologic modelling. From the calibration results, the RMSE value for Bt 14 discharge station and Pondok Tanjung were 2.060 m 3/s and 1.474 m3/s. From the validation result, the RMSE value for Bt 14 discharge station and Pondok Tanjung were 1.342 m3/s and 1.846 m3/s. Lower values are better.
ABSTRAK
Perubahan guna tanah dan pembandaran sentiasa dipersalahkan sebagai antara punca utama peningkatan dalam magnitud dan kekerapan banjir. Banjir kilat telah berlaku di
Sungai Kurau kerana kawasan penyaliran rendah yang kapasiti saliran tidak boleh manampung kuantiti air apabila kapasiti peningkatan air meningkat. Apabila kuantiti air larian semakin meningkat dan memenuhi semua perparitan dan sungai, banjir akan berlaku. Oleh itu, tujuan kajian mi adalah untuk menjalankan latihan pemodelan hujan-air larian menggunakan HEC-HMS Model, menentukan hubungan huj an-hujan-air larian di Kurau Sungai lembangan, Perak dan untuk mendapatkan model yang sesuai untuk meramalkan pelepasan selepas penentukuran, pengesahan dan proses pengesahan. Hubungan antara hujan dan air larian akan ditentukan oleh hidrograf daripada perisian mi. Dalam perisian mi, parameter hidrologi seperti data hujan dan data aliran sungai adalah penting untuk mensimulasikan data hujan-air larian. Dalam kajian mi, HEC-HMS telah digunakan untuk membangunkan model hidrologi untuk Lembangan Sungai Kurau berdasarkan data yang ada. Model-model mi telah ditentukur pada November 1999 dan mengesalikan pada Mac 1999. Model simulasi kira-kira patut dengan data yang dicerap dan menunjukkán bahawa HEC-HMS adalah model yang sesuai untuk meramalkan perubahan hidrologi di Lembangan Sungai Kurau. Pekali penentuan nilai RMSE digunakan untuk mengukur prestasi model hidrologi. Daripada keputusan kalibrasi, nilai RMSE untuk Bt 14 stesen dan Pondok Tanjung adalah 2,060 m 3/s dan
1.474 m3/s. Dari hasil pengesahan, nilai RMSE untuk Bt stesen 14 dan Pondok Tanjung adalah 1.342 m 3/s dan 1,846 m3/s. Nilai yang lebih rendah adalah lebih baik.
TABLE OF CONTENT Page SUPERVISOR'S DECLARATION STUDENT'S DECLARATION ACKNOWLEDGEMENT ABSTRACT ABSTRAK TABLE OF CONTENTS LIST OF TABLES LIST OF FIGURES xi
LIST OF SYMBOLS xiii
LIST OF ABBREVIATIONS xiv
CHAPTER 1 INTRODUCTION 1.1 Background Of Study 1 1.2 Problem Statement 3 1.3 Objective Of Study 3 1.4 Scope Of Study 5 1.5 Significant Of Study 3 4
CHAPTER 2 LITERATURE REVIEW
2.1 Hydrology 5
2.1.1 Hydrologic Cycle 5
2.2 Hydrological Characteristics 7
2.2.1 Rainfall 7
2.2.2 Runoff 7
2.2.2.1 Factor Affecting Runoff 8
2.2.3 Specific Peak Discharge 8
2.3 Physical Characteristics of the Basin S
2.3.1 Land use S
2.3.2 Slope S
2.3.3 Elevation of the Basin S
2.4 Flood 10
2.4.1 Factor Affecting Flood 10
2.5 Rainfall - Runoff Relationship 10
2.6 Hydrograph 11
2.6.1 Unit Hydrograph Method 12
2.6.1.1 Synder's UH 13
2.6.1.2 SCS UH 15
2.6.1.3 Clark's UH 16
2.7 Software for Analyzing rainfall and Runoff Relationship 17
2.7.1 HEC-HMS 17
2.7.1.lModelling Basin Component 17
2.7.1 .2Losses 18 2.7.1 .3Runoff Transform 18 2.7.1.4 Rainfall-Runoff Simulation 18 2.7.1 .5 Parameter Estimation 19 2.7.1.6 Computational result 19 2.8 Advantages of HEC-HMS 19
2.9 Root Mean Square Error 20
CHAPTER 3 METHODOLOGY
3.1 Introduction 21
3.2 Flow Chart of Methodology 22
3.3 Data Collection 23
3.3.1 Rainfall Data 23
3.3.2 Streamfiow Data 24
3.4 Method of Simulation Rainfall-Runoff Data in HEC-HMS 24
CHAPTER 4 RESULTS AND DISCUSSION
4.1 Introduction 26
4.2 Model Setup 26
4.2.1 ArcGIS 26
4.2.2 HEC-HMS Model Setup 28
4.3 Simulation with HEC-HMS 28
4.3.1 Analysis 29
4.1 Model Calibration 42
4.2 Model Validation 44
CHAPTER 5 CONCLUSION AND RECOMMENDATIONS
5.1 Conclusions 46
5.2 Recommendations 47
REFERENCES 48
APPENDICES 49
A Samples of Rainfall Data 49
B Samples of Streamfiow Data 53
LIST OF TABLE
Table No. Title Page
2.1 Intensity of rainfall 7
3.1 Data for HEC-HMS and the sources 23
3.2 Rainfall station use in HEC-HMS Model 23
3.3 Streamfiow station use in HEC-HMS Model 24
xi
LIST OF FIGURES
Figure No. Title Page
1.1 Distribution of earth's water 2
2.1 Hydrologic cycle 6
2.2 Rainfall-runoff relationship 11
2.3 Hydrograph 12
2.4 Synder's unit hydrograph 13
2.5 SCS unit hydrograph 15
3.1 Flow chart of methodology 22
4.1 Kurau River Basin 27
4.2 Location of rainfall and streamfiow station 27
4.3 HEC-HMS layout Model 28
4.4 Runoff hydrograph for Batu 14 discharge station 30
4.5 Runoff hydrograph for Pondok Tanjung discharge station 30
4.6 Runoff hydrograph for Batu 14 discharge station 31
4.7 Runoff hydrograph for Pondok Tanjung discharge station 31
4.8 Runoff hydrograph for Batu 14 discharge station 32
4.9 Runoff hydrograph for Pondok Tanjung discharge station 32
4.10 Runoff hydrograph for Batu 14 discharge station 33
4.11 Runoff hydrograph for Pondok Tanjung discharge station 33
4.12 Runoff hydrograph for Batu 14 discharge station 34
4.14 Runoff hydrograph for Batu 14 discharge station 35
4.15 Runoff hydrograph for Pondok Tanjung discharge station 35
4.16 Runoff hydrograph for Batu 14 discharge station 36
4.17 Runoff hydrograph for Pondok Tanjung discharge station 36
4.18 Runoff hydrograph for Batu 14 discharge station 37
4.19 Runoff hydrograph for Pondok Tanjung discharge station 37
4.20 Runoff hydrograph for Barn 14 discharge station 38
4.21 Runoff hydrograph for Pondok Tanjung discharge station 38
4.22 Runoff hydrograph for Barn 14 discharge station 39
4.23 Runoff hydrograph for Pondok Tanjung discharge station 39
4.24 Runoff hydrograph for Barn 14 discharge station 40
4.25 Runoff hydrograph for Pondok Tanjung discharge station 40
4.26 Runoff hydrograph for Barn 14 discharge station 41
4.27 Runoff hydrograph for Pondok Tanjung discharge station 41
4.28 Runoff hydrograph for Barn 14 discharge station 42
4.29 Runoff hydrograph for Pondok Tanjung discharge station 43
4.30 Runoff hydrograph for Barn 14 discharge station 44
LIST OF SYMBOLS
% Percentage
tiag Lag time
t c Time of concentration
A Watershed drainage area
S Slope CN Curve Number tr Rainfall duration C Conversion constant t Basin lag U, Peak of standard UH
It Average inflow to storage at time t
Ot Average outflow to storage at time t
Observed values
Xmodel,i Simulated values at time/place
Summation
LIST OF ABBREVIATIONS
HEC-HMS Hydrologic Engineering Centre-Hydrologic Modelling System
RMSE Root Mean Square Error
sCS Soil Conservation Services
UH Unit Hydrograph
CHAPTER 1
INTRODUCTION
1.1 BACKGROUND OF STUDY
Hydrology is the study of the water cycle or the movement of water around its cycle. It encompasses the occurrence, distribution, movement, physical and chemical properties of the water through the air, over the ground surface, and through the earth strata. Hydrology also deals with the interactions with the physical and biological environment, including their responses to human activity. A knowledge of hydrology is one of the key ingredients in decision-making processes where water is involved.
Most of the Earth's water, 97%, resides in the ocean system, with about 2.5% on land. The atmosphere holds less than 0.01%, in spite of the fact that atmospheric water is so important to weather and climate. The annual precipitation for the earth is more than 30 times the atmosphere's total capacity to hold water. This fact indicates the rapid recycling of water that must occur between the earth's surface and the atmosphere. Distribution of earth's water shown in Figure 1.1.
Where is Earth's Water?
2
Freshwater 2.5% Chea.n10% Oceans 96.5% Vj Surface/other freshwater 1.34 Ground-water 30.1% Glaciers and ice caps 68.6%Atmosphere Living things 0.22% ' --- -Rivers 0.22% 0.46% \swamps, Lakes 20.1% \ marshes 2.5% Soil moisture 3.5% Ice and snow 73.1%
Total -global Freshwater Surface water and
water. other freshwater
Figure 1.1: Distribution of earth's water
Hydrologic Engineering Centre-Hydrologic Modelling System (HEC-HMS) had been used as tool for the hydrologic modelling of Sungai Kurau basin. HEC-HMS is used as hydrological model which was widely applied in many water resources studies (He et al.2007, Garcia et al. 2008). In this study, HEC-HMS was used to determine the rainfall-runoff relationship and analyze rainfall-runoff data.
HEC-HMS is designed to simulate the precipitation-runoff processes of dendntic drainage basins Also, the function of HEC-HMS is can be use for solving the possible problems in a wide range of geographic areas. This includes large river basin water supply and flood hydrology, and small urban or natural watershed runoff. Relationship between rainfall and runoff will then be determined by the producing hydrograph from this (HEC-HMS) computer software.
3
1.2 PROBLEM STATEMENT
Nowadays, flood is the most significant disaster in Malaysia that effect to the social and economic of the population. Kurau River is the draining area that is generally low-lying area has been identified as one of the river that contributes flood problem. Heavy rainfall can cause the excess of runoff rise to the high water levels and causing the low-lying areas to be flooded. Flash flood had occured in Kurau River due to low lying of the draining area which the drainage capacity cannot cattle the quantity of water when the capacity of runoff increases. When the quantity of the runoff is increasing and filled all the drainage and river, the flood will then occur. Moreover, a large part of this river basin area is well developed urban area with different land-use activities and also high population density were also the major causes of the flood problem. Usually, land-use changes within a river basin give impacts to the hydrologic behaviour of the basin.
In order to prevent the disaster happen, this research was carried out to analyze the relationship between rainfall and runoff. Hydrologic Engineering Centre-Hydrologic Modelling System (HEC-HMS) is one of the computer programs that can be used to simplify the data and assist to understand the hydrological characteristics. HEC-HMS was used to develop rainfall-runoff from a design rainfall or historic rainfall event for Kurau River basin. In this software, hydrology parameter such as rainfall data and stream flow data are important to simulate rainfall-runoff data; By analyzed the data using HEC-HMS, it can assist to recognized the rainfall-runoff relationship in a certain period.
1.3 OBJECTIVES OF STUDY
The objectives of this study are:
1. To carry out rainfall-runoff modelling exercises using HEC-HMS Model. 2. To determine the rainfall-runoff relationship in Kurau River basin, Perak.
3. To get appropriate model to predict discharge after calibration, validation and verification Model.
1.4 SCOPES OF STUDY
Kurau River basin was selected as the case study in this research which is located in Perak, Malaysia. Kurau River is the main drainage artery of the basin and it is draining an area of approximately 682 km 2 that is generally low-lying area. The catchment area is approximately 384 km2 and is drained by Kurau River and Ara River.
The Kurau River basin is one of the suitable river basin that can be used for this research because of the some reasons such land-use changes and urbanization. The main land uses for this area are forest (46.29%) and agriculture (42.80%) and about 50% of the land is privately owned, which makes it very difficult to implement good land use policies management.
HEC-HMS model were used to determine the rainfall-runoff relationship and analyze rainfall-runoff based on available data of Kurau River basin. HEC-HMS is equipped to model a network of channels and helps to simplify the data that obtain from rainfall and runoff value. Relationship between rainfall and runoff will then be determined by the producing hydrograph from this software.
1.5 RESEARCH SIGNIFICANCE
The study will be a significance endeavour in provided the information for the future researches. From this research, the relationship between rainfall and runoff can be determined based on available data. It is important to do this research because we can determine the rainfall quantity and the runoff capacity for Kurau River basin. The output for this research can be a guideline to improvise the drainage system for river basin and controlled the land-use activities to prevent the flood in future. In addition, this research is very significance to the community and field of civil engineering in Malaysia.
CHAPTER 2
LITERATURE REVIEW
2.1 HYDROLOGY
Hydrology is the study of water on the Earth (Meinzer, 1923). A knowledge of hydrology is one of the key ingredients in decision-making processes where water is involved. According to Gupta, (1979), the knowledge of hydrology is not only useful in the field of engineering, but also in agriculture, forestory, and other branches of natural science. Thus, the definition of hydrology can be interpreted as presented by the U.S National Research Council in the following quote:
"Hydrology is the science that treats the waters of the Earth their occurrence, circulation and distribution, their chemical and physical properties, and their reaction with the environment, including the
relation to living things. The domain of hydrology embraces the full life history of water on Earth."
2.1.1 Hydrologic Cycle
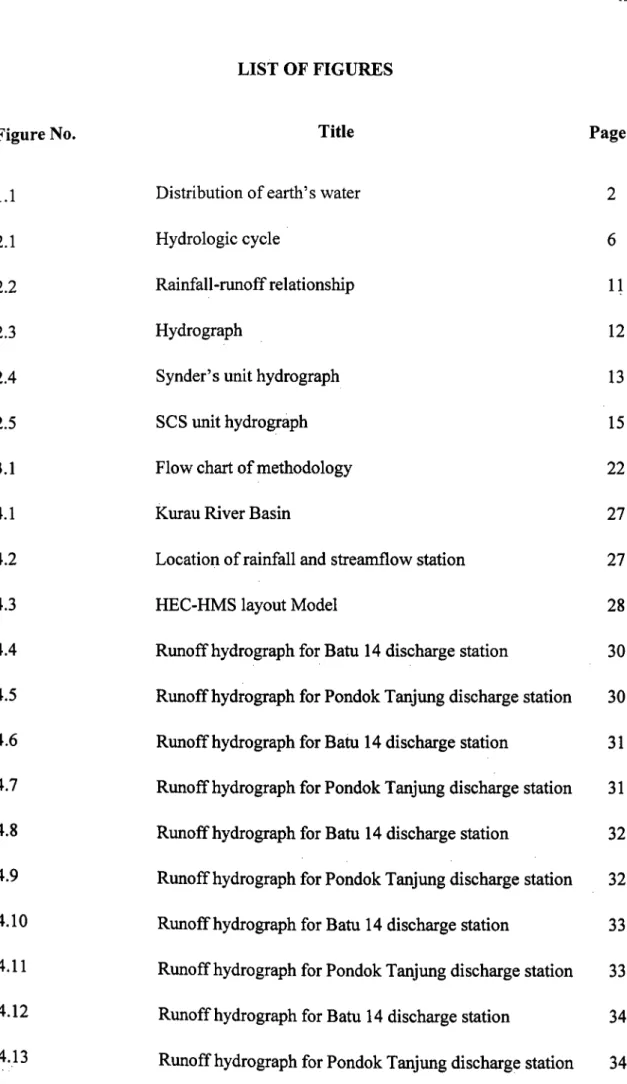
Hydrologic cycle is the continuous, unsteady circulation of water from the atmosphere to and under, the land surface and back to the atmosphere by various processes (Walesh, 1989). The Hydrologic Cycle, also known as the water cycle is the most important natural phenomenon on Earth. Hydrologic cycle is defined as the pathway of water as it moves in its various phases through the atmosphere, to the earth, over and through the land, to the ocean and back to atmosphere (National Research Council, 1999). It describes the constant movement and endless recycling of water
between the atmosphere, land surface, and under the ground. Also, the hydrologic cycle supplies the force needed for most natural processes, thus supporting life itself. Figure 2.1 define the components and illustrate the pathway of water in hydrologic cycle.
IflT1I
•
i
I 111 c&mi) /7.t\\ -. v__•*._ - ',.. .-'. • .- ____ FlowFigure 2.1: Hydrologic cycle
Within the hydrologic cycle, water may appear in all three of its states; solid, liquid, and gas. Wards, (2002) has explained the hydrological processes involved in the cycle. In this cycle, water is transferred from the surface to the atmosphere through evaporation which a substance changes from liquid to the gas phase. The sun's heat provides energy to evaporate water from the earth's surface. As air containing water vapour rises up and condenses into clouds, water droplets grow into larger and will not be able to stay suspended in the cloud. When this occurs, precipitation will occur. Precipitation can occur primarily as rain. Annual amounts of precipitation are unpredictable and variable ranging from approximately 2000 mm to 4000 mm for various locations in Malaysia. When precipitation falls to the ground surface, it will either be absorbed into the ground (groundwater) or flow into streams, rivers, lakes or end up back in the oceans. After that, some of runoff will be evaporated and some of the groundwater will be taken by plants and then transpired (Hubbart, J, 2011).
7
2.2 HYDROLOGICAL CHARACTERISTICS
Hydrological Characteristics include: rainfall distribution and runoff distribution and specific peak discharge.
2.2.1 Rainfall
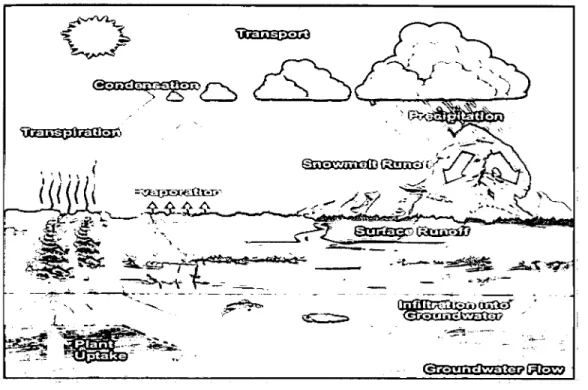
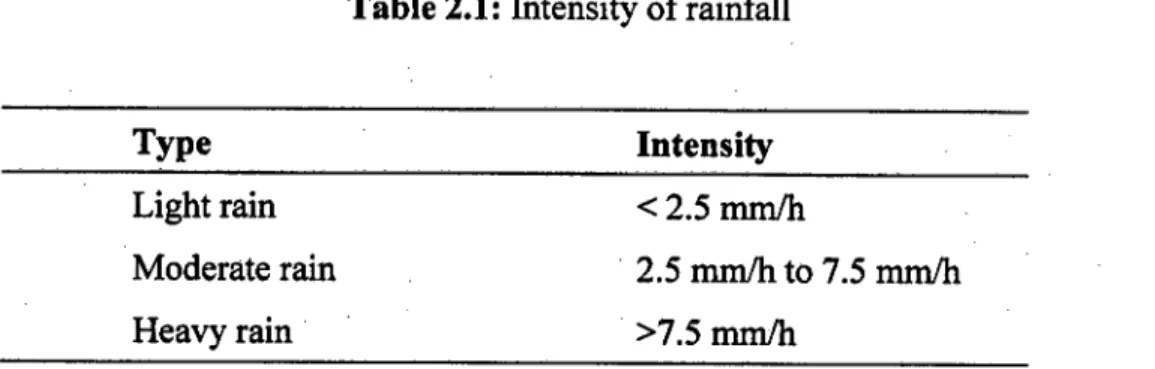
Rain is form of droplets that have condensed from atmospheric water vapour. Eventually, the water droplets grow into larger droplets by colliding and coalescing with each other. Rain develops when growing cloud droplets become too heavy and not be able to remain suspended in the cloud and as a result, fall out of the cloud toward the surface as rain. Rain can also begin as ice crystals that collect each other to form large snowflakes. As the falling snow passes through the freezing level into warmer air, the flakes melt and collapse into rain drops. Precipitation in the form of water drops of sizes larger than 0.5 mm. The maximum size of the raindrop is about 6 mm. On the basis of its intensity, rainfall is classified as shown in Table 2.1.
Table 2.1: Intensity of rainfall
Type Intensity
Light rain <2.5mm/h
Moderate rain 2.5 nmi/hto 7.5 mm/h
Heavy rain - >7.5 mm/h
2.2.2 Runoff
Runoff may be defined as that part of precipitation as well as of any other flow contribution which appear in surface streams (Gupta, 1979). Runoff, sometimes referred to as overland flow, is the process whereby water moves from the ground surface to a waterway or water body. Normally applies to flow over a surface. Rain falling in a watershed in quantities exceeding the soil or vegetation uptake becomes runoff. Runoff will be used to collectively describe the precipitation that is not directly infiltrated into the groundwater system. Runoff producing events are usually thought of as those that
saturate the soil column or occur, during a period when the soil is already saturated. Thus infiltration is halted or limited and excess precipitation occurs. This may also occur when the intensity rate Of the precipitation is greater than the infiltration capacity.
2.2.2.1 Factor Affecting Runoff
There are many factors affecting runoff such as the intensity of rainfall, duration of rainfall, distribution of rainfall, direction of storm movement, soil moisture and other climate conditions. The intensity of rainfall has a great influence on runoff. Rainfall with higher intensity will generate more runoff than low intensity rainfall. If rainfall continues over an extended period, the water table may rise and sometimes even may touch the ground surface in low lying areas, reducing the infiltration capacity to zero of that area and there may be chances of serious flood hazard. The runoff from a drainage basin depends on distribution of rainfall. For a given total rainfall all other conditions being the same, greater the coefficient, greater will be the peak runoff. However, for the same distribution coefficient, the higher the peak runoff would result for the storm falling on the lower part of the basin
2.2.3 Specific Peak Discharge
Peak discharge is the peak rate of surface runoff from a drainage area for a given rainfall. The peak discharge from a small rural watershed is usually caused by intense rainfall. The intensity of rainfall affects the peak discharge more than it does the volume of runoff. Intense rainfall that produces high peak discharge in small watersheds usually does not extend over large area.
2.3 PHYSICAL CHARACTERISTICS OF THE BASIN
Physical characteristics of the basin include: land use, slope of the drainage, elevation of the basin.
2.3.1 Land use
The land use or land management has a great effect on the resulting surface runoff. Consider a virgin forest area, in which a thick mulch of leaves and grass etc has accumulated. In such areas even the heaviest down pours or rains would be unable to generate surface runoff that would reach the streams. On the other hand, if the forest is removed and the land is cultivated after removing the mulch, the ground will become compacted. As a result of which even a mild rainfall will result in appreciable surface runoff.
2.3.2 Slope
Investigations on experimental runoff plots have shown that steep slope yield more runoff than those with gentle slope (Sharma, 1993). In addition, it was observed that quantity of runoff decreased with increasing slope length. In case of steeper basins the velocity of flow will be more and runoff will take lesser time to reach the stream, resulting in higher runoff.
2.3.3 Elevation of The Basin
The elevation of the basin also affects the runoff as it governs the rainfall, its type and amount. The higher the elevation, the lesser the losses. At higher elevations much of the precipitation is impounded in the form of snow etc.
2.4 FLOOD
Flood is the most significant disaster phenomena that effect to the social and economic of the population (Smith and Ward 1998). Floods is defined as any flow that exceeds the bank full capacity of a stream or channel and flows out on the floodplain, greater than bank full discharge. River flooding is caused by the incidence of the heavy rainfall and the resultant large concentration of runoff, which exceeds river capacity. Basically, flooding problems have escalated as a result of land use changes to pave the way for development. Some of the most important factors that determine the features of floods are rainfall event characteristics, duration of the rainfall event, the velocity of the flow, and depth of the flood.
2.4.1 Factors Affecting Floods
There are many factors that cause floods in Malaysia, The factors are inland flooding due to inadequate drainage, localised rainfall, tidal and backwater effects, and over spilling of bank due inadequate to river channel capacity.
2.5 RAINFALL-RUNOFF RELATIONSHIP
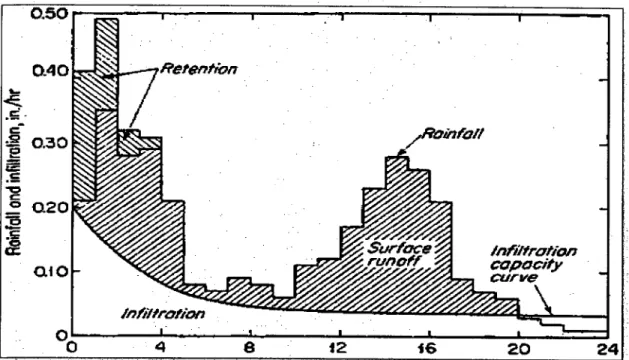
Rainfall is known as the main contributor, to the generation of surface runoff. Therefore there is a significant and unique relationship between rainfall and surface runoff. When rain falls, the firstdrops of water are intercepted by the leaves and stems of the vegetation This is usually referred to as interception storage Once they reach the ground surface, the water will infiltrates into the soil until it reaches a stage where the rate of rainfall intensity exceeds the infiltration capacity of the soil. The infiltration capacity of soil depends on the soil texture and structure. The initial capacity of a dry soil is high but as the storm continues, the soil capacity will decrease until it reaches a steady value as final infiltration rate (Lewis and Viessman, 2003). The process of runoff generation continues as long as the rainfall intensity exceeds the actual infiltration capacity of the soil but it stops as soon as the rate of rainfall drops below the actual rate of infiltration. Figure 2.2 shows that the rainfall-runoff relationship.
11 i
I
I..
I - ' • S : •Figure 2.2: Rainfall-runoff relationship
2.6 HYDROGRAPH
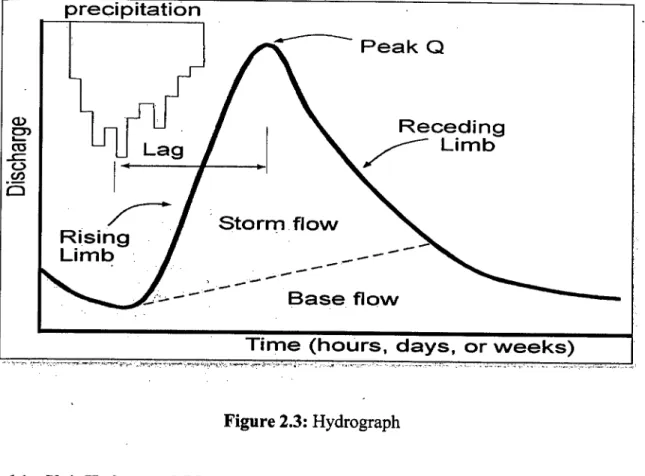
A hydrograph may be used to show how the water flow in a drainage basin (particularly river runoff) responds to a period of rain. Hydrograph is a plot of discharge (flow rate in cfs or ems) versus time for a given location within a stream and represents the main hydrologic response function as shown on Figure 2.3. 1-lydrograph analysis is the most widely used method of analyzing surface runoff. The hydrograph of surface runoff resulting from a relatively short, intense rain, called a unit storm (Clark, 1945). The relative contribution of each component to the hydrograph is depends on:
• rainfall rate, intensity, relative to the infiltration rate, infiltration rate of the soil • level of soil moisture, storage versus field capacity, total infiltration of the soil
precipitation
Peak
Receding
Jnru,Lag
Limb
I
{J IC,) II
/______•_
I
Storm flow
NS
Rising
-
Limb
-
---Base flow
Time (hours, days, or weeks)
Figure 2.3: Hydrograph
2.6.1 Unit Hydrograph Method
The unit hydrograph is a well known, commonly used empirical model of the relationship of direct runoff to excess precipitation. Unit Hydrograph can be defined in the absence of the precipitation and runoff data necessary to derive the unit hydrograph. The equations and the parameters of the model have limited physical significance. Instead, they are selected through optimization of some goodness-of-fit-criterion.
Synthetic hydrograph also the common method use to analyze rainfall. According to Chow, Maidment, Mays, (1998), synthetic unit hydrograph fall into three categories: Synder's unit hydrograph, Soil Conservation Service unit hydrograph, Clark unit hydrograph. All of these synthetic unit hydrograph models are included in HEC-HMS.
13
2.6.1.1 Synder's UH
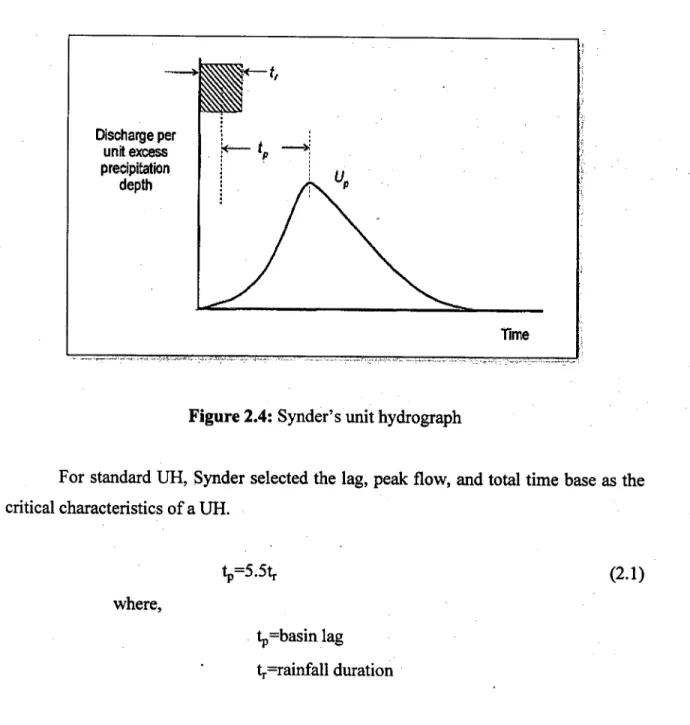
Since peak flow and time of peak flow are two of the most important parameters characterizing a unit hydrograph, the Synder method employs defining these parameters which are then used in the synthesis of the unit graph (Synder, 1938). Figure 2.4 shows the Synder's Unit Hydrograph.
Figure 2.4: Synder's unit hydrograph
For standard UR, Synder selected the lag, peak flow, and total time base as the critical characteristics of a UI-I.
tpS.Str (2.1)
where,
tbasin lag t1 rainfa1l duration