Energy Procedia 50 ( 2014 ) 711 – 718
Available online at www.sciencedirect.com
ScienceDirect
1876-6102 © 2014 Elsevier Ltd. This is an open access article under the CC BY-NC-ND license (http://creativecommons.org/licenses/by-nc-nd/3.0/).
Selection and peer-review under responsibility of the Euro-Mediterranean Institute for Sustainable Development (EUMISD) doi: 10.1016/j.egypro.2014.06.087
The International Conference on Technologies and Materials for Renewable Energy, Environment
and Sustainability, TMREES14
Development of Rapid Chemical Oxygen Demand Analysis
using Ozone as Oxidizing Agent
Nipon Pisutpaisal
a,b,*,Ubonrat
Sirisukpoca
caDepartment of Agro-Industrial, Food and Environment Technology, Faculty of Applied Science, King Mongkut’s University of Technology North Bangkok, 10800, Thailand
bThe Biosensor and Bioelectronics Technology Centre, King Mongkut’s University of Technology North Bangkok, 10800, Thailand cProgram of Computer, Faculty of Science and Technology, Nakhon Pathom Rajabhat University, Nakhon Pathom, 73000, Thailand
Abstract
A new and environmental friendly method for the rapid determination of Chemical Oxygen Demand (COD) as a measure of organic pollution was developed. Ozone was used as an oxidizing agent in the current method. Experiment was setup in 500 mL glass bottle containing 390 mL distilled water and 10 mL wastewater sample at 31ºC. The extent of dissolved ozone reacted with the wastewater sample was monitored through an ozone sensor. Reaction time of 60 seconds achieved good linear correlation between the extent of ozone degradation and the wastewater concentrations. The results showed that the rate and extent of ozone degradation are linearly proportional to the initial COD concentrations in range of 0-80mg/L for the glucose-containing distilled water and canteen wastewater.
© 2014 The Authors. Published by Elsevier Ltd.
Selection and peer-review under responsibility of the Euro-Mediterranean Institute for Sustainable Development (EUMISD). Keywords: COD; chemical oxygen demand; ozone; water quality analysis
1. Introduction
Water resource exhibits significant roles, e.g. as inhabitants for animals and plants, resources for household, agricultural, and industrial uses, and waterway for transportation. The clean water profoundly impacts environment and various sectors such as commercial fishing, agricultural, and recreation and tourism industries. In the past
* Corresponding author.Tel.: +662-587-8257; fax: +662-587-8257.
E-mail address: [email protected]
© 2014 Elsevier Ltd. This is an open access article under the CC BY-NC-ND license (http://creativecommons.org/licenses/by-nc-nd/3.0/).
of the most serious environmental problems since domestic sewage, industrial effluents, and agricultural run-off all contribute to increasing pollution of these water bodies. The pollution of our water resources can have serious and wide-ranging effects on the human health, fisheries, agriculture and industry, and results in associated health and economic costs. The immediate effects of water pollution can be seen in water bodies and the animal and plant life that inhabits them. Pollution poisons and deforms fish and other animals, unbalances ecosystems and causes a reduction in biodiversity. Ultimately, these effects take their toll on human life. Chemical oxygen demand (COD) and biological oxygen demand (BOD) are two main indexes used to assess the organic pollution in aqueous systems. The BOD reflects the biodegradable part of the pollutants, but the COD analysis represents total organic pollution load of most wastewater discharges [1]. COD is the amount of oxygen equivalents consumed in the oxidation of organic compounds strong oxidizing agents. Chromate or permanganate is utilized to oxidize the organic compounds under strong acidic and high temperature reflux conditions to achieve complete oxidation [2]. The standard method of COD analysis is a time-consuming procedure; unable of be online monitored; requires expensive (Ag2SO4) and toxic (HgSO4) reagents; and generate hazardous waste which requires disposal [3, 4]. Various
analytical techniques based on either electrocatalytic [5, 6] or photocatalytic [7–10] oxidation principles have been made to solve these problems [3-11].
A rapid, and environmental friendly method for determination of COD was developed by using ozone, high oxidizing power compound, in the current study. The extent of dissolved ozone reacted with the organic compounds in the wastewater sample was monitored through an ozone sensor. Linear correlation between the extent and rate of ozone used in the reaction and the wastewater concentrations was examined.
2. Materials and methods 2.1 Wastewaters
Three types of wastewaters including glucose-containing distilled water (AW I), glucose-containing wastewater (AW II), and canteen wastewater (CW) were used throughout the study. One liter of glucose containing AW II cosnisted of 0.017 g FeSO4·7H2O, 0.006 g MnSO4·H2O, 0.001 g ZnSO4·7H2O, 0.003 mg CuSO4, 0.31g KNO3, 0.13 g
KCl, 5.62 NaH2PO4·2H2O, 4.61 g Na2HPO4·7H2O. CW was obtained from King Mongkut’ University of
Technology North Bangkok. COD of the wastewaters was adjusted to achieve desire concentration by glucose.
2.2 Ozone monitoring system
The system was consisted of reactor (500-mL Schott Duran glass bottle with 400-mL working volume) with 4 ports (ozone input, wastewater injection, liquid influent and effluent ports) on a silicon stopper. Peristaltic pump (Masterflex 77202-60, Cole-Parmer Instrument Company, USA)draw the liquid with flow rate of 200 mL min-1 from
the reactor passing to the ozone probe (Mettler Toledo,Thornton M300, USA) and recirculated back into the reactor. Ozone generator (ECONOWATD Co.,Ltd., Bangkok, Thailand) with 500 mg h-1 production rate was used to supply
ozone gas in the system (Fig. 1). Dissolved ozone was monitored by an ozone probe connected to a data logger (WISCO AI210, Thailand).
2.3 Experimental setup
Degradation characteristics of ozone in distilled water (no glucose), AW I (no glucose), and CW was tested. Ozone was bubbled into the reactor containing 400 mL of distilled water or glucose-free AW. After the dissolved ozone reached the saturation point, the ozone generator was turned off. The dissolved ozone was monitoring and recorded every 20 seconds. In the experiments to determine the extent of dissolved ozone reacted with the glucose-containing wastewaters, 390 mL of distilled water or glucose-free AW I was added to the reactor. After the dissolved ozone became saturated and the ozone generator was turned off, 10 mL of wastewaters, glucose-containing distilled water, glucose-glucose-containing AW, or canteen wastewater was injected into the reactor. Dissolved ozone was monitoring and recorded every 20 seconds. The extent and rate of dissolved ozone degradation were calculated. COD of the wastewaters was determined according to Standard Methods for the Examination of Water and Wastewater [3].
Fig.1. Schematic of ozone monitoring system
3. Results and Discussions
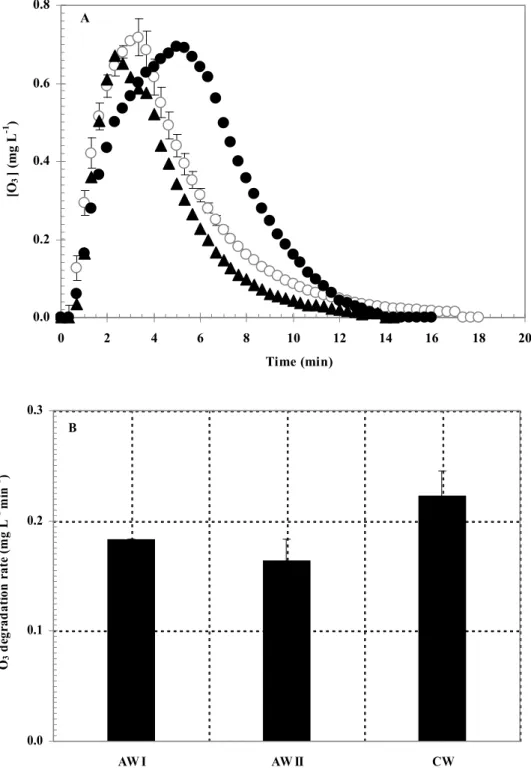
3.1 Degradation characteristics of ozone in glucose-free wastewater
Addition of ozone into the glucose-free AW I, AW II, and canteen wastewater required at least 4 min to reach the maximum dissolution of 0.7 mg L-1 for all wastewaters (Fig. 2A). Complete degradation of ozone after reach the
maximum dissolved concentration was approximately 10 min. High degradation rate of ozone in CW compared to the free AW I and II was observed (Fig. 2B). Maximum dissolved ozone concentration found in glucose-free AW I suggested that glucose-glucose-free AW I (distilled water) was the best liquid to provide the dissolved ozone for the reaction with wastewater samples.
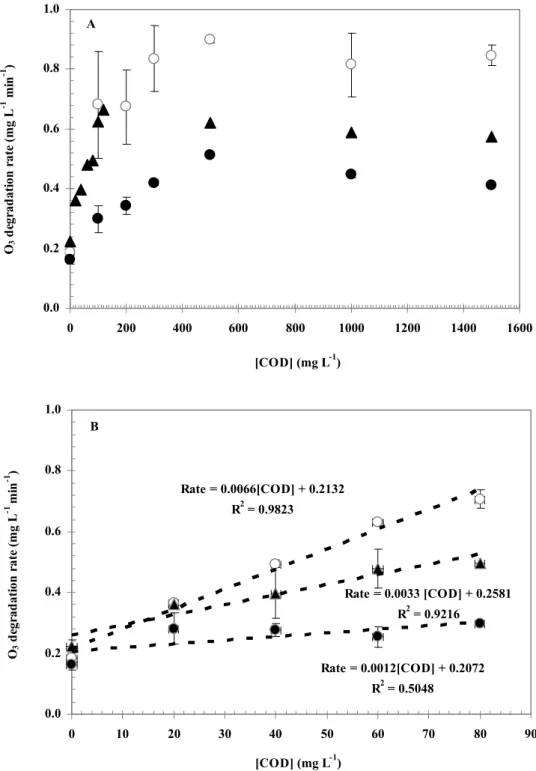
3.2 Rate and extent of ozone degradation of the wastewater samples
This test used dissolved ozone in distilled water of 390 mL as the source of oxidizing agent for glucose containing distilled water, AW II, and canteen wastewater samples with varying COD concentration in range of 0-1,500 mg L-1. Degradation rate of the ozone degradation reached saturation point at the COD concentration above
500 mg L-1 for all wastewater samples (Fig. 3A). Linear correlation between the degradation rate and COD
concentration with R2 > 0.92 was observed in the AW I and canteen wastewater in COD range of 0-80 mg L-1 (Fig.
3B). Reaction between dissolved ozone in distilled water (390 mL) and wastewater sample (10 mL) with varying COD concentration in range of 0-1,500 mg L-1 was observed in different reaction time of 20-60 seconds (Fig. 4).
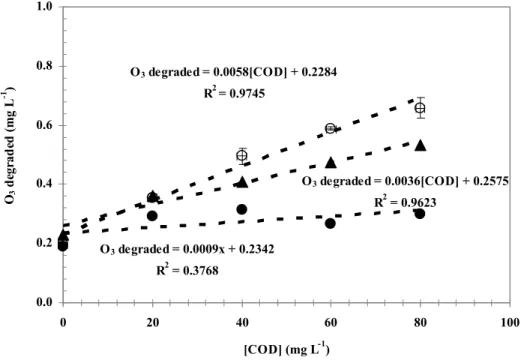
The extent of the ozone degradation reaching plateau at the COD concentration above 500 mg L-1 for all cases
(Fig. 4) suggested that linear correlation between the extent of ozone degradation and the COD concentration could be analyzed at the COD concentration below 500 mg L-1. Linear correlation between the extent and COD
concentration with R2 > 0.96 was observed in the AW I and canteen wastewater in COD range of 0-80 mg L-1 at the
0.0 0.2 0.4 0.6 0.8 0 2 4 6 8 10 12 14 16 18 20 Time (min) [O 3 ] (mg L -1 ) A 0.0 0.1 0.2 0.3 AW I AW II CW O3 d egr ad at io n r at e ( m g L -1 mi n -1 ) B
0.0 0.2 0.4 0.6 0.8 1.0 0 200 400 600 800 1000 1200 1400 1600 [COD] (mg L-1) O3 d egr ad ati on r ate (mg L -1 mi n -1 ) A Rate = 0.0066[COD] + 0.2132 R2 = 0.9823 Rate = 0.0033 [COD] + 0.2581 R2 = 0.9216 Rate = 0.0012[COD] + 0.2072 R2 = 0.5048 0.0 0.2 0.4 0.6 0.8 1.0 0 10 20 30 40 50 60 70 80 90 [COD] (mg L-1) O3 d egr ad ati on r ate (mg L -1 mi n -1 ) B
Fig. 3. Correlation between O3 degradation rate and concentrations of AW I (ż), AW II ( ), and CW (Ÿ) in the concentration range of
0-1,500 (A) and 0-80 mg L-1(B).Symbols represent mean values of duplicate experiments, error bars represent one standard deviation.
Fig. 4. Extent of O3 degraded after reaction time of 20 (ż), 40 (Ɣ), and 60 ( ) seconds with AW I (A), AW II (B), and CW (C).
A
0.0 0.2 0.4 0.6 0.8 0 200 400 600 800 1000 1200 1400 1600 [COD] (mg L-1) O3 d egr ad ed (mg L -1 )B
0.0 0.2 0.4 0.6 0.8 1.0 0 200 400 600 800 1000 1200 1400 1600 [COD] (mg L-1) O3 d eg rad ed (mg L -1 )C
0.0 0.2 0.4 0.6 0.8 1.0 0 200 400 600 800 1000 1200 1400 1600 [COD] (mg L-1) O3 d egr ad ed (m g L -1 )O3 degraded = 0.0058[COD] + 0.2284 R2 = 0.9745 O3 degraded = 0.0009x + 0.2342 R2 = 0.3768 O3 degraded = 0.0036[COD] + 0.2575 R2 = 0.9623 0.0 0.2 0.4 0.6 0.8 1.0 0 20 40 60 80 100 [COD] (mg L-1) O3 d egr ad ed (mg L -1 )
Fig. 5.Correlation between O3 degraded and concentration of AW I (ż), AW II ( ), and CW (Ÿ) in concentration rate of 0-80 mg L-1. Symbols
represent mean values of duplicate experiments, error bars represent one standard deviation.
4. Conclusion
The current study demonstrated there are strong linear correlations (R2 > 0.96) between the extent of ozone
degradation after 60 second reaction time and COD concentration for AW I and canteen wastewater in concentration range of 0-80 mg L-1. The ozone degradation rate and COD concentration of AW I and canteen wastewater exhibits
strong linear correlation (R2 > 0.92) in the same COD range. Test with various types of wastewaters is required to
evaluate the reliability and accuracy of this method compared to the standard method.
Acknowledgements
The authors would like to express their gratitude to Thai Government grant fiscal year B.E. 2555, and Office of the Higher Education (KMUTNB-NRU-56-05) for the financial support.
References
[1] Ahmed T, Bram K, Fatma EG, and L. Gratze. Treatment of anaerobically pre-treated domestic sewage by a rotating biological contactor Water Res 2002; 36:147-55.
[2] APHA Standard. Methods for the Examination of Water and Wastewater. 21sted. Washington, DC, USA: American Public Health Association, American Water Works Association, Water Environment Federation; 2005.
[3] Abuzaid NS, Al-Malack MH, El-Mubarak AH. An alternative method for determining of the chemical oxygen demand for colloidal polymeric wastewater Bull. Environ. Contamination Toxicol 1997; 59:626-30.
[4] Boyles W. The Science of Chemical Oxygen Demand: Technical Information Series, Booklet No. 9, Hach Company; 1997. [5] Westbroek P, Temmerma E. Anal Chim Acta 2001; 437: 95.
based on coulometric determination of electrochemical oxygen demand (EOD) using a surface oxidized copper electrode Anal Chim Acta 1999; 398:161-71.
[7] Kim YC, Lee KH, Sasaki S, Hashimoto K, Ikebukuro K, Karube I. Photocatalytic sensor for chemical oxygen demand determination based on oxygen electrode Anal Chem 2000; 72: 3379-82.
[8] Lee KH, Ishikawa T, Sasaki S, Arikawa Y, Karube I , Chemical oxygen demand (COD) sensor using a stopped-flow thin layer electrochemical cell, Electroanal, 1999, 11, 1172-79.
[9] Kim Y C, Satoshi S, Yano K, Hashimoto K, Karube I, Sasaki S. Photocatalytic sensor for determination of chemical oxygen demand using flow injection analysis. Anal Chim Acta, 2001, 432(1): 59-66
[10] Zhao H, Jiang D, Zhang S, Catterall K, John R. Development of a direct photoelectrochemical method for determination of chemical oxygen demand Anal Chem 2004; 76:155-60.