Industrial and Manufacturing Systems Engineering
Conference Proceedings and Posters
Industrial and Manufacturing Systems Engineering
2017
Analyzing Team Training Data: Aspirations for a
GIFT Data Analytics Engine
Stephen B. Gilbert
Iowa State University, [email protected]
Anne M. Sinatra
United States Army Research Laboratory
Anastacia MacAllister
Iowa State University, [email protected]
Adam Kohl
Iowa State University, [email protected]
Eliot Winer
Iowa State University, [email protected]
See next page for additional authors
Follow this and additional works at:
http://lib.dr.iastate.edu/imse_conf
Part of the
Ergonomics Commons,
Operational Research Commons, and the
Systems
Engineering Commons
This Conference Proceeding is brought to you for free and open access by the Industrial and Manufacturing Systems Engineering at Iowa State University Digital Repository. It has been accepted for inclusion in Industrial and Manufacturing Systems Engineering Conference Proceedings and Posters by an authorized administrator of Iowa State University Digital Repository. For more information, please [email protected].
Recommended Citation
Gilbert, Stephen B.; Sinatra, Anne M.; MacAllister, Anastacia; Kohl, Adam; Winer, Eliot; Dorneich, Michael C.; Slavina, Anna; Bonner, Desmond; and Ouverson, Kaitlyn M., "Analyzing Team Training Data: Aspirations for a GIFT Data Analytics Engine" (2017). Industrial and Manufacturing Systems Engineering Conference Proceedings and Posters. 99.
Authors
Stephen B. Gilbert, Anne M. Sinatra, Anastacia MacAllister, Adam Kohl, Eliot Winer, Michael C. Dorneich, Anna Slavina, Desmond Bonner, and Kaitlyn M. Ouverson
Analyzing Team Training Data:
Aspirations for a GIFT Data Analytics Engine
Stephen B. Gilbert1, Anne M. Sinatra2, Anastacia MacAllister1, Adam Kohl1, Eliot Winer1, Michael
Dorneich1, Anna Slavina1, Desmond Bonner1 Kaitlyn M. Ouverson1
Iowa State University1, U.S. Army Research Laboratory2
INTRODUCTION
The primary questions for any training situation are, “How well did the trainees do? Are they trained enough?” And of course there are secondary questions like, “Who did best/worst?” and “What were their major stumbling blocks?” If the trainees were running a footrace through an obstacle course, these questions would be relatively simple to answer. The measure of time to the finish line answers “how well” and “who did best/worst.” The number of stumbles on the obstacles could be counted as literal stumbling blocks. And a threshold based on previous performers could be used to answer whether they are trained enough. Un-fortunately, real-world training scenarios are typically much more complex, and answering these simple questions can be quite challenging. This paper discusses some of these challenges, especially in a team training setting.
In the footrace example, if the goal is to train people to run footraces, then the practice footrace is an ideal training environment. More likely, however, the footrace is a proxy for more generalizable skills such as speed and agility. The trainer likely hopes that performance at the footrace will serve as a predictor for performance in real-world scenarios that require those skills, e.g.. chasing a suspected terrorist through an urban environment on foot.
In this example, the trainer is essentially attempting to model the learner’s skills. The learner’s skills at this future real-world scenario are more difficult to measure for several reasons: 1) skills are not directly ob-servable like height and shoe size, 2) skills vary based on mood, motivation, fatigue, and moderating effects of the individual, 3) it is difficult to replicate the real-world scenario for training practice, and 4) relevant real-world scenarios can vary significantly. Thus, a good trainer designs a training experience that will ideally 1) enhance the skills needed for the real-world scenario and 2) provide an accurate prediction of how well the learners will perform on the real-world scenario.
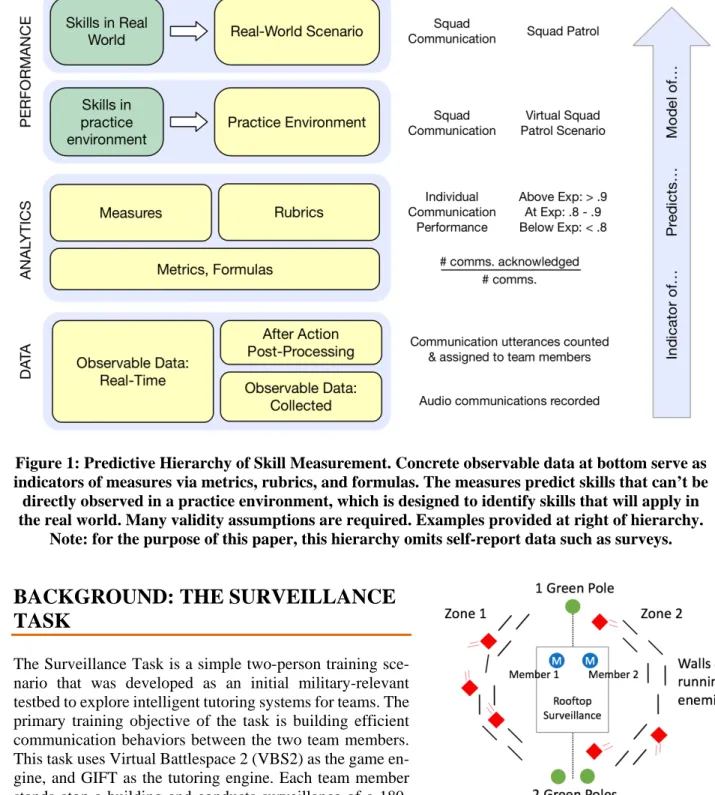
Figure 1 shows a predictive hierarchy of skill measurement that illustrates these ideas with an example. The example shows an attempt to model an individual’s communication skills and predict that individual’s per-formance in the battlefield based a virtual training scenario. However, this relatively simple example belies the complexity underlying a team measure. If the trainer wanted to model whether a particular team would excel at communication, individual communication performance measures would need to be combined with additional team performance measures, along with external factors such as the team members’ familiarity with each other and their individual levels of experience working on teams.
Researchers and scenario-based trainers have long searched for a systematic method of mapping trainees' behaviors in a technology-based training environment to skill measures. Stacy and Freeman, for example, are addressing this challenge by proposing the Human Performance Markup Language (2016). This paper describes how this challenge is addressed in a team tutor for a surveillance task using GIFT (Sottilare, Brawner, Goldberg, & Holden, 2012) as its tutoring engine. Measures of learning and performance are established by fusing data from the GIFT Event Reporting Tool, VBS2 messaging, and custom scripts that filter data for likely accidental extra keystrokes by participants. We document the assumptions required in
this tutor to infer conclusions about learning procedural task skills and abstract team skills from specific behavioral markers.
BACKGROUND: THE SURVEILLANCE
TASK
The Surveillance Task is a simple two-person training sce-nario that was developed as an initial military-relevant testbed to explore intelligent tutoring systems for teams. The primary training objective of the task is building efficient communication behaviors between the two team members. This task uses Virtual Battlespace 2 (VBS2) as the game en-gine, and GIFT as the tutoring engine. Each team member stands atop a building and conducts surveillance of a 180-degree zone: Member 1 takes the west 180-180-degree zone, and Member 2 takes the east zone (see Figure 2). During the sce-nario, enemies (OPFOR) appear from behind walls through-out the environment and move from place to place, some-times leaving one zone and entering the other. There are two
Figure 1: Predictive Hierarchy of Skill Measurement. Concrete observable data at bottom serve as indicators of measures via metrics, rubrics, and formulas. The measures predict skills that can’t be directly observed in a practice environment, which is designed to identify skills that will apply in the real world. Many validity assumptions are required. Examples provided at right of hierarchy.
Note: for the purpose of this paper, this hierarchy omits self-report data such as surveys.
Figure 2: Aerial view of Surveillance Task. Team members (blue M’s) alert each other if an enemy (red diamond) moves between zones.
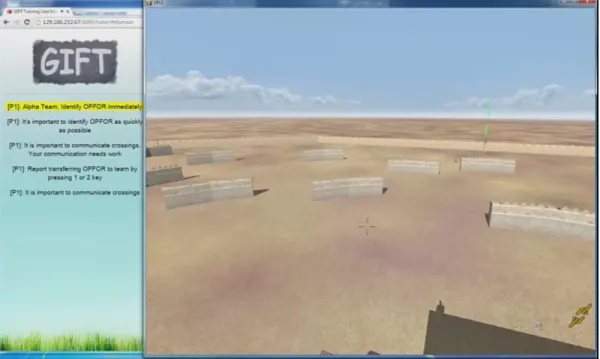
zone boundaries: one by the single green pole, and one by the double green pole. Approximately 50 OPFOR are involved, and the task requires five minutes to complete, growing in difficulty. Participants first watch a 3.5 minute training video, and then a 5-minute practice session. Then they did four consecutive trials. Figure 3 shows the screen that a learner might see in the Surveillance Task, with a portion of Zone 1 in view at right (along with the single green pole), and GIFT feedback appearing at left. Team members sit in separate closed offices, each with a computer and an open audio channel for communication.
Figure 3: This screenshot of the Surveillance Scenario Tutor shows Team Member 1 looking to-ward the boundary with one green pole (shown slightly right of center). The team members pan
back and forth to observe their full zones. Enemies (OPFOR) run out from behind walls. Team members alert each other if an enemy crosses zone boundaries. GIFT provides feedback at left.
Team members in the Surveillance Task have three duties, or subtasks. Participants’ instructions are in-cluded below based on the IRB-approved study protocol. The ITS feedback reinforces these instructions.
TRANSFER
• Whenever an enemy entity (OPFOR) is spotted moving towards the edge of your zone, indicate to your teammate that an OPFOR is approaching.
• You must inform your teammate if the OPFOR is approaching from the side with 1 POLE or from the side with 2 POLES.
• You do this by verbally communicating to your teammate as well as pressing the 1 or 2 key, cor-responding to the 1 POLE or 2 POLES boundary.
• If there are multiple OPFOR moving towards the same pole you may indicate their number ver-bally but you must press the appropriate transfer key (1 or 2) for EACH OPFOR.
ACKNOWLEDGE
• Whenever an OPFOR is transferred to you by your teammate you must acknowledge this commu-nication by pressing the E key.
• If multiple transfers are communicated, EACH transfer must be acknowledged.
IDENTIFY
• Whenever an OPFOR has transferred from your teammate’s zone to your zone, you must indicate that you have seen the OPFOR by pressing SPACEBAR.
• OPFOR entering your zone from the other zone must be identified even if they were not trans-ferred to you by your teammate.
• EACH OPFOR must be identified individually.
• Do not identify OPFOR that have not crossed into your zone yet.
These instructions reveal that the observable data we can gather from participants consists of a keystroke log with time stamps for the keys 1, 2, E, and spacebar, along with recorded audio of verbal utterances. The observable data we can log from the software consists primarily of the location of OPFOR as they run. Evaluation condition code was written for GIFT for each of these subtasks, so that the software can also offer us derivative data of performance evaluations such as Above Expectation, At Expectation, and Below Expectation at any moment in time.
After running participants in this training task, we wanted to ask research questions such as:
• How well did each participant perform with the Transfer, Acknowledge, and Identify subtasks? • How well did the team of participants do, particularly at communication overall?
• How does each team compare with other teams? • Did the feedback affect their performance?
To answer any of the these questions, we defined our terms, putting metrics, formulas, measures, and rubrics (ala Figure 1) together to measure constructs such as performance and communication. The remainder of the paper describes this process.
The creation and experimental use of the Surveillance Task has been described in more detail elsewhere (Bonner, Gilbert, et al., 2016; Bonner, Slavina, et al., 2016; Bonner, et al., 2015), but it is worth noting that the Surveillance Task can serve as powerful research platform for exploring the impact of different forms of feedback (textual vs. auditory, positive vs. negative, team-focused vs. individual focused, etc.). Also, the task can be easily scaled in difficulty by adjusting the quantity and timing of the running OPFOR. That said, the platform will only be as powerful as the data analysis available to it, which we explore in the next section.
BACKGROUND: THE EVENT REPORT TOOL WITHIN GIFT
GIFT records all the actions that take place within one of its tutors in log files. The Event Report Tool (ERT) in GIFT was initially developed to be able to extract data from the GIFT logs. As GIFT is a gener-alized framework that allows for courses to be used for instruction, research, and experiments, some flexi-bility is built into the ERT. When using GIFT for survey-based experimental data collection, the researcher can select Survey Results and merge files by Username or User ID. However, in order to examine more intricate performance and messages that were recorded in the logs by GIFT, often non-merged individual participant ERT outputs are necessary. When examining data for a single user, working with the ERT and organizing the data in a meaningful way can be challenging. When dealing with team data and multi-player data, it presents an even greater challenge keeping track of which action was done by which team member, and looking for patterns of interactions among team members.
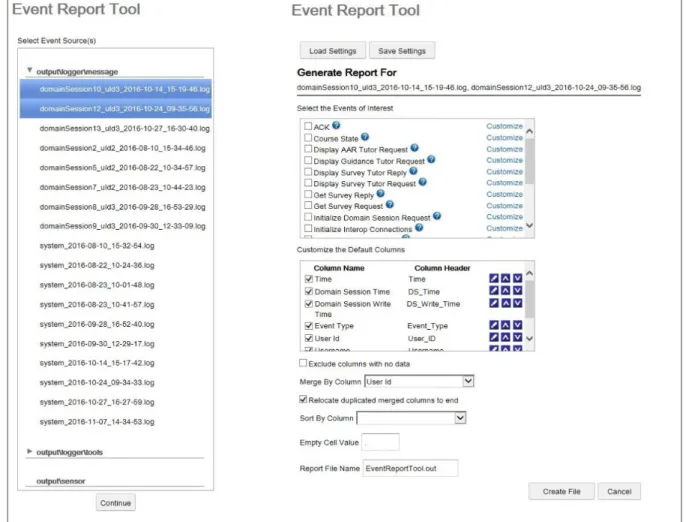
The ERT ultimately needs a way to organize linked data and actions in such a way that a researcher or instructor can easily make sense of it after the fact, a way to create metrics, formulas, and rubrics that can help researchers create data for their measures. By expanding GIFT for teams, the output tools will ulti-mately need to be adjusted as well. The desktop version is shown in Figure 4. As the tool continues to develop, it would be advantageous to consider adjustments that could support interrelated and team data. In order to analyze data from the current ERT, it is generally necessary to extract and clean the data manu-ally or write code to do so. In terms of Figure 1, the ERT provides the ability to extract the observable data (the lower section), but could benefit from analytics features that would allow the researcher to construct metrics, formulas, rubrics, and measures that could evaluate training constructs like individual performance and team performance.
While designing the domain and learner models can be difficult, we suggest that the process of designing the “analysis model” (containing the middle layers of Figure 1) can also be quite time consuming.
Figure 4. The document selection screen (left) and report generation selection page (right) from the Desktop version of the ERT.
DATA ANALYSIS FROM THE SURVEILLANCE TASK
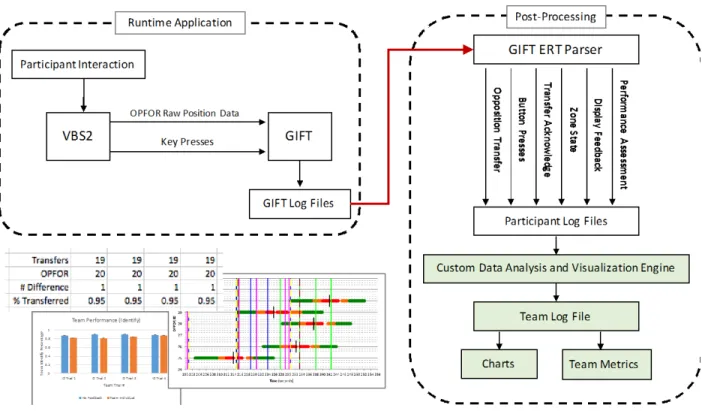
Table 1 shows some of the measures we wanted to use to analyze the Surveillance Task data and answer the research questions noted above. It is worth noting that while GIFT conditions have been programmed separately to give feedback based on real-time measures of performance, these measures are not always easily convertible to the measures we want for research questions. GIFT’s data logging is primarily de-signed to log data to be post-processed with the ERT. However, the ERT focuses more on data extraction than on enabling data analytics via formulas, metrics, and measures. Therefore, the team developed a cus-tom post-processing system in Python to create data using these analytic approaches (Figure 5).
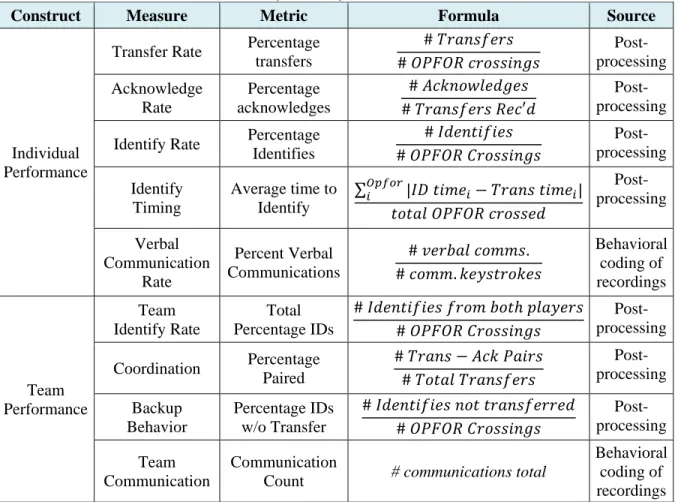
Table 1: Data Measures, Metrics, & Formulas for Surveillance Task
Construct Measure Metric Formula Source
Individual Performance
Transfer Rate Percentage transfers # 𝑇𝑇𝑇𝑇𝑇𝑇𝑇𝑇𝑇𝑇𝑇𝑇𝑇𝑇𝑇𝑇𝑇𝑇 # 𝑂𝑂𝑂𝑂𝑂𝑂𝑂𝑂𝑂𝑂 𝑐𝑐𝑇𝑇𝑐𝑐𝑇𝑇𝑇𝑇𝑐𝑐𝑇𝑇𝑐𝑐𝑇𝑇 Post- processing Acknowledge Rate Percentage acknowledges # 𝐴𝐴𝑐𝑐𝐴𝐴𝑇𝑇𝑐𝑐𝐴𝐴𝐴𝐴𝑇𝑇𝐴𝐴𝑐𝑐𝑇𝑇𝑇𝑇 # 𝑇𝑇𝑇𝑇𝑇𝑇𝑇𝑇𝑇𝑇𝑇𝑇𝑇𝑇𝑇𝑇𝑇𝑇 𝑂𝑂𝑇𝑇𝑐𝑐′𝐴𝐴 Post- processing Identify Rate Percentage
Identifies # 𝐼𝐼𝐴𝐴𝑇𝑇𝑇𝑇𝐼𝐼𝑐𝑐𝑇𝑇𝑐𝑐𝑇𝑇𝑇𝑇 # 𝑂𝑂𝑂𝑂𝑂𝑂𝑂𝑂𝑂𝑂 𝐶𝐶𝑇𝑇𝑐𝑐𝑇𝑇𝑇𝑇𝑐𝑐𝑇𝑇𝑐𝑐𝑇𝑇 Post- processing Identify Timing Average time to Identify ∑𝑂𝑂𝑂𝑂𝑂𝑂𝑂𝑂𝑂𝑂𝑖𝑖 |𝐼𝐼𝐼𝐼 𝐼𝐼𝑐𝑐𝑡𝑡𝑇𝑇𝑖𝑖− 𝑇𝑇𝑇𝑇𝑇𝑇𝑇𝑇𝑇𝑇 𝐼𝐼𝑐𝑐𝑡𝑡𝑇𝑇𝑖𝑖| 𝐼𝐼𝑐𝑐𝐼𝐼𝑇𝑇𝐴𝐴 𝑂𝑂𝑂𝑂𝑂𝑂𝑂𝑂𝑂𝑂 𝑐𝑐𝑇𝑇𝑐𝑐𝑇𝑇𝑇𝑇𝑇𝑇𝐴𝐴 Post- processing Verbal Communication Rate Percent Verbal Communications # 𝑣𝑣𝑇𝑇𝑇𝑇𝑣𝑣𝑇𝑇𝐴𝐴 𝑐𝑐𝑐𝑐𝑡𝑡𝑡𝑡𝑇𝑇. # 𝑐𝑐𝑐𝑐𝑡𝑡𝑡𝑡.𝐴𝐴𝑇𝑇𝑘𝑘𝑇𝑇𝐼𝐼𝑇𝑇𝑐𝑐𝐴𝐴𝑇𝑇𝑇𝑇 Behavioral coding of recordings Team Performance Team Identify Rate Total Percentage IDs # 𝐼𝐼𝐴𝐴𝑇𝑇𝑇𝑇𝐼𝐼𝑐𝑐𝑇𝑇𝑐𝑐𝑇𝑇𝑇𝑇 𝑇𝑇𝑇𝑇𝑐𝑐𝑡𝑡 𝑣𝑣𝑐𝑐𝐼𝐼ℎ 𝑝𝑝𝐴𝐴𝑇𝑇𝑘𝑘𝑇𝑇𝑇𝑇𝑇𝑇 # 𝑂𝑂𝑂𝑂𝑂𝑂𝑂𝑂𝑂𝑂 𝐶𝐶𝑇𝑇𝑐𝑐𝑇𝑇𝑇𝑇𝑐𝑐𝑇𝑇𝑐𝑐𝑇𝑇 Post- processing Coordination Percentage Paired # 𝑇𝑇𝑇𝑇𝑇𝑇𝑇𝑇𝑇𝑇 − 𝐴𝐴𝑐𝑐𝐴𝐴 𝑂𝑂𝑇𝑇𝑐𝑐𝑇𝑇𝑇𝑇 # 𝑇𝑇𝑐𝑐𝐼𝐼𝑇𝑇𝐴𝐴 𝑇𝑇𝑇𝑇𝑇𝑇𝑇𝑇𝑇𝑇𝑇𝑇𝑇𝑇𝑇𝑇𝑇𝑇 Post- processing Backup Behavior Percentage IDs w/o Transfer # 𝐼𝐼𝐴𝐴𝑇𝑇𝑇𝑇𝐼𝐼𝑐𝑐𝑇𝑇𝑐𝑐𝑇𝑇𝑇𝑇 𝑇𝑇𝑐𝑐𝐼𝐼 𝐼𝐼𝑇𝑇𝑇𝑇𝑇𝑇𝑇𝑇𝑇𝑇𝑇𝑇𝑇𝑇𝑇𝑇𝑇𝑇𝐴𝐴 # 𝑂𝑂𝑂𝑂𝑂𝑂𝑂𝑂𝑂𝑂 𝐶𝐶𝑇𝑇𝑐𝑐𝑇𝑇𝑇𝑇𝑐𝑐𝑇𝑇𝑐𝑐𝑇𝑇 Post- processing Team Communication Communication
Count # communications total
Behavioral coding of recordings
After individual participant data files were extracted from ERT in CSV format, they were grouped in team folders. Because each two-person team participated in four trials, there were eight CSV files in each folder. Each team folder could then be imported into the custom data analysis and visualization engine.
At first, post-processing was not a seamless and repeatable process because the ERT did not produce clean interpretable data for analysis. Even though the researcher now had access to information about each player’s actions, the formatted CSV files did not provide an understandable representation of the data. They contained a mix of button presses, OPFOR zone states, feedback messages from the tutor, and performance assessments by GIFT. The heart of the custom data analysis engine was a method of structuring the data for each team member to encompass all events needed for metric creation.
Figure 5: Flowchart of data analysis for the Surveillance Task. Participant key presses are combined with OPFOR position data in GIFT and logged. Data extracted from ERT and processed by a Py-thon-based analysis engine to rearrange data for analysis on a team basis. Green boxes represent custom software development for the Surveillance Task. At lower left are example outputs created for Microsoft Excel.
First, a team’s participant log files were read into the python-based program and parsed by event type. Next, Team Factory class within the software assigned lists of each event type to the team. It’s important to note each event contained its own time information, but Team Factory linked them together according to each task. Once parsed and stored, a Metric Manager class created Microsoft Excel spreadsheets containing the metrics and visualizations desired for research analysis. This custom analysis engine save the researchers hours of time by visualizing the data in ways that could be useful to analyze. Additional technical details about the custom data analysis and visualization engine are described elsewhere (MacAllister, et al., 2017).
The Importance of Visualization
As data analysis progressed, it became apparent that the “macro” measures shown in Table 1 were not sufficient to characterize the teams’ behavior. Two teams with high Identify Rates, for example, might have very different performance overall. Some teams seemed anecdotally to have different “styles” that were recognizable by the research assistants who ran the participants themselves (“This team communicates a lot” vs. “The team is dominated by one person,” etc.), but these patterns or styles were not appearing in the data. The measures in Table 1 were too high in the Predictive Hierarchy shown in Figure 1; we need to see more raw data about the OPFOR themselves. How did they move across the border, and how did the team members react during that movement?
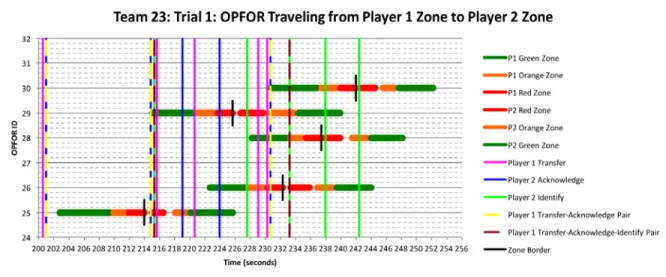
To this end, timeline charts were created for each OPFOR (example shown in Figure 6) that illustrated the zone border crossing process of each OPFOR. Consider that the zone crossing border had a red zone on each side, closest to the exact border, flanked by an orange zone on each side, further from the border, and
a green zone on each side, furthest from the border. In the timeline diagram, horizontal bars with those colors are drawn when the OPFOR occupies those zones. The exact border is shown as a short vertical black line between the two red zones. Then, participant actions are indicated by vertical lines. In the ideal performance, there is a Transfer, then an Acknowledge, and then an Identify, all with appropriate timing. When this timing occurred, striped lines were indicated.
Figure 6: Excerpt of Timeline Chart showing multiple OPFOR paths across the zone borders (hori-zontal stripes with the border as a short vertical black line). In this figure, five OPFOR cross the boundary at approximately the same time, presenting high cognitive load for participants. Team member Transfer, Acknowledge, and Identify actions are shown as vertical lines. When actions are well-timed, they are designated as “pairs” with striped lines.
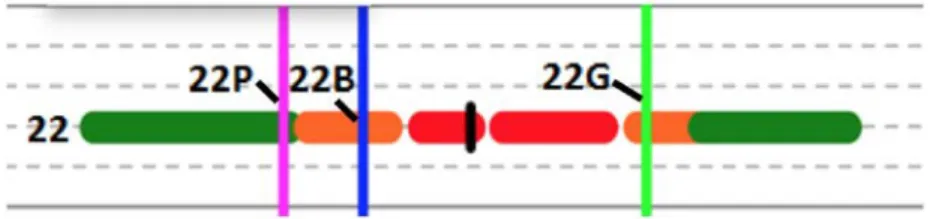
It was at this point in the analysis that one of the key difficulties of our Surveillance Task design arose to pose an especially onerous challenge in data analysis. It is not clear, for example, when a group of OPFOR are crossing the border, and a participant indicates Identify three times, which Identify action maps to which OPFOR. Sometimes it is obvious from the timing, but oftentimes not, because it is precisely when the task gets stressful with many OPFOR that participants begin to omit actions. Thus, it can be difficult to map actions to OPFOR when there are, say, five OPFOR and only three Identifies. Or, if a participant is partic-ularly prone to accidentally pressing keys multiple times when only one press is intended, e.g., during the heat of a high cognitive load task, should the parser flag the later presses as extra or the initial presses? To address these challenges, the research team developed Data Analysis, Labeling & Interpretation (DALI) Rules for these timeline diagrams. Using these rules, three human labelers were asked to assign every ver-tical line to an OPFOR or mark it as extra for 10% of the data. Once interrater reliability was established, one rater continued to mark the rest of the data. The DALI rules had clarifications of how to resolve ambi-guities, like “If you have 2 Green lines, as long as they’re both after the pink and blue lines, accept the first green and mark the 2nd green as Extra.” This approach led to hand labeling as shown in Figure 7. Once the
labels were placed, data could be added to an Excel sheet, and further automated processing could take place.
The research team was disappointed that manual labelling was required, and briefly attempted to automate the process. However, it was quickly discovered that the ambiguities of a border crowded with OPFOR led to such complicated software rules that it would actually be faster for the team the develop the DALI rules and manually label all 136 stripe diagrams (including some duplicate labeling by multiple raters to ensure good interrater reliability) than it would be to develop and carefully test software rules.
Figure 7: Hand-labeled pink, blue, and green vertical lines to map them to each OPFOR.
Data analysis based on timelines and DALI rules is currently underway, and will ideally lead to better understanding of the team behavior. These more detailed data will lead to team metrics such as coordina-tion timing (how quickly one teammate responds to the other), coordination symmetry (whether each teammate responds equally quickly to the other), team style (unique transfer-acknowledge-identify timing patterns that we have noticed anecdotally can make teams identifiable), and team cognitive capacity (at what point are there too many OPFOR for a team). These more detailed metrics will be much more in-formative than the Table 1 Macro Metrics. We look forward to describing these results in a future paper.
CONCLUSIONS AND RECOMMENDATIONS FOR GIFT
This case study of data analysis of a team tutor illustrates the significant challenges of analyzing complex team data, even for what seems like a relatively simple task from the participants’ perspective. As demon-strated, the full spectrum of predictive data analytics and interpretation (ala Figure 1) was needed to evaluate the result of the Surveillance Task. The authors conclude that a system for complete end-to-end assessment of a team’s team skills and task skills based on members’ performance in a simulation will indeed need to draw on the full predictive hierarchy of skill measurement. The specific elements in the hierarchy may differ by team scenario, but elements at each of the three main levels of the hierarchy (data, analytics, performance) will need to be present for team assessment.
As described above, GIFT currently has no tools for data analytics and visualization. This lack could point to a future vision of a GIFT InfoVis module, or to not reinvent the wheel, perhaps GIFT could create APIs that allow easy movement of data to Tableau, R, and other visualization tools. In addition, as described in the section about the ERT, it will be critical for team tutoring in the future for GIFT to allow data from multiple team members to be affiliated for easy analysis.
REFERENCES
Bonner, D., Gilbert, S., Dorneich, M. C., Winer, E., Sinatra, A. M., Slavina, A., et al. (2016). The Challenges of
Building Intelligent Tutoring Systems for Teams. Paper presented at the Human Factors & Ergonomics
Society (HFES) Annual Meeting, Washington, D.C.
Bonner, D., Slavina, A., MacAllister, A., Holub, J., Gilbert, S., Sinatra, A. M., et al. (2016). The Hidden Challenges of Team Tutor Development. In R. Sottilare & S. Ososky (Eds.), Proceedings of 4th Annual GIFT Users
Symposium (GIFTSym4) (pp. 49-60): U.S. Army Research Laboratory.
Bonner, D., Walton, J., Dorneich, M. C., Gilbert, S. B., Winer, E., & Sottilare, R. A. (2015). The Development of a Testbed to Assess an Intelligent Tutoring System for Teams. In Proceedings of the Workshops at AIED 2015. Madrid, Spain.
MacAllister, A., Kohl, A., Gilbert, S., Winer, E., Dorneich, M., Bonner, D., et al. (2017). Analysis of Team Tutoring
Training Data. Paper presented at the MODSIM World 2017, Virginia Beach, VA.
Sottilare, R., Brawner, K. W., Goldberg, B. S., & Holden, H. K. (2012). The Generalized Intelligent Framework for Tutoring (GIFT).
Stacy, W., & Freeman, J. (2016). Training objective packages: enhancing the effectiveness of experiential training.
Theoretical Issues in Ergonomics Science, 17(2), 149-168.
ABOUT THE AUTHORS
Dr. Stephen B. Gilbert, is an associate director of the Virtual Reality Applications Center and assistant
professor of Industrial and Manufacturing Systems Engineering at Iowa State University. His research interests focus on technology to advance cognition, including interface design, intelligent tutoring systems, and cognitive engineering. He is a member of IEEE and ACM and works closely with industry and federal agencies on research contracts. He is currently PI on a project supporting the U.S. Army Research Labor-atory STTC in future training technologies for teams.
Dr. Anne M. Sinatra is an Adaptive Tutoring Scientist and Research Psychologist at U.S. Army Research
Laboratory. She is the team modeling vector lead on the GIFT project’s Adaptive Training Team. Her background is in human factors psychology, cognitive psychology, and education.
Anastacia MacAllister, MS is a PhD student in Mechanical Engineering and Human-Computer Interaction
at Iowa State University’s Virtual Reality Applications Center. She is working on developing Augmented Reality work instructions for complex assembly and intelligent team tutoring systems.
Adam Kohl is a MS student in Mechanical Engineering and Human-Computer Interaction at Iowa State
University’s Virtual Reality Applications Center. He is working on developing pattern recognition tech-niques to enhance n-dimensional data visualization methods.
Dr. Michael C. Dorneich is an Associate Professor at Iowa State University in the Industrial and
Manu-facturing Systems Engineering Department. His background in in human factors and cognitive engineering, and his research interests focus on creating adaptive human-machine systems in intelligent tutoring, auto-mation, and displays.
Dr. Eliot Winer is an associate director of the Virtual Reality Applications Center and professor of
Me-chanical Engineering and Electrical and Computer Engineering at Iowa State University. He is currently co-leading an effort to develop a next-generation mixed-reality virtual and constructive training environ-ment for the U.S. Army. Dr. Winer has over 15 years of experience working in virtual reality and 3D com-puter graphics technologies on sponsored projects for the Department of Defense, Air Force Office of Sci-entific Research, Department of the Army, National Science Foundation, Department of Agriculture, Boe-ing, and John Deere.
Desmond Bonner, MS, is a PhD student in Human Computer Interaction and Industrial Engineering at
Iowa State University. He serves as an assistant researcher on the Adaptive Team Training Project. His background is in interactive design.
Anna Slavina, MS, is a Ph.D. student in Psychology, Education, and Human-Computer Interaction at Iowa
State University's Virtual Reality Applications Center. Her research interests include the effects of technol-ogy on memory, intelligent tutoring systems, and visually induced motion sickness.
Kaitlyn M Ouverson is a MS student in Human-Computer Interaction at Iowa State University’s Virtual
Reality Applications Center. Her background in experimental, social and cognitive psychology drives her interest in team facilitation in the virtual world, the real world, and any mix of the two.